

How do phenology, plasticity, and evolution determine the fitness consequences of climate change for montane butterflies?
- PMID: 30151036
- PMCID: PMC6099808
- DOI: 10.1111/eva.12618
How do phenology, plasticity, and evolution determine the fitness consequences of climate change for montane butterflies?
Abstract
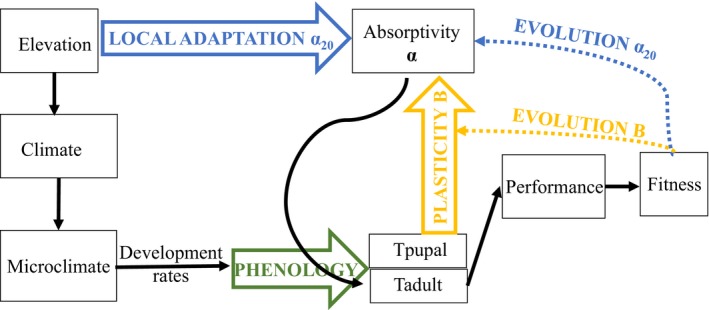
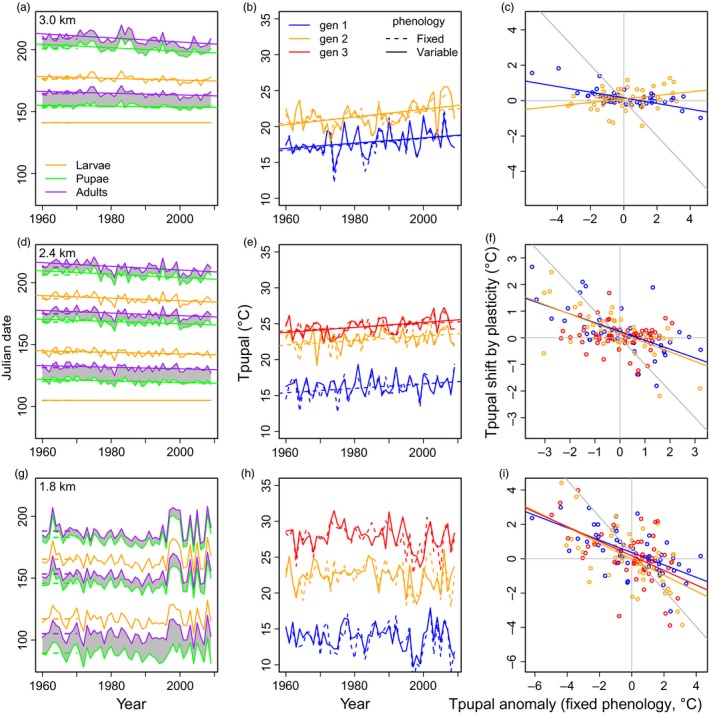
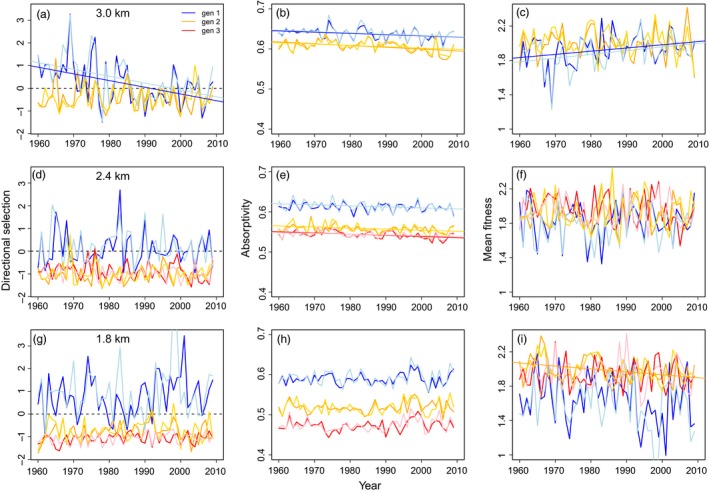
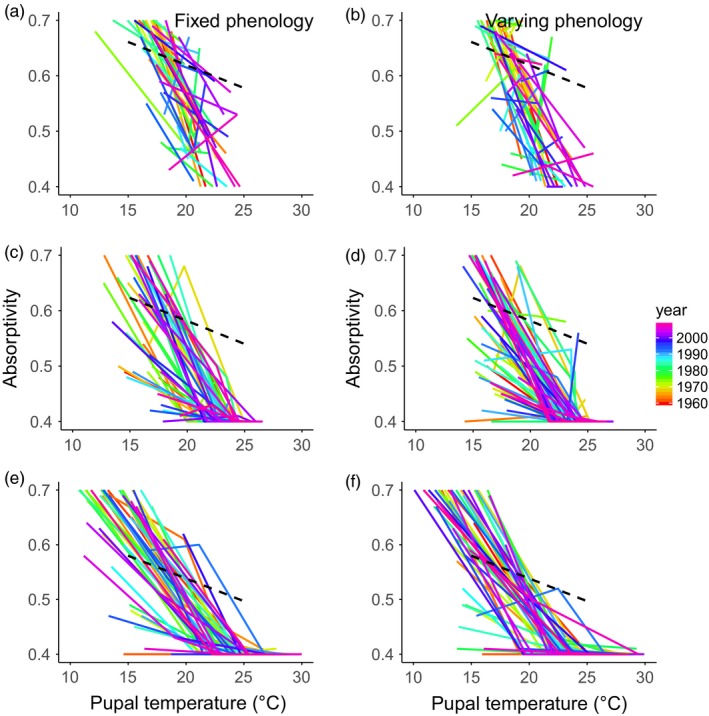
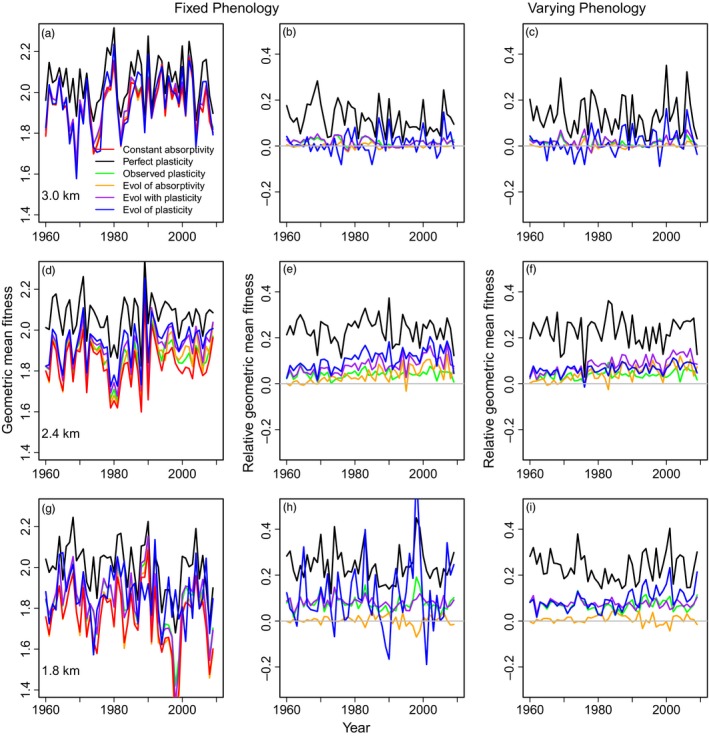
Species have responded to climate change via seasonal (phenological) shifts, morphological plasticity, and evolutionary adaptation, but how these responses contribute to changes and variation in population fitness are poorly understood. We assess the interactions and relative importance of these responses for fitness in a montane butterfly, Colias eriphyle, along an elevational gradient. Because environmental temperatures affect developmental rates of each life stage, populations along the gradients differ in phenological timing and the number of generations each year. Our focal phenotype, wing solar absorptivity of adult butterflies, exhibits local adaptation across elevation and responds plastically to developmental temperatures. We integrate climatic data for the past half-century with microclimate, developmental, biophysical, demographic, and evolutionary models for this system to predict how phenology, plasticity, and evolution contribute to phenotypic and fitness variation along the gradient. We predict that phenological advancements incompletely compensate for climate warming, and also influence morphological plasticity. Climate change is predicted to increase mean population fitness in the first seasonal generation at high elevation, but decrease mean fitness in the summer generations at low elevation. Phenological shifts reduce the interannual variation in directional selection and morphology, but do not have consistent effects on variation in mean fitness. Morphological plasticity and its evolution can substantially increase population fitness and adaptation to climate change at low elevations, but environmental unpredictability limits adaptive plastic and evolutionary responses at high elevations. Phenological shifts also decrease the relative fitness advantages of morphological plasticity and evolution. Our results illustrate how the potential contributions of phenological and morphological plasticity and of evolution to climate change adaptation can vary along environmental gradients and how environmental variability will limit adaptive responses to climate change in montane regions.
Keywords: adaptation; climate change; ectotherms; evolution; fitness consequences; phenology; plasticity.
Figures
Similar articles
-
Evolution of plasticity and adaptive responses to climate change along climate gradients.Proc Biol Sci. 2017 Aug 16;284(1860):20170386. doi: 10.1098/rspb.2017.0386. Proc Biol Sci. 2017. PMID: 28814652 Free PMC article.
-
Climate variability slows evolutionary responses of Colias butterflies to recent climate change.Proc Biol Sci. 2015 Mar 7;282(1802):20142470. doi: 10.1098/rspb.2014.2470. Proc Biol Sci. 2015. PMID: 25631995 Free PMC article.
-
Insect Development, Thermal Plasticity and Fitness Implications in Changing, Seasonal Environments.Integr Comp Biol. 2017 Nov 1;57(5):988-998. doi: 10.1093/icb/icx032. Integr Comp Biol. 2017. PMID: 28662575
-
Vertebrate Phenological Plasticity: From Molecular Mechanisms to Ecological and Evolutionary Implications.Integr Comp Biol. 2022 Oct 29;62(4):958-971. doi: 10.1093/icb/icac121. Integr Comp Biol. 2022. PMID: 35867980 Review.
-
Phenological and elevational shifts of plants, animals and fungi under climate change in the European Alps.Biol Rev Camb Philos Soc. 2021 Oct;96(5):1816-1835. doi: 10.1111/brv.12727. Epub 2021 Apr 27. Biol Rev Camb Philos Soc. 2021. PMID: 33908168 Review.
Cited by
-
Linking inter-annual variation in environment, phenology, and abundance for a montane butterfly community.Ecology. 2020 Jan;101(1):e02906. doi: 10.1002/ecy.2906. Epub 2019 Nov 29. Ecology. 2020. PMID: 31560801 Free PMC article.
-
Sparse evidence for selection on phenotypic plasticity in response to temperature.Philos Trans R Soc Lond B Biol Sci. 2019 Mar 18;374(1768):20180185. doi: 10.1098/rstb.2018.0185. Philos Trans R Soc Lond B Biol Sci. 2019. PMID: 30966967 Free PMC article.
-
Adaptations, life-history traits and ecological mechanisms of parasites to survive extremes and environmental unpredictability in the face of climate change.Int J Parasitol Parasites Wildl. 2020 Jul 31;12:308-317. doi: 10.1016/j.ijppaw.2020.07.006. eCollection 2020 Aug. Int J Parasitol Parasites Wildl. 2020. PMID: 33101908 Free PMC article.
-
Using museum specimens to track morphological shifts through climate change.Philos Trans R Soc Lond B Biol Sci. 2018 Nov 19;374(1763):20170404. doi: 10.1098/rstb.2017.0404. Philos Trans R Soc Lond B Biol Sci. 2018. PMID: 30455218 Free PMC article.
-
Host-Parasitoid Phenology, Distribution, and Biological Control under Climate Change.Life (Basel). 2023 Nov 30;13(12):2290. doi: 10.3390/life13122290. Life (Basel). 2023. PMID: 38137891 Free PMC article. Review.
References
-
- Anderson, J. T. , Inouye, D. W. , McKinney, A. M. , Colautti, R. I. , & Mitchell‐Olds, T. (2012). Phenotypic plasticity and adaptive evolution contribute to advancing flowering phenology in response to climate change. Proceedings of the Royal Society B: Biological Sciences, 279, 3843–3852. 10.1098/rspb.2012.1051 - DOI - PMC - PubMed
-
- van Asch, M. , Salis, L. , Holleman, L. J. M. , van Lith, B. , & Visser, M. E. (2013). Evolutionary response of the egg hatching date of a herbivorous insect under climate change. Nature Climate Change, 3(3), 244–248. https://doi.org/www.nature.com/nclimate/journal/v3/n3/abs/nclimate1717.h...
-
- Brakefield, P. M. (1987). Tropical dry and wet season polyphenism in the butterfly Melanitis leda (Satyrinae): Phenotypic plasticity and climatic correlates. Biological Journal of the Linnean Society, 31, 175–191. 10.1111/j.1095-8312.1987.tb01988.x - DOI
Associated data
LinkOut - more resources
Full Text Sources
Other Literature Sources
Miscellaneous
