

Sunning themselves in heaps, knots, and snarls: The extraordinary abundance and demography of island watersnakes
- PMID: 30151166
- PMCID: PMC6106160
- DOI: 10.1002/ece3.4191
Sunning themselves in heaps, knots, and snarls: The extraordinary abundance and demography of island watersnakes
Abstract
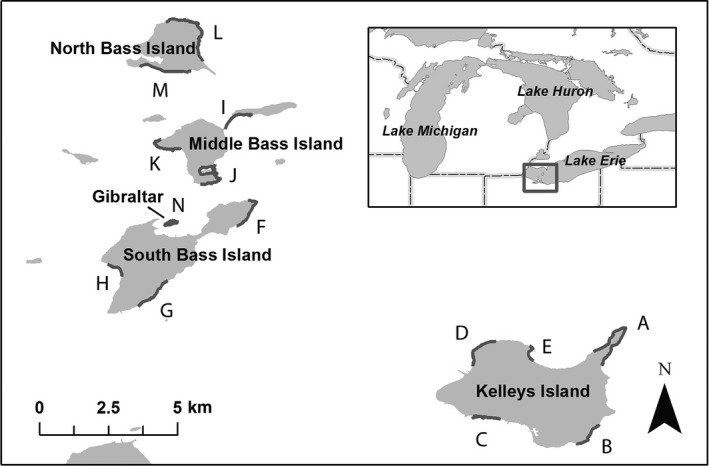
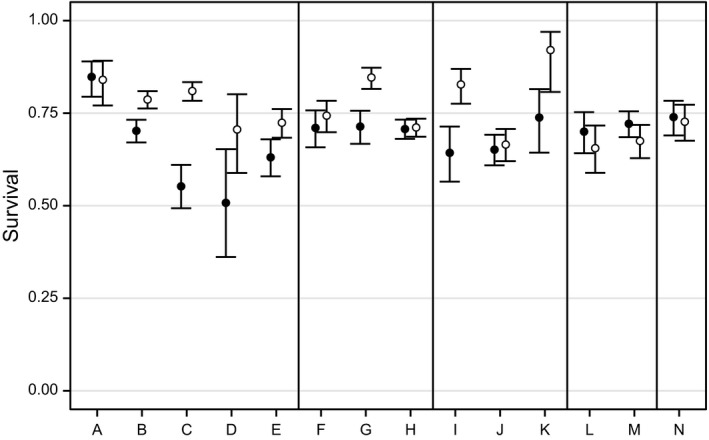
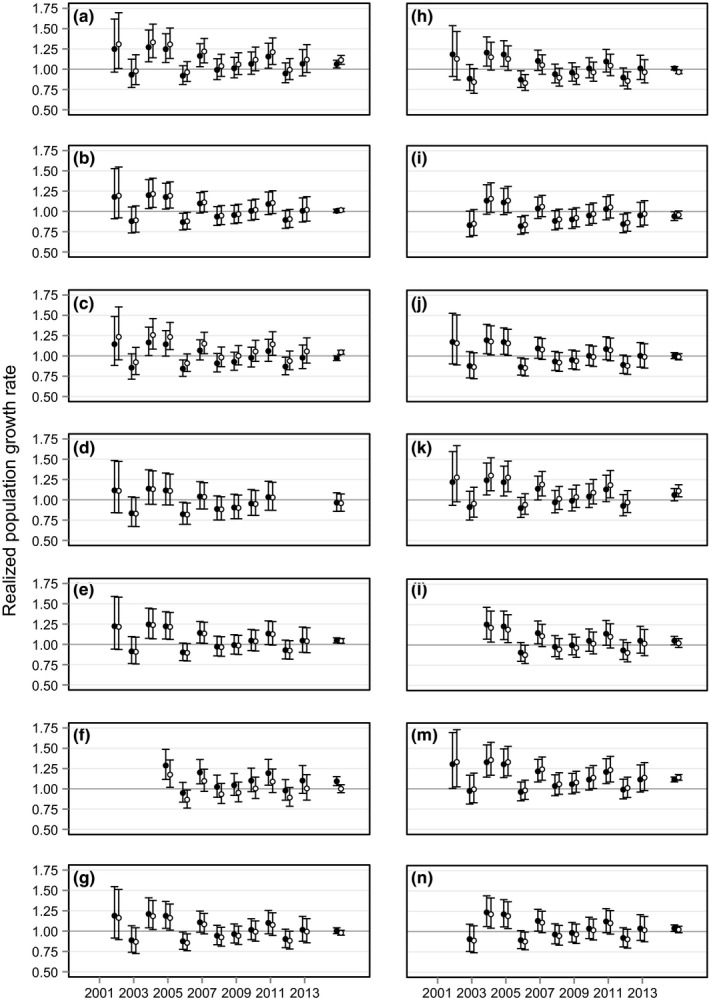
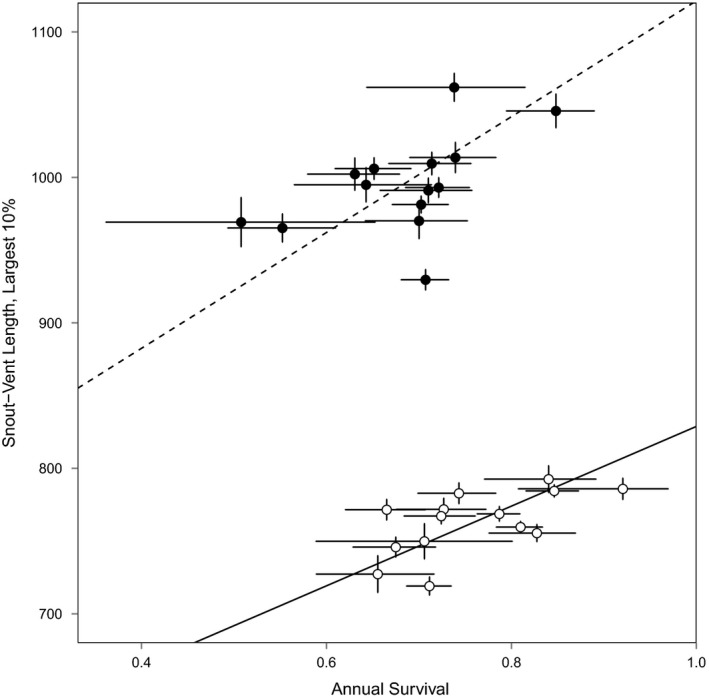
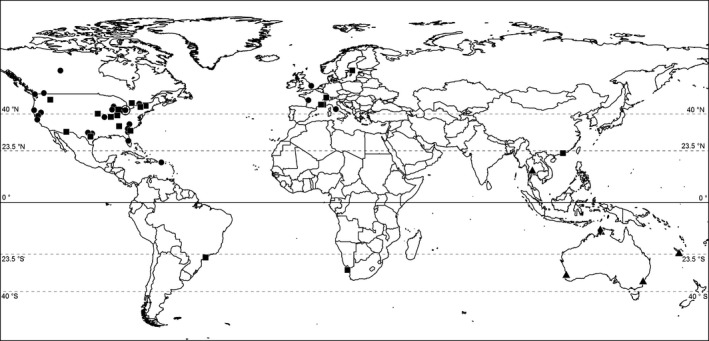
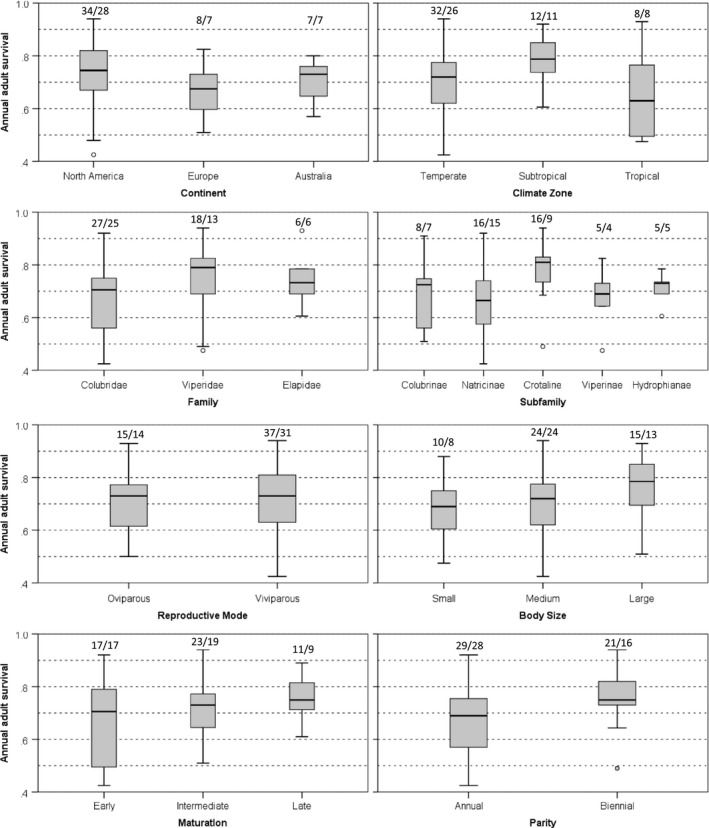
Snakes represent a sizable fraction of vertebrate biodiversity, but until recently, data on their demography have been sparse. Consequently, generalizations regarding patterns of variation are weak and the potential for population projections is limited. We address this information gap through an analysis of spatial and temporal variation in demography (population size, annual survival, and realized population growth) of the Lake Erie Watersnake, Nerodia sipedon insularum, and a review of snake survival more generally. Our study spans a period during which the Lake Erie Watersnake was listed as threatened under the U.S. Endangered Species Act, recovered, and was delisted. We collected capture-mark-recapture data at 14 study sites over 20 years, accruing 20,000 captures of 13,800 individually marked adults. Lake Erie Watersnakes achieve extraordinary abundance, averaging 520 adults per km of shoreline (ca. 260 adult per ha) at our study sites (range = 160-1,600 adults per km; ca. 80-800 adults per ha) and surpassing population recovery and postdelisting monitoring criteria. Annual survival averages 0.68 among adult females and 0.76 among adult males, varies among sites, and is positively correlated with body size among study sites. Temporal process variance in annual survival is low, averaging 0.0011 or less than 4% of total variance; thus, stochasticity in annual survival may be of minor significance to snake extinction risk. Estimates of realized population growth indicate that population size has been stable or increasing over the course of our study. More generally, snake annual survival overlaps broadly across continents, climate zones, families, subfamilies, reproductive modes, body size categories, maturation categories, and parity categories. Differences in survival in relation to size, parity, and maturation are in the directions predicted by life history theory but are of small magnitude with much variation around median values. Overall, annual survival appears to be quite plastic, varying with food availability, habitat quality, and other ecological variables.
Keywords: body size; capture–mark–recapture; life history; population estimation; process variance; realized population growth; survival; vital rates.
Figures
References
-
- Ajtic, R. , Tomovic, L. , Sterijovski, B. , Crnobrnja‐Isailovic, J. , Djordjevic, S. , Djurakic, M. , … Bonnet, X. (2013). Unexpected life history traits in a very dense population of dice snakes. Zoologischer Anzeiger, 252, 350–358. 10.1016/j.jcz.2012.10.001 - DOI
-
- Akçakaya, H. R. (2004). Using models for species conservation and management: An introduction In Akçakaya H. R., Burgman M. A., Kindvall O., Wood C. C., Sjogren‐Gulve P., Hatfield J. S. & McCarthy M. A. (Eds.), Species conservation and management: Case studies (pp. 3–14). New York, NY: Oxford University Press.
-
- Akçakaya, H. R. , & Root, W. (2002). RAMAS Metapop: Viability analysis for stage‐structured metapopulations. Setauket, NY: Applied Biomathematics.
-
- Altwegg, R. , Dummermuth, S. , Anholt, B. R. , & Flatt, T. (2005). Winter weather affects asp viper Vipera aspis population dynamics through susceptible juveniles. Oikos, 110, 55–66. 10.1111/j.0030-1299.2001.13723.x - DOI
-
- Anderson, D. R. (2008). Model based inference in the life sciences: A primer on evidence. New York, NY: Springer.
Associated data
LinkOut - more resources
Full Text Sources
Other Literature Sources
Miscellaneous
