. 2018 Jul 31:2018:1568414.
doi: 10.1155/2018/1568414. eCollection 2018.

Ouabain Does Not Induce Selective Spiral Ganglion Cell Degeneration in Guinea Pigs

Affiliations

Ouabain Does Not Induce Selective Spiral Ganglion Cell Degeneration in Guinea Pigs

Timo Schomann et al. Biomed Res Int. .

Abstract

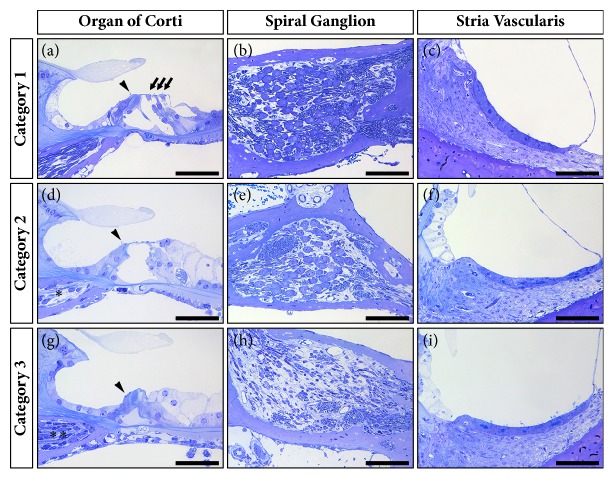
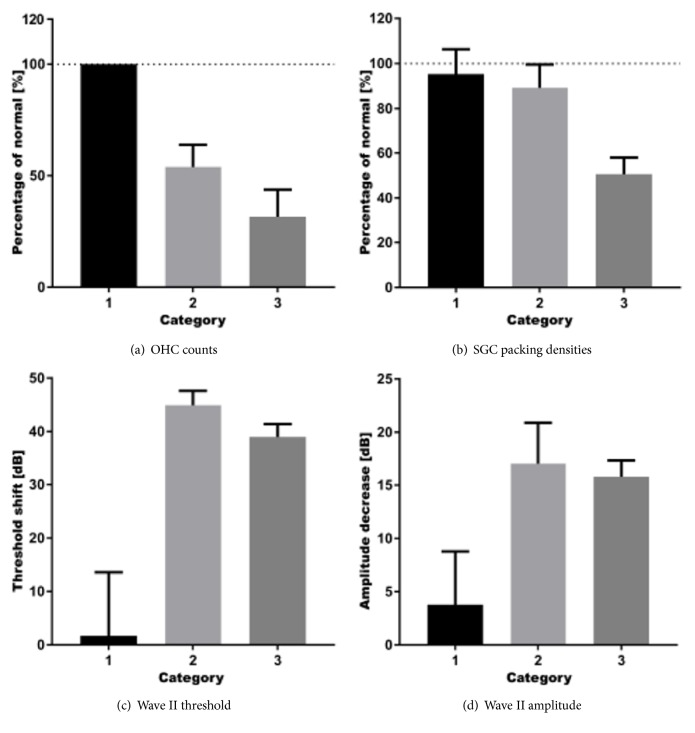
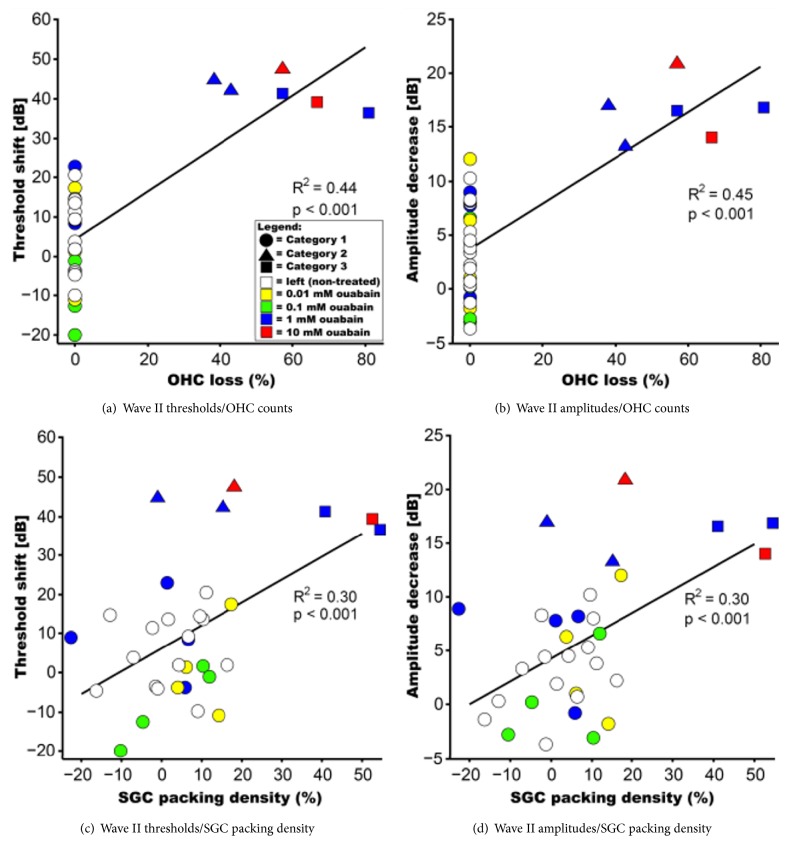
Round window membrane (RWM) application of ouabain is known to selectively destroy type I spiral ganglion cells (SGCs) in cochleas of several rodent species, while leaving hair cells intact. This protocol has been used in rats and Mongolian gerbils, but observations in the guinea pig are conflicting. This is why we reinvestigated the effect of ouabain on the guinea pig cochlea. Ouabain solutions of different concentrations were placed, in a piece of gelfoam, upon the RWM of the right cochleas. Auditory function was assessed using acoustically evoked auditory brainstem responses (aABR). Finally, cochleas were fixed and processed for histological examination. Due to variability within treatment groups, histological data was pooled and three categories based upon general histological observations were defined: cochleas without outer hair cell (OHC) and SGC loss (Category 1), cochleas with OHC loss only (Category 2), and cochleas with OHC and SGC loss (Category 3). Animals treated with 1 mM or 10 mM ouabain showed shifts in hearing thresholds, corresponding with varying histological changes in their cochleas. Most cochleas exhibited complete outer hair cell loss in the basal and middle turns, while some had no changes, together with either moderate or near-complete loss of SGCs. Neither loss of inner hair cells nor histological changes of the stria vascularis were observed in any of the animals. Cochleas in Category 1 had normal aABRs and morphology. On average, in Category 2 OHC loss was 46.0±5.7%, SGC loss was below threshold, ABR threshold shift was 44.9±2.7 dB, and ABR wave II amplitude was decreased by 17.1±3.8 dB. In Category 3 OHC loss was 68.3±6.9%, SGC loss was 49.4±4.3%, ABR threshold shift was 39.0±2.4 dB, and ABR amplitude was decreased by 15.8±1.6 dB. Our results show that ouabain does not solely destroy type I SGCs in the guinea pig cochlea.


Figures

Figure 1
Figure 1
Histology of the guinea pig cochlea. The midmodiolar section of a guinea pig cochlea shows 8 different locations (basal = B1, B2; middle = M1, M2; apical = A1, A2, A3, and A4) along the cochlear spiral at a half-turn spacing (not showing the helicotrema). The number of SGCs in the spiral ganglion (SG) were counted and the number of hair cells (IHCs and OHCs) in the organ of Corti (OC) was determined for each location, except A4.
Figure 2
Figure 2
Acoustically evoked auditory brainstem responses (aABRs) were recorded before and after treatment with ouabain. (a+b) Example of an animal treated with 10 mM ouabain revealing a dramatic aABR threshold shift in the right (treated) cochlea (b), while the responses in the left (untreated) cochlea (a) remained normal. (c+d) Example of an animal treated with 1 mM ouabain showing a moderate increase of the aABR threshold in the right (treated) cochlea (d), while the aABR threshold in the left (untreated) cochlea (c) remained normal. (e) Wave I threshold increased substantially after treatment with 1 mM and 10 mM ouabain. There was no significant threshold shift after treatment with lower concentrations (0.1 mM and 0.01 mM). Left (untreated) ears and right ears treated with PBS alone served as control. (f) Four days after treatment, wave I amplitudes had also decreased substantially in the cochleas treated with 1 mM and 10 mM ouabain, but not with lower concentrations (0.1 mM and 0.01 mM). Left (untreated) ears and right ears treated with PBS alone served as control. (g) Within 4 days after treatment with 1 mM and 10 mM ouabain, wave II threshold increased substantially. There was no significant threshold shift after treatment with lower concentrations (0.1 mM and 0.01 mM). Left (untreated) ears and right ears treated with PBS alone served as control. (h) Wave II amplitudes also decreased substantially in the cochleas treated with 1 mM and 10 mM ouabain 4 days after treatment, but not with lower concentrations (0.1 mM and 0.01 mM). Left (untreated) ears and right ears treated with PBS alone served as control. (i) Seven days after treatment, wave I thresholds were still substantially elevated in animals treated with 1 mM ouabain. There was no significant threshold shift after treatment with lower concentrations (0.1 mM and 0.01 mM). Left (untreated) ears and right ears treated with PBS alone served as control. (j) Wave I amplitudes remained substantially decreased in cochleas 7 days after treatment with 1 mM ouabain. Animals treated with lower concentrations (0.1 mM and 0.01 mM) did not display significant decrease in wave I amplitude. Left (untreated) ears and right ears treated with PBS alone served as control. (k) Wave II thresholds remained substantially elevated in animals 7 days after treatment with 1 mM ouabain. There was no significant threshold shift after treatment with lower concentrations (0.1 mM and 0.01 mM). Left (untreated) ears and right ears treated with PBS alone served as control. (l) Seven days after treatment with 1 mM ouabain, wave II amplitudes remained substantially decreased in these animals. Animals treated with lower concentrations (0.1 mM and 0.01 mM) did not display significant decrease in wave II amplitude. Left (untreated) ears and right ears treated with PBS alone served as control. Thresholds (e, g, i, and k) and amplitudes (f, h, j, and l) are expressed as change (in dB) from pretreatment levels. Differences in amplitudes of contralateral ears between animals treated with 1 mM and 10 mM are within the normal range of the animals. Error bars represent SD; = p ≤ 0.05, ∗∗ = p ≤ 0.01, ∗∗∗ = p ≤ 0.001.
Figure 3
Figure 3
Quantification of OHC loss and SGC loss after ouabain treatment. Data are normalized and expressed as percentages of an averaged dataset from the left (untreated) cochleas (normal). (a) OHC loss accrues with increasing ouabain concentrations (1 mM: 72.6 ± 11.0% of OHCs remaining; 10 mM: 38.1 ± 4.8% of OHCs remaining). IHCs are not affected. Control (0 mM) includes right ears treated with PBS alone. Normal (100%) is 21 OHCs, the sum of OHCs counted at B1, B2, M1, M2, A1, A2, and A3. (b) SGC loss also progresses with increased ouabain concentrations. Compared to SGC packing densities in the left (nontreated) cochleas, near-normal numbers (95.3 ± 2.8%) of the SGC perikarya are present in cochleas treated with 0.01 mM and 0.1 mM ouabain. Control (0 mM) includes right ears treated with PBS alone. Normal (100%) is 1362 SGCs/mm2, the average SGC packing density determined in B1, B2, M1, M2, and A1. Cochleas treated with 1 mM ouabain show a moderate loss with an average of 87.4 ± 8.7% of SGC perikarya remaining, whereas in cochleas treated with 10 mM ouabain the average number of SGC perikarya present in Rosenthal's canal decreases to 64.6 ± 17.2%. Error bars represent SD; ∗∗ = p ≤ 0.01, ∗∗∗ = p ≤ 0.001. (c) OHC counts in the basal, middle, and apical turns at 1 mM and 10 mM ouabain and the average OHC count (cf. Figure 3(a)). For basal and middle turns, normal (100%) is 6 OHCs per turn, i.e., the sum of OHCs counted at B1+B2 and M1+M2, respectively, and for the apical turn normal (100%) is 9 OHCs, the sum of OHCs counted at A1+A2+A3. At a concentration of 1 mM, ouabain causes OHC loss in the basal (50.0 ± 18.9%) and middle (35.4 ± 15.6%) turns. In the apical turn, OHC counts are almost normal (93.1 ± 7.0%). A concentration of 10 mM ouabain results in loss of OHCs in all turns. In the basal turn 91.7 ± 8.4% and in the middle turn 83.3% of the OHCs are lost. In the apical turn, approximately 27.8 ± 5.5% of the OHCs is lost. (d) SGC packing densities in the basal, middle, and apical turns at 1 mM and 10 mM ouabain and the average SGC packing density (cf. Figure 3(b)). Normal (100%) is 1293 SGCs for the basal turns, 1470 SGCs for the middle turns, and 1325 SGCs for the apical turn. In the basal turn, SGC packing densities are reduced to 66.9 ± 12.6%, while they are near-normal in the middle (96.2 ± 9.2%) and apical (111.0 ± 6.5%) turns. At a concentration of 10 mM ouabain, SGC packing densities are reduced to 40.5 ± 17.0% in the basal turn and 73.1 ± 20.1% in the middle turn. The packing density in the apical turn is normal (95.8 ± 8.1%).
Figure 4
Figure 4
Examples of the variety in histological changes in the cochlea after round window membrane application of ouabain in guinea pigs. Cochleas in Category 1 do not demonstrate any effect of ouabain upon the OHCs (arrows), IHCs (arrow heads), SGCs, or the stria vascularis. These cochleas do not appear different from the left (nontreated) cochleas or from the right cochleas treated with lower ouabain concentrations (0.1 mM and 0.01 mM) or PBS alone. Category 2 contains cochleas with complete OHC loss, with apparent loss of peripheral processes in the osseous spiral lamina (), but without obvious loss of SGCs, in the basal and middle turns, while cochleas in Category 3 show complete OHC loss in all turns together with loss of peripheral processes in the osseous spiral lamina, which seem to be substituted with fibroblasts (∗∗), and extensive loss of SGCs in the basal and middle turns. In none of the animals, any loss of IHCs or histological changes in the stria vascularis are obvious. Scale bars: 50 μm (organ of Corti) and 100 μm (spiral ganglion and stria vascularis).
Figure 5
Figure 5
Reevaluation of results using post hoc histological categorization. (a) Category 1 consists of cochleas without any OHC loss. In Category 2, average OHC loss is moderate and in Category 3 the average number of remaining OHC has even decreased more. Normal (100%) is 21 OHCs, the sum of OHCs counted at B1, B2, M1, M2, A1, A2, and A3. (b) Average SGC packing density in Category 1 cochleas is near-normal. There is on average minor loss of SGCs (i.e., <20%) in Category 2, whereas the average SGC packing density in Category 3 cochleas is approximately half of that in normal-hearing controls, i.e., the left (nontreated) cochleas. Normal (100%) is 1362 SGCs/mm2, the average SGC packing density determined in B1, B2, M1, M2, and A1. (c) The wave II threshold of Category 1 remains normal, while animals in Categories 2 and 3 showed a substantial shift in wave II threshold, 4 days after treatment with ouabain. The wave II threshold shifts do not differ between Categories 2 and 3. (d) Animals in Category 1 show a slight decrease in their wave II amplitude, whereas animals in both Categories 2 and 3 show a much larger decrease, 4 days after ouabain treatment. The wave II amplitudes in Categories 2 and 3 do not significantly differ from one another. OHC counts (a) and SGC packing densities (b) are normalized and expressed as percentages of an averaged dataset from the left (untreated) cochleas (normal). Thresholds (c) and amplitudes (d) are normalized and expressed as change (in dB) from pretreatment levels. Error bars represent SEM.
Figure 6
Figure 6
Scatter plots of aABR data and OHC loss and SGC packing densities. OHC counts and SGC packing densities are normalized and expressed as percentages of an averaged dataset from the left (untreated) cochleas. Thresholds and amplitudes are normalized and expressed as change (in dB) from pretreatment levels. (a) The variance in wave II threshold shift after ouabain treatment can be explained for 44% by OHC loss (p < 0.001). (b) The decrease in wave II amplitude is positively correlated with OHC loss. The explained variance (R2) is 45% (p < 0.001). (c) The aABR wave II threshold shift and SGC loss are moderately correlated (p < 0.001). (d) There is also a moderate positive correlation between wave II amplitude decrease and SGC packing densities (p < 0.001). Colors indicate treatment group: open symbols are left (nontreated) cochleas; right ears are shown in closed symbols colored yellow (0.01 mM ouabain), green (0.1 mM), blue (1 mM), and red (10 mM). Post hoc categorization is visualized using circles (Category 1), triangles (Category 2), and squares (Category 3).

References

    1. Gantz B. J., Woodworth G. G., Knutson J. F., Abbas P. J., Tyler R. S. Multivariate predictors of audiological success with multichannel cochlear implants. Annals of Otology, Rhinology & Laryngology. 1993;102(12):909–916. doi: 10.1177/000348949310201201. - DOI - PubMed
    1. Briaire J. J., Frijns J. H. M. The consequences of neural degeneration regarding optimal cochlear implant position in scala tympani: A model approach. Hearing Research. 2006;214(1-2):17–27. doi: 10.1016/j.heares.2006.01.015. - DOI - PubMed
    1. Ulfendahl M., Hu Z., Olivius P., Duan M., Wei D. A cell therapy approach to substitute neural elements in the inner ear. Physiology & Behavior. 2007;92(1-2):75–79. doi: 10.1016/j.physbeh.2007.05.054. - DOI - PubMed
    1. Sekiya T., Kojima K., Matsumoto M., Ito J. Replacement of diseased auditory neurons by cell transplantation. Frontiers in Bioscience. 2008;13(6):2165–2176. doi: 10.2741/2832. - DOI - PubMed
    1. Coleman B., Hardman J., Coco A., et al. Fate of embryonic stem cells transplanted into the deafened mammalian cochlea. Cell Transplantation. 2006;15(5):369–380. doi: 10.3727/000000006783981819. - DOI - PMC - PubMed

LinkOut - more resources