. 2018:1865:195-215.
doi: 10.1007/978-1-4939-8784-9_14.

Quantitative Proteomics for Xenopus Embryos II, Data Analysis

Affiliations

Quantitative Proteomics for Xenopus Embryos II, Data Analysis

Matthew Sonnett et al. Methods Mol Biol. 2018.

Abstract

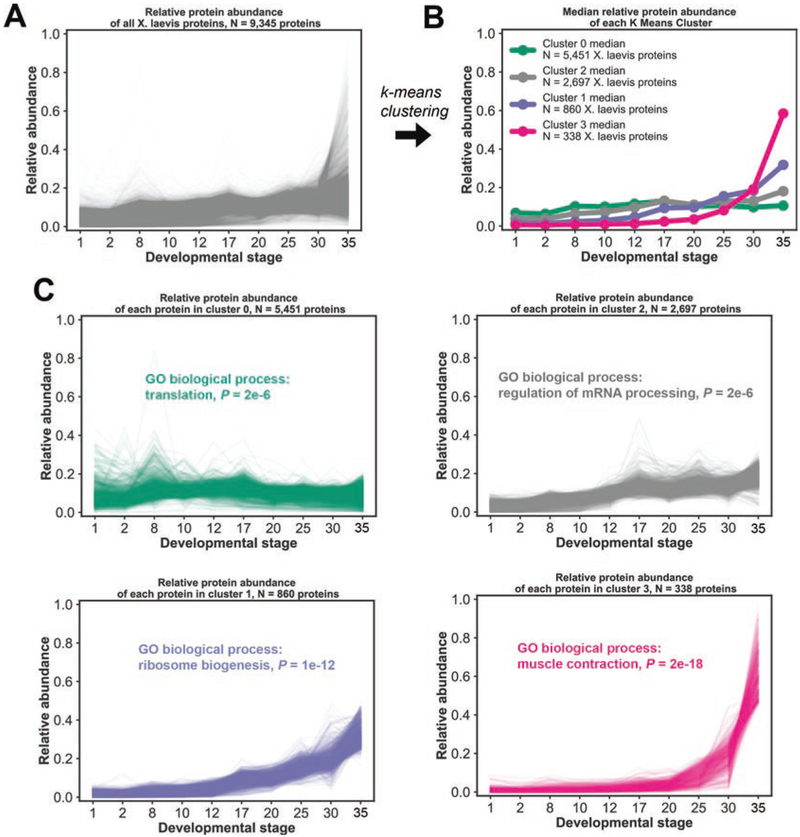
The oocytes, embryos, and cell-free lysates of the frog Xenopus laevis have emerged as powerful models for quantitative proteomic experiments. In the accompanying paper (Chapter 13) we describe how to prepare samples and acquire multiplexed proteomics spectra from those. As an illustrative example we use a 10-stage developmental time series from the egg to stage 35 (just before hatching). Here, we outline how to convert the ~700,000 acquired mass spectra from this time series into protein expression dynamics for ~9000 proteins. We first outline a preliminary quality-control analysis to discover any errors that occurred during sample preparation. We discuss how peptide and protein identification error rates are controlled, and how peptide and protein species are quantified. Our analysis relies on the freely available MaxQuant proteomics pipeline. Finally, we demonstrate how to start interpreting this large dataset by clustering and gene-set enrichment analysis.

Keywords: Development; False discovery rate; Gene symbols; Gene-set enrichment; Mass spectrum; MaxQuant; Quantitative multiplexed proteomics; TMT; Xenopus laevis; k-means clustering.


Figures

Fig. 1
Fig. 1
Overview of quantitative multiplexed proteomics data analysis pipeline. (A) A preliminary quality control sample is made and analyzed on a mass spectrometer with a TMT-MS3 method. Peptide sequences are identified through a database search and matched to protein sequences. The protease digestion efficiency, tandem mass tagging efficiency, and cysteine alkylation efficiency are all estimated to determine if the sample preparation was satisfactory. (B) Full developmental time course X. laevis TMT-MS3 experiment. Samples at ten different stages in development were collected and processed as in Gupta et al. Analysis of these samples leads to the quantification of 9345 X. laevis proteins across ten stages in development. Illustrations of developmental stages courtesy of Garland Science [[21]]
Fig. 2
Fig. 2
Mapping X. laevis protein sequences to human gene symbols. (A) X. laevis protein sequences are mapped to human gene symbols by using a bi-directional blast approach [3]. (B) Of the 79,215 X. laevis sequences present in our database, 59,596 of these have enough homology with the human sequences to map to the human gene symbol. These 59,596 mapped sequences collapse to a total of 15,673 unique human gene symbols. Part of this redundancy is from protein isoforms (X. laevis is pseudotetraploid) and part of it may come from splice-isoforms or errors during the protein reference database construction, e.g., fragmented proteins
Fig. 3
Fig. 3
k-Means clustering and gene ontology biological enrichment of developmental time series. (a) Time series profiles throughout developmental stages for all 9345 X. laevis proteins that were quantified. (b) Median relative abundances and their membership number using a k-means clustering approach based on Euclidean distance with the number of clusters set to 4. (c) Relative abundances of proteins in individual clusters and the top gene ontology (GO) biological enrichment term associated with each cluster

References

    1. Gurdon JB, & Wakefield L (1986). Microinjection of amphibian oocytes and eggs for the analysis of transcription. Microinjection and Organelle Transplantation Techniques, 269–299.
    1. Eng JK, McCormack AL, Yates JR (1994) An approach to correlate tandem mass spectral data of peptides with amino acid sequences in a protein database. J Am Soc Mass Spectrom 5(11):976–989. 10.1016/1044-0305(94)80016-2 - DOI - PubMed
    1. Wühr M, Freeman RM Jr, Presler M, Horb ME, Peshkin L, Gygi S, Kirschner MW (2014) Deep proteomics of the Xenopus laevis egg using an mRNA-derived reference database. Curr Biol 24(13):1467–1475. 10.1016/j.cub.2014.05.044 - DOI - PMC - PubMed
    1. Savitski MM, Wilhelm M, Hahne H, Kuster B, Bantscheff M (2015) A scalable approach for protein false discovery rate estimation in large proteomic data sets. Mol Cell Proteomics 14(9):2394–2404. 10.1074/mcp.M114.046995 - DOI - PMC - PubMed
    1. Cox J, Hein MY, Luber CA, Paron I, Nagaraj N, Mann M (2014) Accurate proteome-wide label-free quantification by delayed normalization and maximal peptide ratio extraction, termed MaxLFQ. Mol Cell Proteomics 13(9):2513–2526. 10.1074/mcp.M113.031591 - DOI - PMC - PubMed

Publication types