

Integrated analysis of long noncoding RNA associated-competing endogenous RNA as prognostic biomarkers in clear cell renal carcinoma
- PMID: 30152187
- PMCID: PMC6172067
- DOI: 10.1111/cas.13778
Integrated analysis of long noncoding RNA associated-competing endogenous RNA as prognostic biomarkers in clear cell renal carcinoma
Abstract
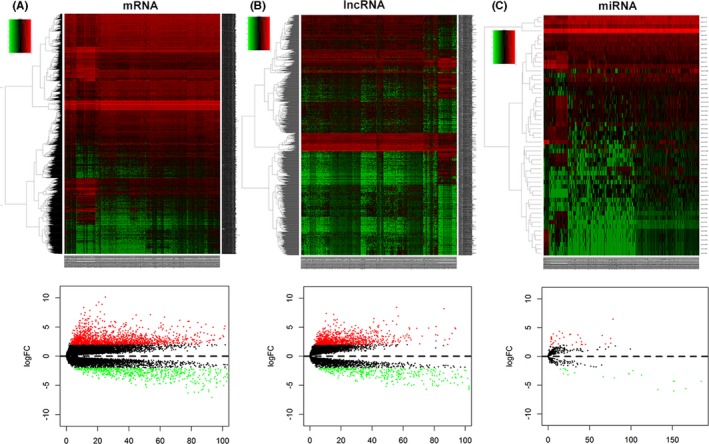
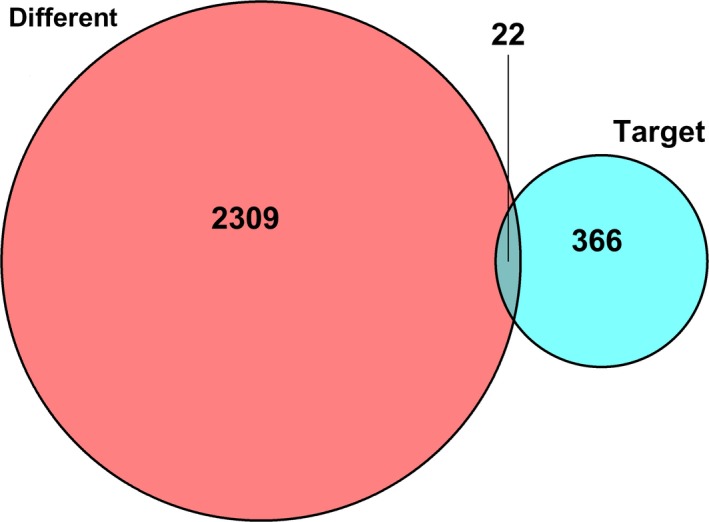
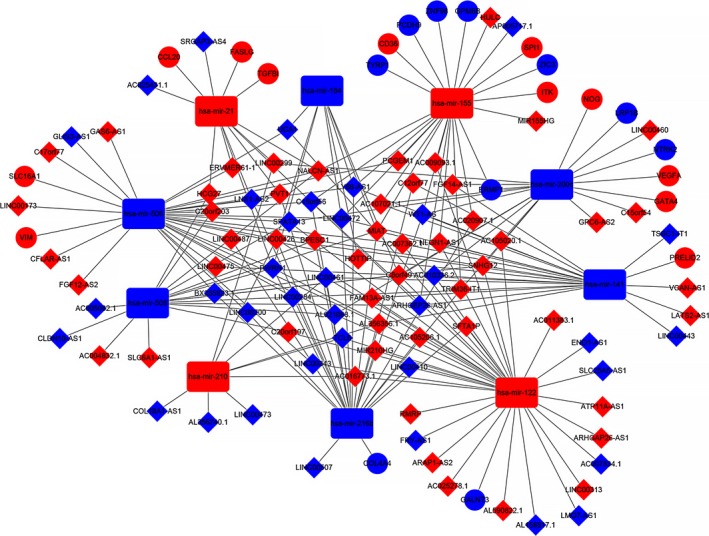
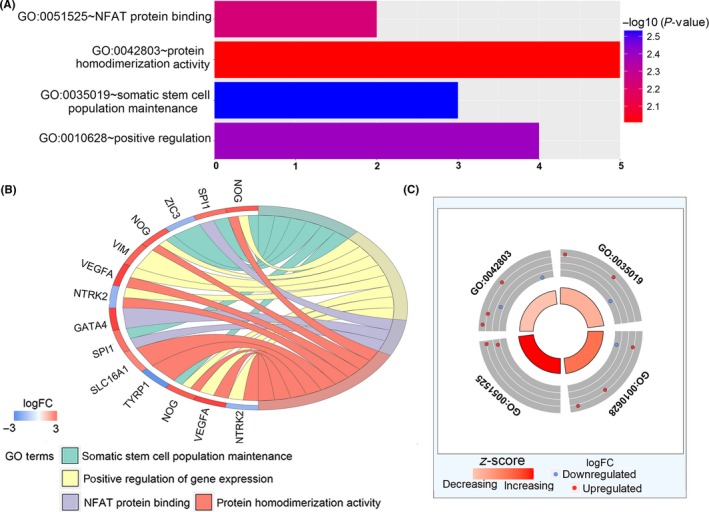
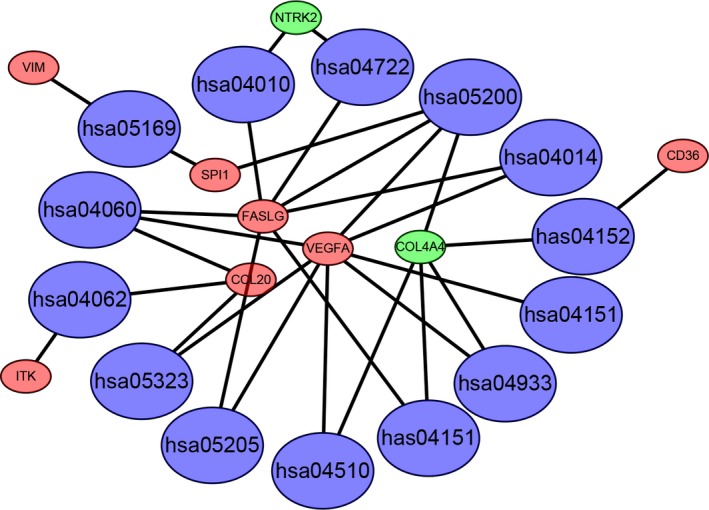
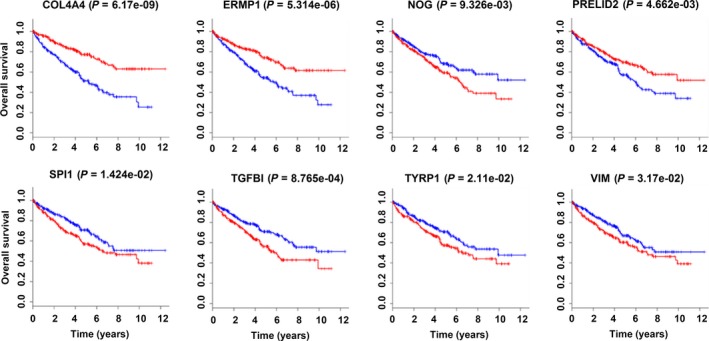
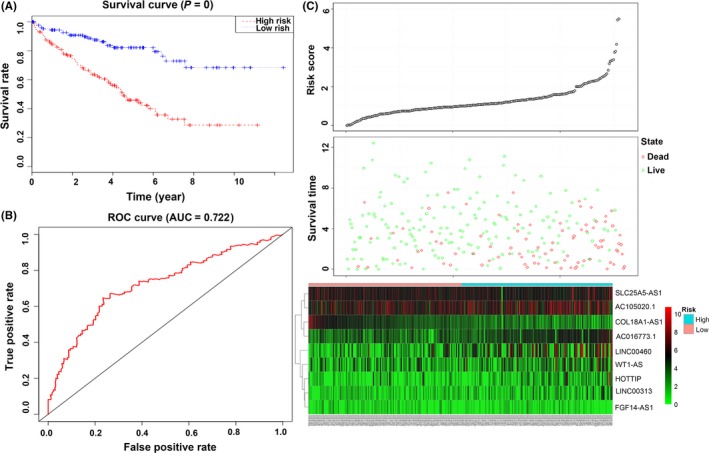
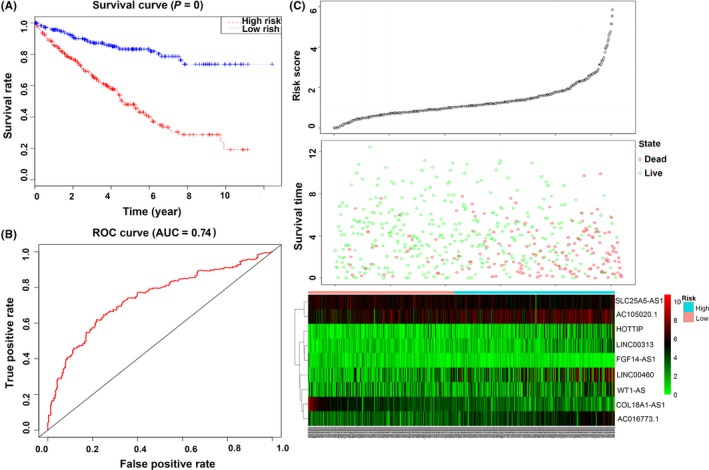
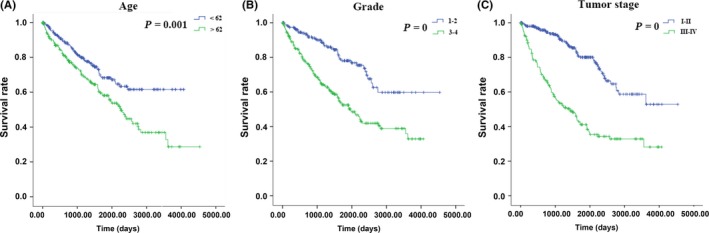
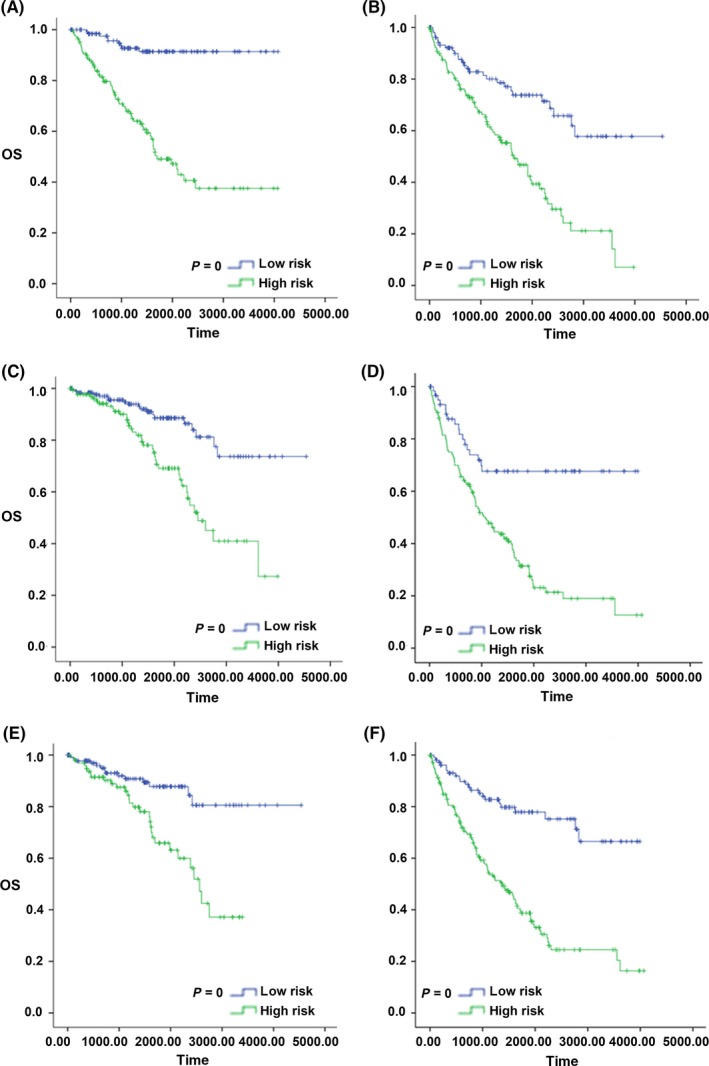
Clear cell renal cell carcinoma (ccRCC) is one of the most common malignant carcinomas and its molecular mechanisms remain unclear. Long noncoding RNA (lncRNA) could bind sites of miRNA which affect the expression of mRNA according to the competing endogenous (ceRNA) theory. The aim of the present study was to construct a ceRNA network and to identify key lncRNA to predict survival prognosis. We identified differentially expressed mRNA, lncRNA and miRNA between tumor tissues and normal tissues from The Cancer Genome Atlas database. Then, using bioinformatics tools, we explored the connection of 89 lncRNA, 10 miRNA and 22 mRNA, and we constructed the ceRNA network. Furthermore, we analyzed the functions and pathways of 22 differentially expressed mRNA. Then, univariate and multivariate Cox regression analyses of these 89 lncRNA and overall survival were explored. Nine lncRNA were finally screened out in the training group. The patients were divided into high-risk and low-risk groups according to the 9 lncRNA and low-risk scores having better clinical overall survival (P < .01). Furthermore, the receiver operating characteristic curve demonstrates the predicted role of the 9 lncRNA. The 9-lncRNA signature was successfully proved in the testing group and the entire group. Finally, multivariate Cox regression analysis and stratification analysis further proved that the 9-lncRNA signature was an independent factor to predict survival. In summary, the present study provides a deeper understanding of the lncRNA-related ceRNA network in ccRCC and suggests that the 9-lncRNA signature could serve as an independent biomarker to predict survival in ccRCC patients.
Keywords: The Cancer Genome Atlas; biomarker; competing endogenous RNA network; long non-coding RNA; renal cell carcinoma.
© 2018 The Authors. Cancer Science published by John Wiley & Sons Australia, Ltd on behalf of Japanese Cancer Association.
Figures

 ) High expression.
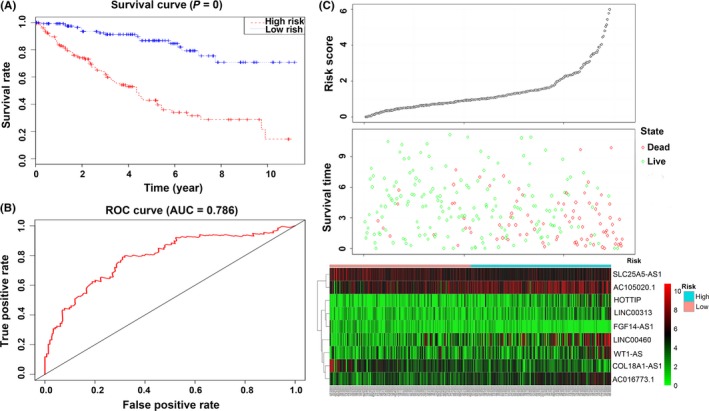
References
-
- Siegel RL, Miller KD, Jemal A. Cancer statistics, 2018. CA Cancer J Clin. 2018;68:7‐30. - PubMed
-
- Barata PC, Rini BI. Treatment of renal cell carcinoma: current status and future directions. CA Cancer J Clin. 2017;67:507‐524. - PubMed
-
- Lane BR, Kattan MW. Prognostic models and algorithms in renal cell carcinoma. Urol Clin North Am 2008;35:613‐625; vii. - PubMed
-
- Caceres W, Cruz‐Chacon A. Renal cell carcinoma: molecularly targeted therapy. P R Health Sci J. 2011;30:73‐77. - PubMed
MeSH terms
Substances
Grants and funding
LinkOut - more resources
Full Text Sources
Other Literature Sources
Medical
