. 2018 Mar 20;4(1):39.
doi: 10.3390/jof4010039.

FungiDB: An Integrated Bioinformatic Resource for Fungi and Oomycetes

Affiliations

FungiDB: An Integrated Bioinformatic Resource for Fungi and Oomycetes

Evelina Y Basenko et al. J Fungi (Basel). .

Abstract

FungiDB (fungidb.org) is a free online resource for data mining and functional genomics analysis for fungal and oomycete species. FungiDB is part of the Eukaryotic Pathogen Genomics Database Resource (EuPathDB, eupathdb.org) platform that integrates genomic, transcriptomic, proteomic, and phenotypic datasets, and other types of data for pathogenic and nonpathogenic, free-living and parasitic organisms. FungiDB is one of the largest EuPathDB databases containing nearly 100 genomes obtained from GenBank, Aspergillus Genome Database (AspGD), The Broad Institute, Joint Genome Institute (JGI), Ensembl, and other sources. FungiDB offers a user-friendly web interface with embedded bioinformatics tools that support custom in silico experiments that leverage FungiDB-integrated data. In addition, a Galaxy-based workspace enables users to generate custom pipelines for large-scale data analysis (e.g., RNA-Seq, variant calling, etc.). This review provides an introduction to the FungiDB resources and focuses on available features, tools, and queries and how they can be used to mine data across a diverse range of integrated FungiDB datasets and records.

Keywords: Galaxy; RNA-Seq; bioinformatics; fungi; genomics; omics; pathogen; proteomics; sequence analysis; transcriptomics.


Conflict of interest statement

The authors declare no conflict of interest. The founding sponsors had no role in the design of the study; in the collection, analyses, or interpretation of data; in the writing of the manuscript; or in the decision to publish the results.

Figures

Figure 1
Figure 1
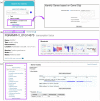
FungiDB Home page and its features. The home page comprises (a) the header section with Gene ID search highlighted in purple; (b) the main menu in grey; (c) the side bar with links and various information sections; and (d) the main component offering Search for Genes, Search for Other Data Types, and Tools sections. Find a search box from Search for Genes component is highlighted in purple.
Figure 2
Figure 2
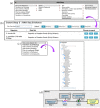
Simple searches and gene record pages. (a) A Gene ID search can be initiated from the main component section, Search for Genes option, Annotation, curation and identifiers submenu (highlighted in purple); (b) Gene record page can be saved or bookmarked via Add to basket or Add to favorites links, respectively (highlighted in purple). Thumbnail Shortcuts (highlighted) provides easy navigation to key datasets; (c) Additional gene record sections can be quickly identified via the searchable Contents menu on the left (highlighted in purple).
Figure 3
Figure 3
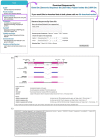
Simple searches and gene record pages, continued. Orthology and Synteny section (highlighted in purple) for the F. graminearum gene FGRAMPH1_01G14573. (http://fungidb.org/gene/FGRAMPH1_01G14573) (a) A Multiple Sequence Alignment (MSA) run within the gene record page against Magnaporthe and Sordaria sequences. Shown as CLUSTAL Omega output; (b) Syntenic orthologs can be previewed from the GBrowse window within the gene page. A separate session in GBrowse page can be deployed by clicking on the View in genome browser button. Syntenic regions for the gene are highlighted in purple.
Figure 4
Figure 4
Simple searches and gene record pages, continued. (a) Transcriptomics menu (highlighted in purple) contains Transcript Expression records that show fpkm graphs for A. nidulans gene AN8182 (gene record page: http://fungidb.org/fungidb/app/record/gene/AN8182). Coverage plots (an inset to the Transcript Expression section) displays unique read alignments and a View in genome browser link out; (b) Proteomics menu (highlighted in purple) displays Mass Spec. Evidence for A. fumigatus gene Afu6g06770 (gene record page: http://fungidb.org/fungidb/app/record/gene/Afu6g06770). Proteomics tracks can be also visualized by clicking on the View in protein browser button.
Figure 5
Figure 5
Quantitative Mass Spec. search examining up-regulated genes in A. fumigatus Af293 during conidial growth. (a) Select the Quantitative Mass Spec. Evidence menu (highlighted in purple) to access Suh et al. dataset and select Reference and Comparison Samples as shown to identify genes that are up-regulated throughout conidial development. The selection parameter areas are highlighted in purple; (b) Overview of the search strategy. Explore results, Add Columns, or Download results (highlighted in purple). Strategy in FungiDB: http://fungidb.org/fungidb/im.do?s=96851d3ef002899a.
Figure 6
Figure 6
Quantitative Mass Spec. query examining up-regulated genes in A. fumigatus Af293 during conidial growth with at least 2 and no more than 5 exons. Exon Count search is deployed from the Search for Genes category, Gene models menu, Exon Count subcategory. Strategy in FungiDB: http://fungidb.org/fungidb/im.do?s=96851d3ef002899a.
Figure 7
Figure 7
RNA-Seq query using C. neoformans single-read and paired-end datasets by Chen et al. [24] (a) RNA-Seq query on single-read data is initiated from the Search for Genes panel, Transcriptomics menu. Step 1 selects for two-fold up-regulated genes in G0 in vivo CSF compared with in the G0 YPD reference sample; (b) Step 2 selects for HC1 genes expressed in vivo CSF (using HC1 YPD sample as reference). Choose the 2 minus 1 intersect parameter to set up conditions for the final search; (c) Add Step and repeat steps as before but this time select the paired-end dataset. Step 3 identifies HC1 genes up-regulated in vivo CSF compared to ex vivo CSF. Choose the 1 minus 2 intersect parameter for the third step; (d) Results table for Step 3. Clicking on the Analyze Results tab (highlighted in purple) will redirect users to enrichment analysis using Gene Ontology, Metabolic Pathway, and Word Enrichment tools. Strategy in FungiDB http://fungidb.org/fungidb/im.do?s=892406814924ecdd.
Figure 8
Figure 8
Gene enrichment analysis tools. (a) Clicking on the GOGene Ontology Enrichment button deploys GO enrichment that can be limited based on the following parameters: ontology aspects, GO evidence (Computed vs. Curated), and p-value (0.05 default), or GO Slim terms; (b) The enrichment results can be further visualized via Reduce + Visualize Gene Ontology (REViGO), Word Cloud image, or downloaded (highlighted in purple).
Figure 9
Figure 9
Metabolic pathway enrichment analysis. (a) A list of 31 genes is analyzed via the Gene IDs tool (from the Search for Genes panel) and the (b) the Metabolic Pathway Enrichment tool from the Analyze Results tab (highlighted in purple) (c) Metabolic Pathway Enrichment analysis results page. Individual Pathway ID (e.g., ec00620) is linked to the interactive CytoScape interface. Strategy in FungiDB: http://fungidb.org/fungidb/im.do?s=6825e606be957ead.
Figure 10
Figure 10
Interactive pathway map for KEGG ec00620 (Pyruvate metabolism). (a) Enzyme nodes that are represented by a gene in the database are outlined in red. Clicking on enzyme or compound nodes reveals more information about corresponding entities (b) Pyruvate metabolism pathway with RNA-Seq fpkm values painted above individual pathway nodes (A. nidulans transcriptomics data) via the Paint Enzyme menu (highlighted in purple).
Figure 11
Figure 11
Search for SNPs via the Differences Between Two Groups of Isolates option. SNP search is initiated from the Search for Other Data Types panel on the home page (highlighted in purple). The SNPs results table shown is sorted by Coding column.
Figure 12
Figure 12
Search for SNPs via the Differences Between Two Groups of Isolates option, continued. (a) SNP record for SNP.GL636486.1125536 corresponding to the CPSG_00368 gene. DNA polymorphism and SNP categorization based on Strains/Samples are shown; (b) Explore SNPs in FungiDB GBrowse. SNPs are color coded based on their effect on gene function (e.g., nonsense SNPs are shown as red diamonds-highlighted in purple). Click on the View in genome browser button to be re-directed to GBrowse. Individual reads can be activated from the Select Tracks tab (highlighted in purple). Hover over a SNP to activate a pop-up box with additional information (highlighted in purple). Strategy in FungiDB: http://fungidb.org/fungidb/im.do?s=564aa900d161cbbb.
Figure 13
Figure 13
Using Genomic Location search to discover impact of Transposable Elements (TEs) on gene expression. (a) Identify TEs based on coordinates formatted to the accepted convention (e.g., sequence_id:start-end:strand). Paste a list of genomic coordinates in the highlighted section—Step 1 (b) Add Step and Run a new Search using a Taxonomy tool and identify C. immitis genes that are (c) 1000bp downstream of the previously identified TE elements—Step 2. Strategy in FungiDB: http://fungidb.org/fungidb/im.do?s=67dcb3bb26a92111.
Figure 14
Figure 14
Using Genomic Location search to discover impact of Transposable Elements (TEs) on gene expression, continued. (a,b) Add Step to mine transcriptomics data for C. immitis—Step 3 (c) Step 4: Add step to deploy the Transform by Orthology tool. (d) Overview of the search strategy. The shape of the search box highlighted in yellow is different to reflect changes in fungal species/genera. Strategy in FungiDB: http://fungidb.org/fungidb/im.do?s=67dcb3bb26a92111.
Figure 15
Figure 15
Identifying genes via the Motif Pattern tool. Shown is a search for the effector protein motif in P. gramminis using a regular expression (Step 1). Strategy in FungiDB: http://fungidb.org/fungidb/im.do?s=4e9454cd679286de.
Figure 16
Figure 16
Identifying genes via the Motif Pattern tool, continued. (a) Predicted Signal Peptides search deployed via the Add Step function (Step 2) (b) Overview of the search strategy. Search results from Step 2 are intersected with 148 genes reported by Godfrey et al. (Step 3) Strategy in FungiDB: http://fungidb.org/fungidb/im.do?s=4e9454cd679286de.
Figure 17
Figure 17
Running a preconfigured workflow for paired-end RNA-Seq data with biological replicates. (a) Upload files from EBI server (highlighted in purple); (b) Initiate a sample workflow by clicking on the corresponding workflow link (highlighted); (c) Choose preloaded paired datasets from the Input dataset drop down menu (highlighted). Some tools (e.g., Tophat2) require specification of the reference genome (highlighted) which will be used to map reads. Use search box to find and select the reference genome. Click on Run workflow to initiate the analysis.
Figure 18
Figure 18
Importing BigWig files into the FungiDB GBrowse from the EuPathDB Galaxy instance. The data is scaled to local min/max. Shown are tracks from symptomatic and asymptomatic samples (both replicates), followed by Annotated Transcripts and FungiDB pre-configured RNASeq evidence tracks.
Figure 19
Figure 19
Viewing BigWig files in the FungiDB GBrowse. Shown are synteny tracks for selected Sordariomycetes (highlighted in purple). Tracks can be activated from the Orthology and synteny section, which is located under the Select Tracks tab.
Figure 20
Figure 20
Sequence Retrieval Tool. (a) The tool can be initiated from the Tools component of the main page (highlighted in purple). Retrieving Sequences by Gene IDs is shown for gene FOXG_16418. Additional retrieval features are available: Retrieve Sequences By Genomic Sequence IDs, Retrieve Sequences By EST IDs, Retrieve Sequences By Popset Isolate IDs, Retrieve Sequences By Open Reading Frame IDs; (b) Help menu at the bottom of the page offers guidance in identification and selection of transcriptional and translation start and stop sites; (c) Browser view of the results showing FASTA sequence for the genomic sequence for gene FOXG_16418.
Figure 21
Figure 21
Improving gene records via user comments. (a) Shown is a gene record page for a putative microtubule-binding protein HookA AN5126 gene in A. nidulans. To add a comment, click on the add a comment link, which is located at the top of the gene record page (highlighted in purple); (b) User comment forms can be supplemented with scientific or experimental information (see comment examples in Table 2); files can be uploaded as well.

Similar articles

Cited by

References

    1. Stajich J.E., Harris T., Brunk B.P., Brestelli J., Fischer S., Harb O.S., Kissinger J.C., Li W., Nayak V., Pinney D.F., et al. FungiDB: An integrated functional genomics database for fungi. Nucleic Acids Res. 2012;40 doi: 10.1093/nar/gkr918. - DOI - PMC - PubMed
    1. Aurrecoechea C., Barreto A., Basenko E.Y., Brestelli J., Brunk B.P., Cade S., Crouch K., Doherty R., Falke D., Fischer S., et al. EuPathDB: The eukaryotic pathogen genomics database resource. Nucleic Acids Res. 2017;45:D581–D591. doi: 10.1093/nar/gkw1105. - DOI - PMC - PubMed
    1. Clark K., Karsch-Mizrachi I., Lipman D.J., Ostell J., Sayers E.W. GenBank. Nucleic Acids Res. 2016;44:D67–D72. doi: 10.1093/nar/gkv1276. - DOI - PMC - PubMed
    1. Yates A., Akanni W., Amode M.R., Barrell D., Billis K., Carvalho-Silva D., Cummins C., Clapham P., Fitzgerald S., Gil L., et al. Ensembl 2016. Nucleic Acids Res. 2016;44:D710–D716. doi: 10.1093/nar/gkv1157. - DOI - PMC - PubMed
    1. Nordberg H., Cantor M., Dusheyko S., Hua S., Poliakov A., Shabalov I., Smirnova T., Grigoriev I.V., Dubchak I. The genome portal of the Department of Energy Joint Genome Institute: 2014 updates. Nucleic Acids Res. 2014;42 doi: 10.1093/nar/gkt1069. - DOI - PMC - PubMed

LinkOut - more resources