. 2018 Nov 1;128(11):4843-4855.
doi: 10.1172/JCI95945. Epub 2018 Oct 2.

The two-pore domain potassium channel TREK-1 mediates cardiac fibrosis and diastolic dysfunction

Affiliations

The two-pore domain potassium channel TREK-1 mediates cardiac fibrosis and diastolic dysfunction

Dennis M Abraham et al. J Clin Invest. .

Abstract

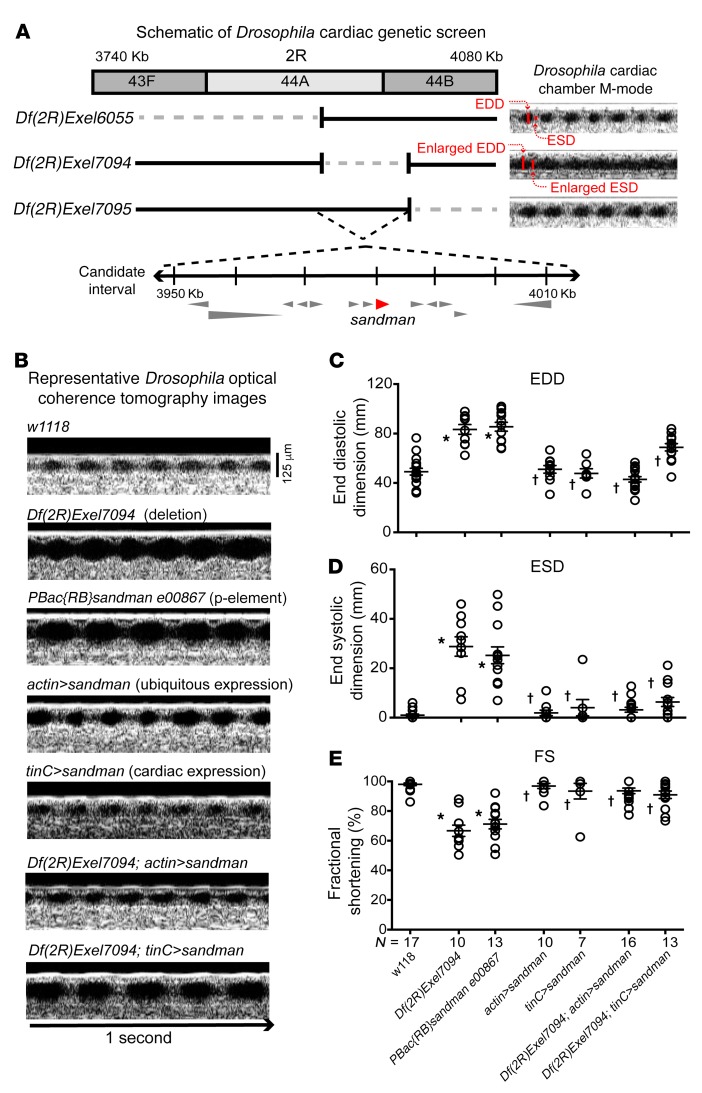
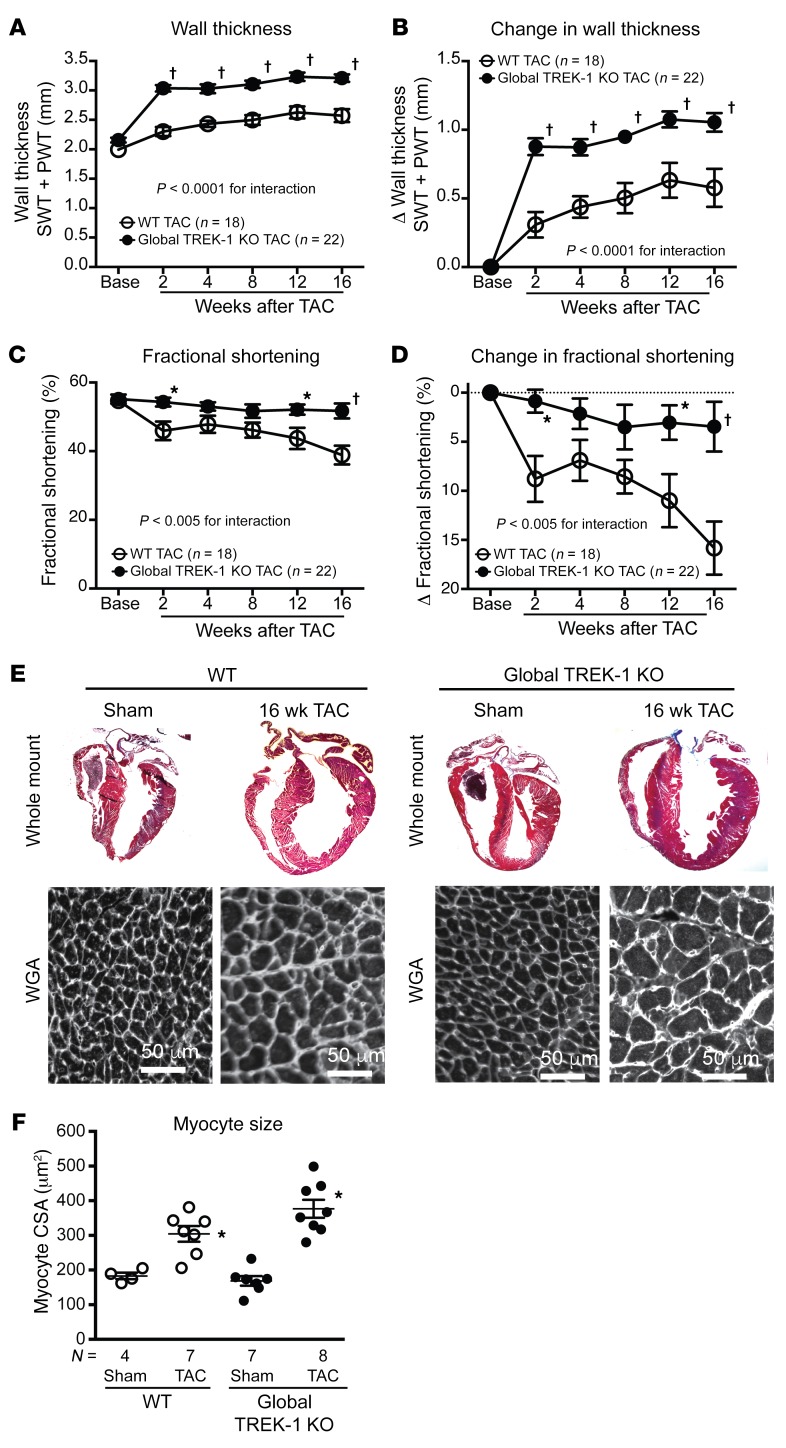
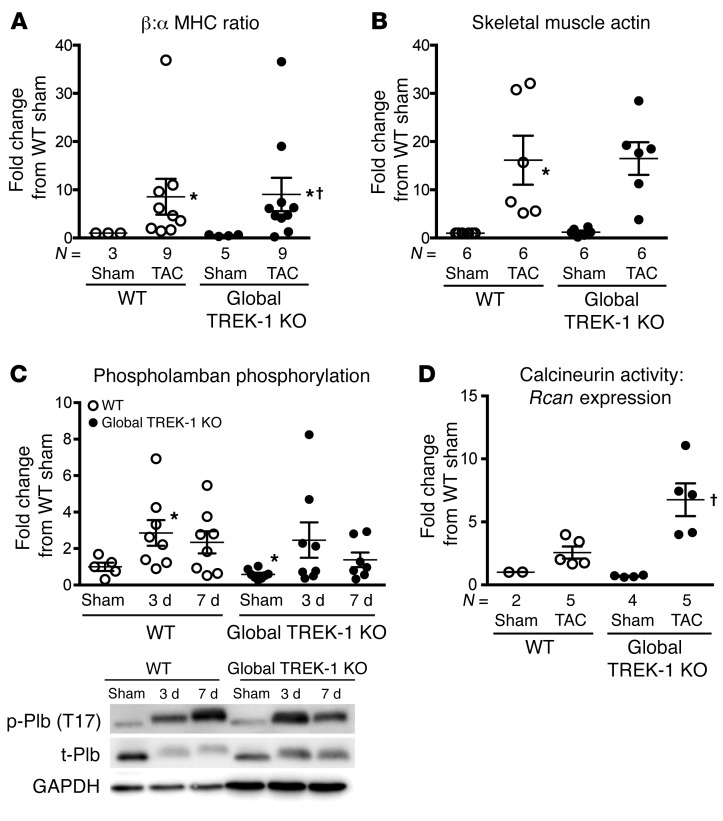
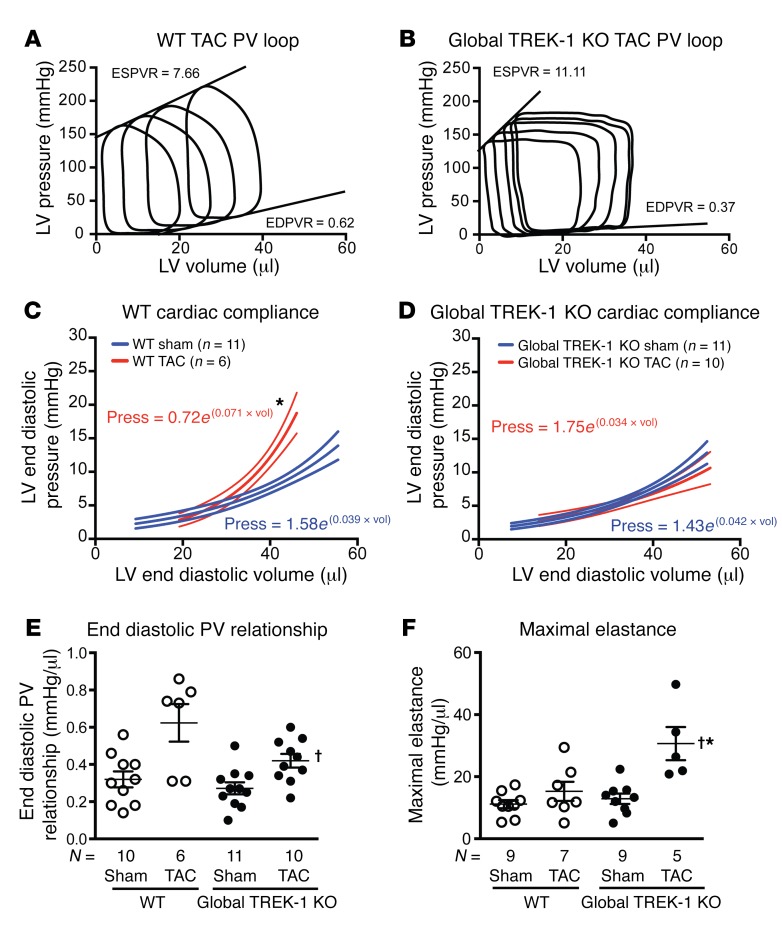
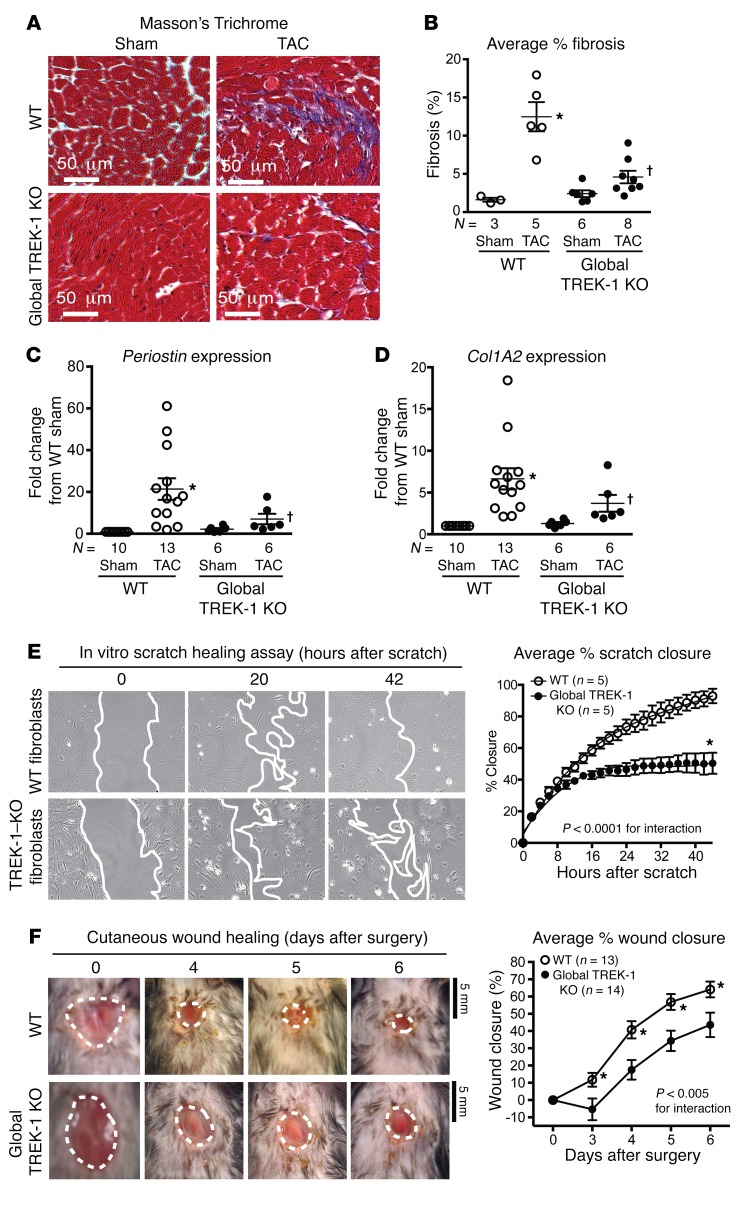
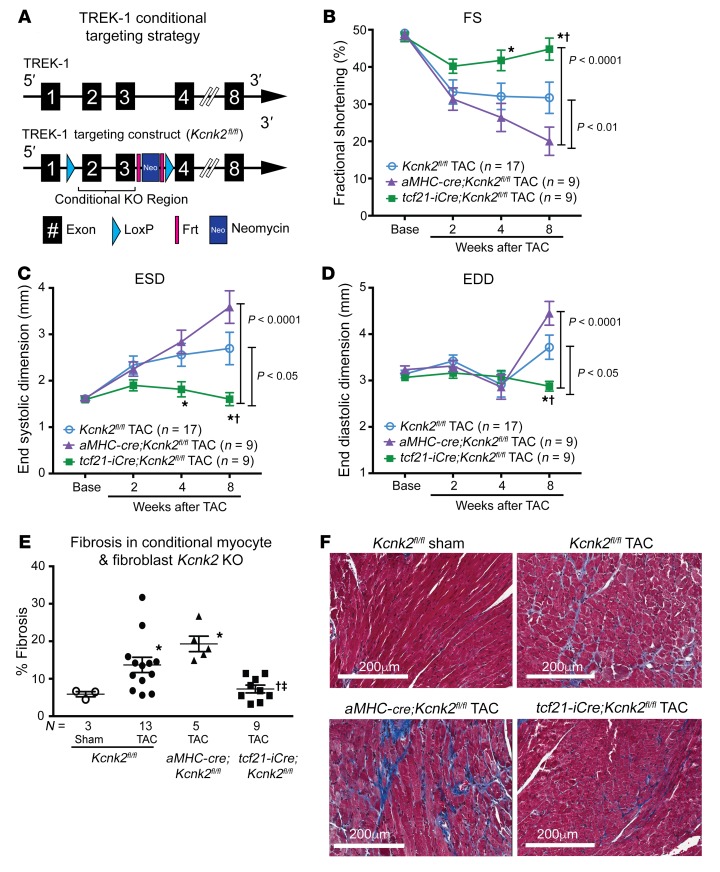
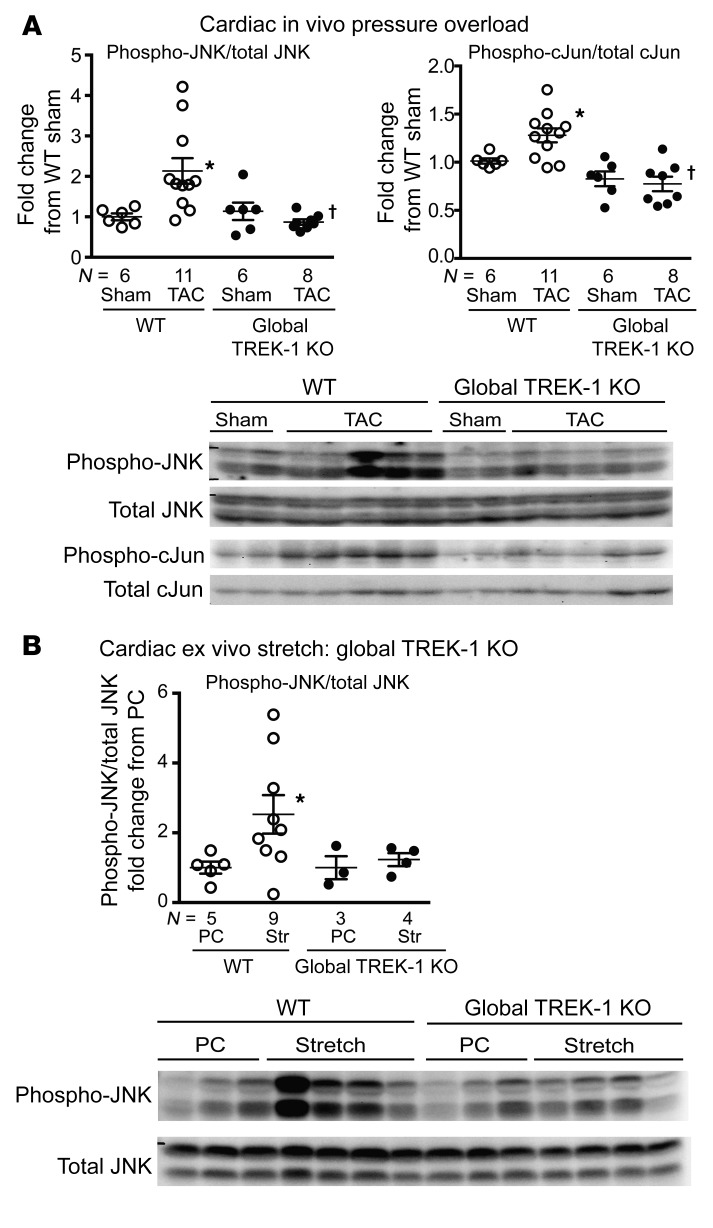
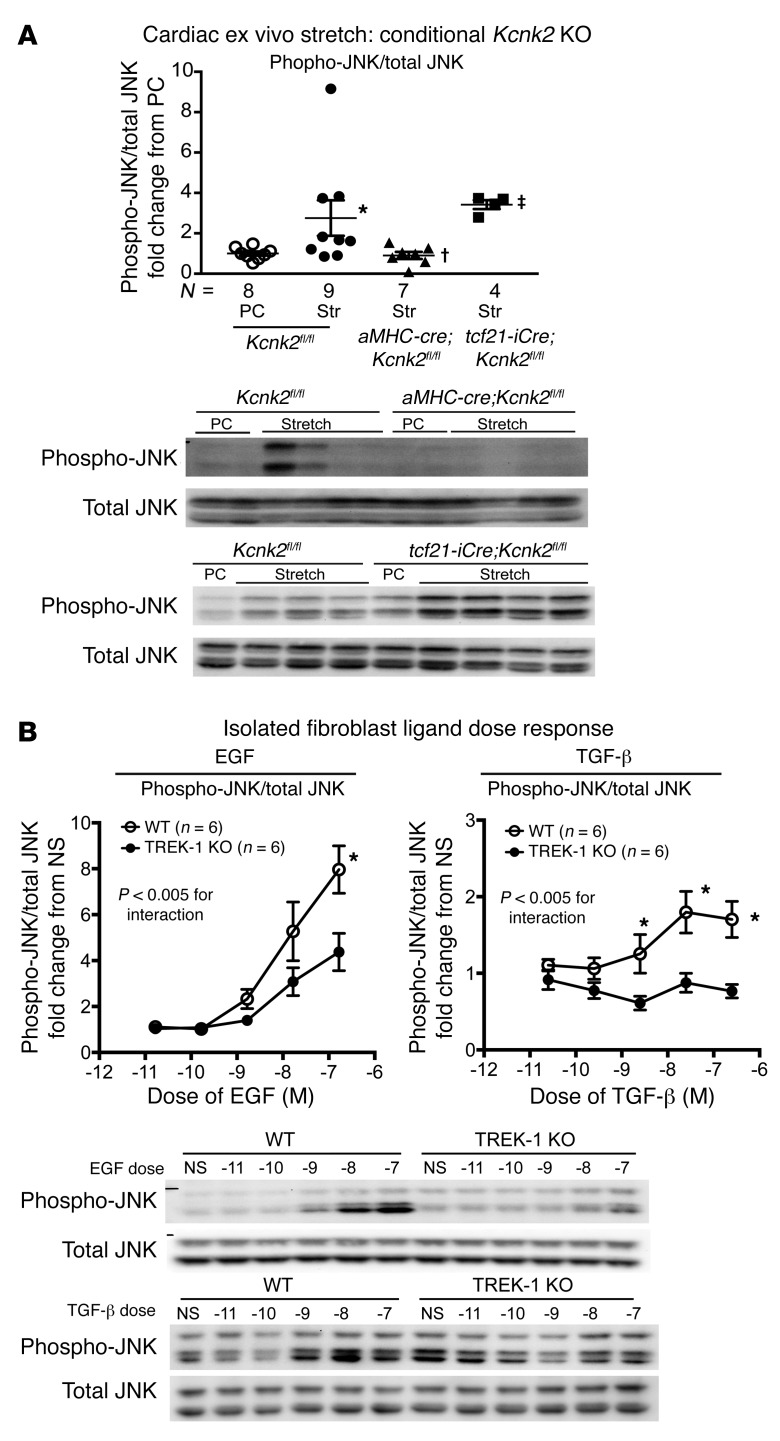
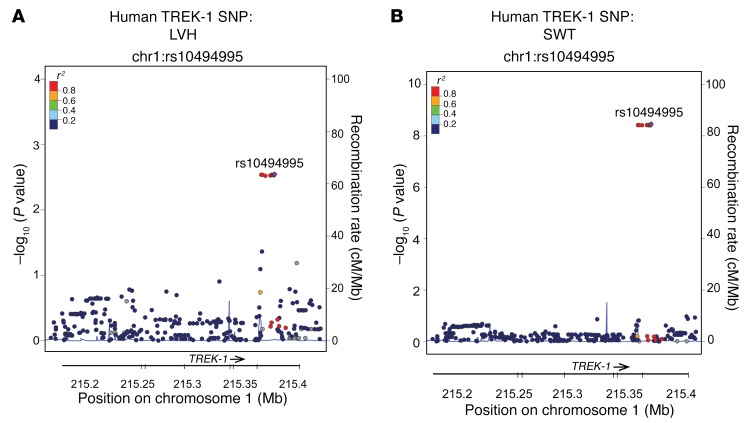
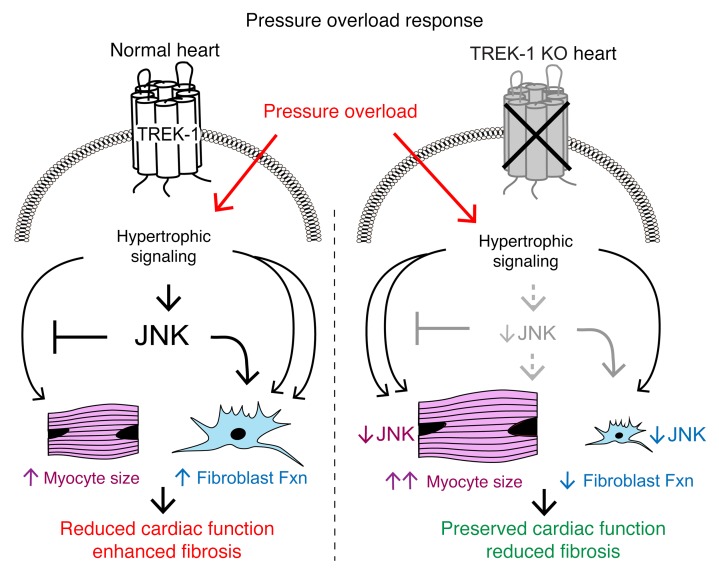
Cardiac two-pore domain potassium channels (K2P) exist in organisms from Drosophila to humans; however, their role in cardiac function is not known. We identified a K2P gene, CG8713 (sandman), in a Drosophila genetic screen and show that sandman is critical to cardiac function. Mice lacking an ortholog of sandman, TWIK-related potassium channel (TREK-1, also known Kcnk2), exhibit exaggerated pressure overload-induced concentric hypertrophy and alterations in fetal gene expression, yet retain preserved systolic and diastolic cardiac function. While cardiomyocyte-specific deletion of TREK-1 in response to in vivo pressure overload resulted in cardiac dysfunction, TREK-1 deletion in fibroblasts prevented deterioration in cardiac function. The absence of pressure overload-induced dysfunction in TREK-1-KO mice was associated with diminished cardiac fibrosis and reduced activation of JNK in cardiomyocytes and fibroblasts. These findings indicate a central role for cardiac fibroblast TREK-1 in the pathogenesis of pressure overload-induced cardiac dysfunction and serve as a conceptual basis for its inhibition as a potential therapy.

Keywords: Cardiology; Cardiovascular disease; Fibrosis; Heart failure; Muscle Biology.


Conflict of interest statement

Conflict of interest: The authors have declared that no conflict of interest exists.

Figures

Figure 1
Figure 1. Sandman is critical for Drosophila cardiac function.
(A) Schematic of Drosophila genetic screen. Genetic deletion of a segment between cytologic bands 44A and 44B of chromosome 2R, Df(2R)Exel7094, resulted in enlarged cardiac dimensions and diminished cardiac function by OCT. Adjacent genomic deletions Df(2R)Exel6055 and Df(2R)Exel7095 have normal cardiac dimensions, thereby identifying a genomic segment spanning 13 genes as the candidate interval. (B) Representative 1 second OCT recordings from w1118, genomic deletion (Df[2R]Exel7094), P-element single-gene disruption of sandman (PBac{RB}sandman e00867), sandman overexpressed ubiquitously (actin>sandman), sandman overexpressed in cardiac tissue (tinC>sandman) or ubiquitously (actin>sandman), or in the context of the genomic deletion Df(2R)Exel7094 (Df(2R)Exel7094; actin>sandman and Df(2R)Exel7094; tinC>sandman). Scale bar: 125 μm. (C) Average end diastolic dimensions (EDD) and (D) average end systolic dimensions (ESD) reveal marked enlargement and resultant decrease in (E) average fractional shortening (FS) in Df(2R)Exel7094 and PBac{RB}sandman e00867 in comparison with w1118. The ubiquitous and cardiac-specific overexpression of sandman in the context of Df(2R)Exel7094 (Df(2R)Exel7094; actin>sandman and Df(2R)Exel7094; tinC>sandman, respectively) results in rescue of cardiac dimensions in comparison with Df(2R)Exel7094 and PBac{RB}sandman e00867. Statistical comparisons made using 1-way ANOVA with Bonferroni’s test for multiple comparisons. *P < 0.0001 versus w1118; P < 0.0001 versus Df(2R)Exel7094 and PBac{RB}sandman e00867.
Figure 2
Figure 2. Global TREK-1 KO develops hypertrophy and maintains function after pressure overload.
(A) Serial echocardiographic measurements of average wall thicknesses (SWT + PWT) and (B) average change in wall thickness, (C) average FS ([EDD – ESD/EDD] × 100) and (D) average change in FS in TREK-1 KO and WT at baseline and up to 16 weeks after TAC. Error bars reflect SEM. Statistical comparisons between WT TAC and TREK-1–KO TAC data were made using 2-way repeated measures ANOVA. P values for the interaction between genotype and weeks after TAC are shown. Comparisons between genotypes at each time point were made using Bonferroni’s test for multiple comparisons. P < 0.001; *P < 0.05 for WT TAC versus TREK-1–KO TAC at each time point. (E) Whole mount of hearts from WT and TREK-1–KO hearts both under sham and 16 weeks of TAC conditions. Representative wheat germ agglutinin (WGA) staining showing myocyte areas in WT and TREK-1 KO 16 weeks following sham or TAC. Scale bars: 50 μm. (F) Average myocyte cross-sectional area (CSA) in WT and TREK-1–KO cross-sectional area after 16 weeks of TAC. The average measured CSAs of 300–500 cardiomyocytes were used for each animal. Statistical comparisons were performed using 1-way ANOVA with Newman-Keuls test for multiple comparisons. *P < 0.05 versus WT sham.
Figure 3
Figure 3. Global TREK-1 KO develops hypertrophic molecular signatures after pressure overload.
(A) Average β-MHC to α-MHC ratio and (B) skeletal muscle actin gene expression in LVs after 2 weeks of TAC. For gene expression studies in panels A and B, statistical comparisons with WT sham, which has a theoretical mean of 1, were made with a 1-sample, 2-tailed t test. *P < 0.05 versus WT sham. Comparisons among all other groups excluding WT sham were made using by Kruskal-Wallis test with Dunn’s multiple comparisons test. P < 0.05 versus TREK-1 KO sham. (C) CaMKII activity, as measured by phosphorylated phospholamban at threonine 17. Densitometry quantification of the ratio of phosphorylated phospholamban to total phospholamban, normalized to WT sham condition. Full, uncut gels are shown in the supplemental material. (D) Calcineurin activity as measured by RCAN1 gene expression from cDNA obtained from WT and TREK-1–KO LVs after sham or TAC. For the phospholamban (shown in C) and calcineurin experiments (shown D), statistical comparisons with WT sham, which has a theoretical mean of 1, were made with a 1-sample, 2-tailed t test. *P < 0.05 versus WT sham. Comparisons among all other groups excluding WT sham were made using by Kruskal-Wallis test with Dunn’s multiple comparisons test. P < 0.05 versus WT TAC.
Figure 4
Figure 4. TREK-1 modulates cardiac function.
Representative pressure-volume loops obtained from (A) WT mice and (B) TREK-1 KO mice after 2 weeks of TAC. Average slopes of ESPVR and EDPVR are listed for each genotype. (C) Passive diastolic stiffness derived from the following exponential equation: (LV end diastolic pressure = curve fitting constant × e[stiffness constant × LV end diastolic volume]) in WT and (D) global TREK-1–KO mice in sham and TAC states. *P < 0.0001 versus sham condition curve. Error bars represent 95% CI. Pressure (Press) = curve fitting constant × e(stiffness constant × LV end diastolic volume [Vol]). (E) Average end diastolic PV relation and (F) average maximal elastance in sham and 2 weeks of TAC. *P < 0.05 versus WT sham using 1-sample, 2-tailed t test; P < 0.05 versus WT TAC by Kruskal-Wallis test with Dunn’s multiple comparisons test.
Figure 5
Figure 5. TREK-1 regulates both cardiac and extracardiac fibrosis.
(A) Representative Masson’s trichrome staining with fibrosis shown in purple. (B) Average percentage fibrosis after 16 weeks of TAC. *P < 0.05 versus control sham using 1-sample, 2-tailed t test. P < 0.05 versus WT TAC by Kruskal-Wallis test with Dunn’s multiple comparisons test. (C) Average Periostin and (D) collagen type I A2 (Col1A2) gene expression in LVs after 2 weeks of TAC. Statistical comparisons with WT sham, which has a theoretical mean of 1, were made with a 1-sample, 2-tailed t test. *P < 0.05 versus WT sham. Comparisons among all groups excluding WT sham were made by Kruskal-Wallis test with Dunn’s multiple comparisons test. P < 0.05 versus WT TAC. (E) Average percentage closure of in vitro scratch closure in WT and TREK-1–KO isolated fibroblasts over 44 hours (n = 5 separate experiments). Representative images included below, with leading edge marked in white. Data were compared using 2-way repeated measures ANOVA. *P < 0.05 in comparison with WT of the same time point using Bonferroni’s correction. (F) Average percentage of cutaneous wound closure in control and TREK-1 KO in 6-day wound-healing protocol (WT, n = 13; TREK-1 KO, n = 14). Representative tracings of wound size were included below. Statistical comparisons between the curves were performed using 2-way repeated measures ANOVA. Scale bars: 5 mm. *P < 0.05 in comparison with TREK-1 KO of the same time point using Bonferroni’s correction.
Figure 6
Figure 6. Fibroblast-specific TREK-1 loss of function protects against pressure overload–induced cardiac dysfunction.
(A) Conditional TREK-1 targeting strategy schematic: Frt sites flank a neomycin cassette and LoxP sites flank the conditional KO region. The conditional KO allele was obtained after Flp-mediated removal of the neomycin selection marker. (B) Serial echocardiographic measurements of average FS, (C) ESD, and (D) EDD in Kcnk2fl/fl alone (Cre negative), aMHC-cre;Kcnk2fl/fl (cardiomyocyte specific), and tcf21-iCre;Kcnk2fl/fl (fibroblast specific) mice up to 8 weeks after TAC. Error bars reflect SEM. Data were compared using 2-way repeated measures ANOVA. P values for the interaction between genotype and weeks after TAC are shown adjacent to brackets. Comparisons between genotypes at each time point were made using Bonferroni’s test for multiple comparisons. P < 0.05 versus Kcnk2fl/fl; *P < 0.05 versus aMHC-cre;Kcnk2fl/fl. (E) Tissue fibrosis quantified after 12 weeks of TAC in Kcnk2fl/fl (sham = 3, TAC = 13 mice), aMHC-cre-cre;Kcnk2fl/fl (TAC = 5 mice), and tcf21-iCre;Kcnk2fl/fl (n = 9 mice) mice using Masson’s trichrome stain. (F) Representative histological sections showing fibrosis in purple. Comparisons between genotypes were made by Kruskal-Wallis test with uncorrected Dunn’s multiple comparisons test. *P < 0.05 versus Kcnk2fl/fl sham; P < 0.05 versus Kcnk2fl/fl TAC; P < 0.05 versus aMHC-cre;Kcnk2fl/fl.
Figure 7
Figure 7. Global TREK-1 KO alters JNK phosphorylation.
(A) Immunoblotting results for phosphorylated JNK (phospho-JNK) and the downstream JNK target, c-Jun, in WT and TREK-1–KO 3-day and 14-day TAC hearts. Representative array blots shown in the lower panel. (B) Immunoblotting results for phosphorylated JNK in WT and TREK-1–KO hearts harvested after either a perfusion control (PC) or ex vivo stretch (Str). Representative array blots shown in the lower panel. Data for WT sham or perfusion control conditions, which have a theoretical mean of 1, were compared with Wilcoxon’s signed rank test. *P < 0.05 versus perfusion control condition of the same genotype. Data for all other groups excluding the perfusion control condition were compared by Kruskal-Wallis test with Dunn’s multiple comparisons test. P < 0.05 versus WT TAC. Full, uncut gels are shown in the supplemental material.
Figure 8
Figure 8. Cell type–specific TREK-1 KO affects JNK phosphorylation.
(A) Immunoblotting results for phosphorylated JNK in Kcnk2fl/fl, aMHC-cre;Kcnk2fl/fl, and tcf21-iCre;Kcnk2fl/fl hearts harvested after either perfusion control or ex vivo stretch. Data are reported as fold change from the perfusion control samples within a gel; all perfusion controls (n = 8) for respective genotypes are shown together (Kcnk2fl/fl, n = 4; aMHC-cre;Kcnk2fl/fl, n = 3; and tcf21-iCre; Kcnk2fl/fl, n = 1). Data for perfusion control conditions, which have a theoretical mean of 1, were compared with Wilcoxon’s signed rank test. *P < 0.05 versus perfusion control conditions of the same genotype. Data for all other groups excluding perfusion control conditions were compared by Kruskal-Wallis test with Dunn’s multiple comparisons test. P < 0.05 versus Kcnk2fl/fl TAC; P < 0.05 versus aMHC-cre;Kcnk2fl/fl. (B) Average JNK phosphorylation/total JNK in response to 20 minutes of treatment with EGF and 40 minutes of treatment with TGF-β in isolated WT and global TREK-1–KO lung fibroblasts (n = 6 separate experiments). Doses of either EGF or TGF-β were tested with a range of concentrations from 10–11 M to 10–7 M. Data are expressed as fold change from a nonstimulated (NS) condition. Data compared by 2-way ANOVA with Bonferroni’s multiple comparisons test. *P < 0.05 versus TREK-1–KO fibroblasts. Full, uncut gels are shown in the supplemental material.
Figure 9
Figure 9. TREK-1 SNP associated with human cardiac hypertrophy.
Locus zoom plots SNP rs10494995 in TREK-1 is associated with both (A) LVH and (B) SWT assessed by echocardiography.
Figure 10
Figure 10. Effect of TREK-1 on cardiac remodeling and function.
Working model of TREK-1’s influence on cardiac morphology and function. Under normal conditions (left side), pressure overload stimulates TREK-1–mediated JNK phosphorylation, which both inhibits concentric hypertrophy and activates fibroblast function, resulting in cardiac dysfunction. In TREK-1 KO (right panel), pressure overload–mediated JNK phosphorylation is inhibited, resulting in enhanced concentric hypertrophy and reduced fibroblast function that is overall cardioprotective.

References

    1. Fink M, et al. Cloning, functional expression and brain localization of a novel unconventional outward rectifier K+ channel. EMBO J. 1996;15(24):6854–6862. doi: 10.1002/j.1460-2075.1996.tb01077.x. - DOI - PMC - PubMed
    1. Goonetilleke L, Quayle J. TREK-1 K(+) channels in the cardiovascular system: their significance and potential as a therapeutic target. Cardiovasc Ther. 2012;30(1):e23–e29. doi: 10.1111/j.1755-5922.2010.00227.x. - DOI - PubMed
    1. Schmidt C, et al. Stretch-activated two-pore-domain (K2P) potassium channels in the heart: Focus on atrial fibrillation and heart failure. Prog Biophys Mol Biol. 2017;130(Pt B):233–243. - PubMed
    1. Gurney A, Manoury B. Two-pore potassium channels in the cardiovascular system. Eur Biophys J. 2009;38(3):305–318. doi: 10.1007/s00249-008-0326-8. - DOI - PubMed
    1. Kim D, Clapham DE. Potassium channels in cardiac cells activated by arachidonic acid and phospholipids. Science. 1989;244(4909):1174–1176. doi: 10.1126/science.2727703. - DOI - PubMed

Publication types

Substances