. 2018 Nov:183:102-113.
doi: 10.1016/j.biomaterials.2018.08.041. Epub 2018 Aug 21.

An engineered, quantifiable in vitro model for analysing the effect of proteostasis-targeting drugs on tissue physical properties

Affiliations

An engineered, quantifiable in vitro model for analysing the effect of proteostasis-targeting drugs on tissue physical properties

Sandra Loaiza et al. Biomaterials. 2018 Nov.

Abstract

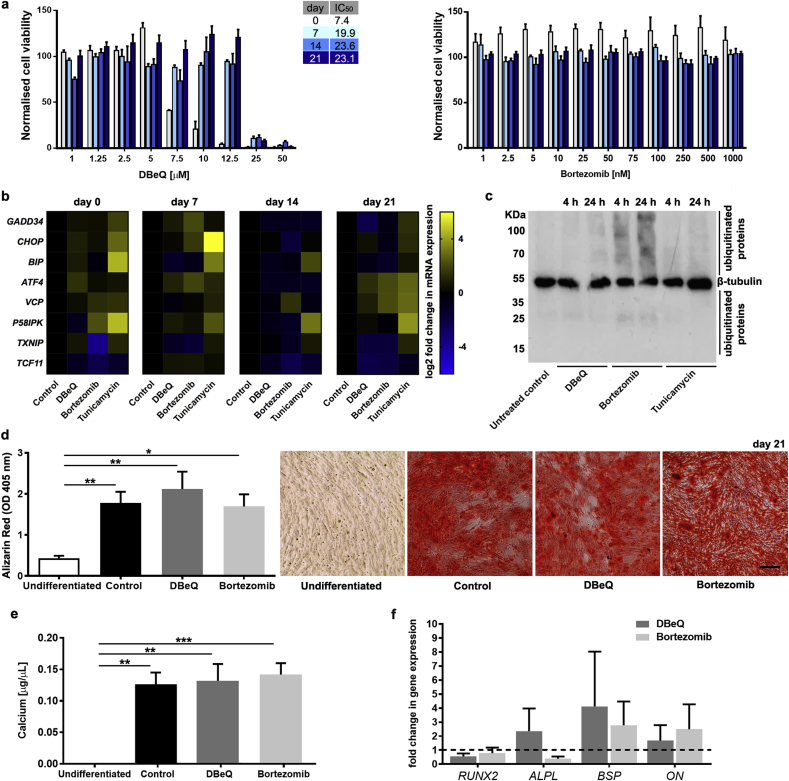
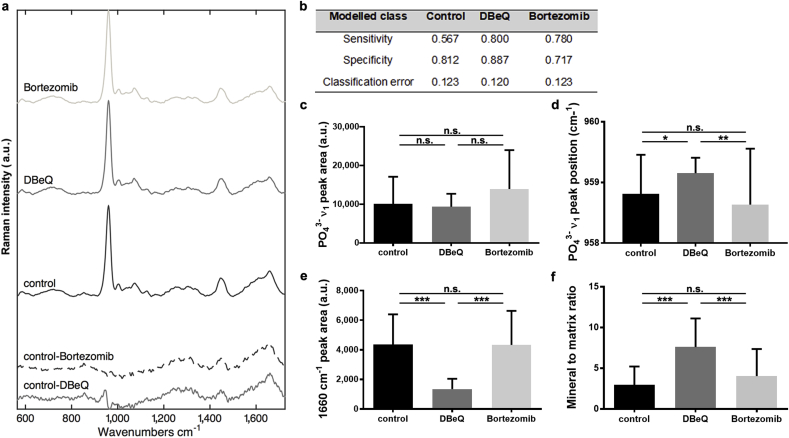
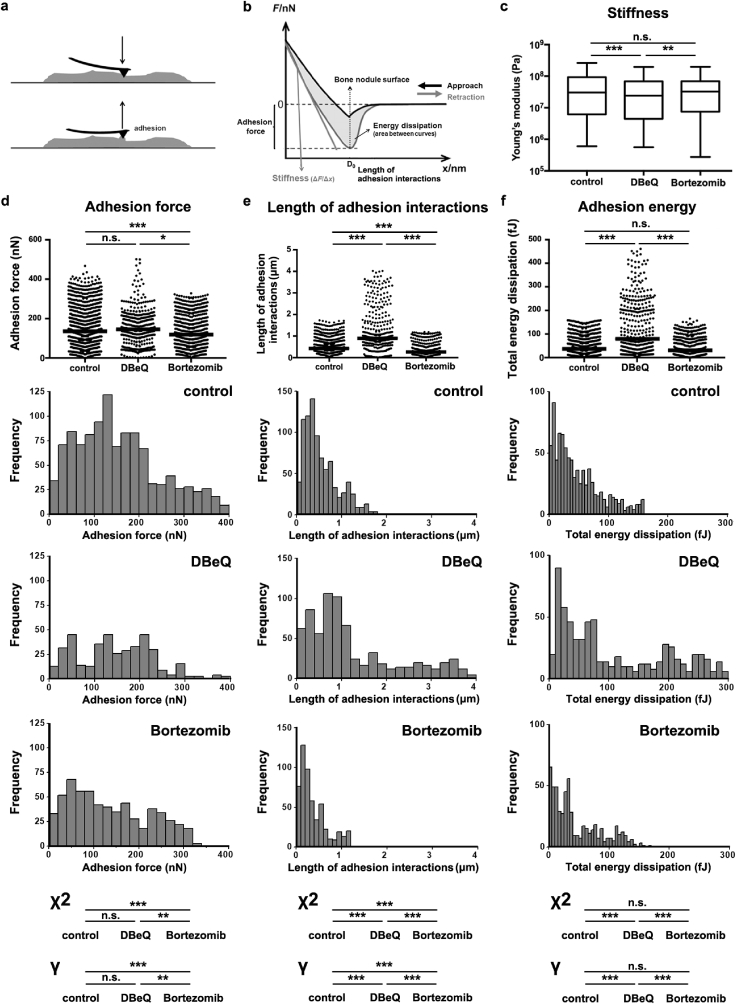
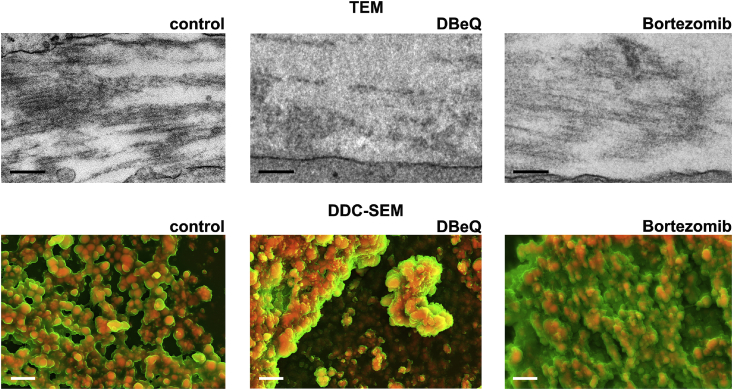
Cellular function depends on the maintenance of protein homeostasis (proteostasis) by regulated protein degradation. Chronic dysregulation of proteostasis is associated with neurodegenerative and age-related diseases, and drugs targeting components of the protein degradation apparatus are increasingly used in cancer therapies. However, as chronic imbalances rather than loss of function mediate their pathogenesis, research models that allow for the study of the complex effects of drugs on tissue properties in proteostasis-associated diseases are almost completely lacking. Here, to determine the functional effects of impaired proteostatic fine-tuning, we applied a combination of materials science characterisation techniques to a cell-derived, in vitro model of bone-like tissue formation in which we pharmacologically perturbed protein degradation. We show that low-level inhibition of VCP/p97 and the proteasome, two major components of the degradation machinery, have remarkably different effects on the bone-like material that human bone-marrow derived mesenchymal stromal cells (hMSC) form in vitro. Specifically, whilst proteasome inhibition mildly enhances tissue formation, Raman spectroscopic, atomic force microscopy-based indentation, and electron microscopy imaging reveal that VCP/p97 inhibition induces the formation of bone-like tissue that is softer, contains less protein, appears to have more crystalline mineral, and may involve aberrant micro- and ultra-structural tissue organisation. These observations contrast with findings from conventional osteogenic assays that failed to identify any effect on mineralisation. Taken together, these data suggest that mild proteostatic impairment in hMSC alters the bone-like material they form in ways that could explain some pathologies associated with VCP/p97-related diseases. They also demonstrate the utility of quantitative materials science approaches for tackling long-standing questions in biology and medicine, and could form the basis for preclinical drug testing platforms to develop therapies for diseases stemming from perturbed proteostasis or for cancer therapies targeting protein degradation. Our findings may also have important implications for the field of tissue engineering, as the manufacture of cell-derived biomaterial scaffolds may need to consider proteostasis to effectively replicate native tissues.

Keywords: Atomic force microscopy; Cancer diagnosis and therapy; Proteasome; Proteostasis; Raman spectroscopy; VCP/p97.


Figures

Fig. 1
Fig. 1
Mild proteostasis perturbations do not grossly affect the osteogenic differentiation of hMSC. a, Normalised viability of hMSC undergoing osteogenic differentiation treated on days 0, 7, 14, and 21 with the indicated concentrations of DBeQ or bortezomib for 48 h (n = 3). b, Heatmaps showing relative mRNA expression levels (normalised to undifferentiated controls) for GADD34, CHOP, BIP, ATF4, VCP, P58IPK, TXNIP and TCF11 in differentiating hMSC on days 0, 7, 14, and 21 after treatment for 24 h with DBeQ (5 μM), bortezomib (20 nM), or tunicamycin (5 μg/mL). c, Immunoblotting for β-tubulin and ubiquitinated proteins on whole cell extracts from undifferentiated hMSC untreated (control) or treated for 4 h or 24 h with 5 μM DBeQ, 20 nM bortezomib, or 5 μg/mL tunicamycin. d, Quantification and representative micrographs showing Alizarin Red S staining (Scale bar = 200 μm) and e, colorimetric calcium content quantitation of differentiated hMSC cultures. f, Relative mRNA expression levels for markers of osteogenic differentiation compared to undifferentiated controls, which are set to 1 (dotted horizontal line). In a, d-f, plots show mean + SEM and in b, heat maps show mean of log 2 fold changes in gene expression (normalised to undifferentiated controls) for hMSC from 3 different donors. In d-f, a Kruskal-Wallis non-parametric test followed by Dunn's Multiple Comparison test was used to detect statistical significance, *p < 0.05, **p < 0.01 and ***p < 0.001. For detailed n and p values see Supplementary Tables 1-4. (For interpretation of the references to colour in this figure legend, the reader is referred to the Web version of this article.)
Fig. 2
Fig. 2
VCP/p97 inhibition alters mineralised nodule composition as determined by Raman spectroscopy. a, Mean Raman spectra collected from mineralised nodules formed in control, DBeQ- and bortezomib-treated hMSC cultures. Difference spectra of DBeQ- and bortezomib-treated cultures compared to controls are shown in the bottom of the panel. Spectra are offset on the y-axis for clarity. b, Table showing the fraction of spectra in DBeQ- and bortezomib-treated groups and the control that could be classified by sensitivity, specificity and classification error using a cross-validated 6-component Partial Least Squares-Discriminant Analysis model. c, Univariate analyses of the mean PO43− ν1 peak area at ∼960 cm−1 in control, DBeQ- and bortezomib-treated cultures, d, mean PO43− ν1 peak position, and e, 1660 cm−1 peak area. f, Mean mineral to matrix ratio in control, DBeQ- and bortezomib-treated cultures. In c,-f, data are means + SD and a Kruskal-Wallis non-parametric test followed by Dunn's Multiple Comparison test was used to detect statistical significance. *p < 0.05, **p < 0.01 and ***p < 0.001. For detailed n and p values see Supplementary Table 5.
Fig. 3
Fig. 3
Proteasome and VCP/p97 inhibition have differing effects on mineralised nodules' stiffness and adhesion interactions. a, Schematic showing how mineralised nodules were probed by AFM in force-indentation mode using a cantilever with a pyramidal tip. b, Typical force-indentation curve generated from indenting a mineralised nodule. Schematic shows how nodule stiffness and adhesion interactions were calculated from the retraction curve. c, Measurements of Young's Modulus (Pa) of mineralised nodules. Plots show medians, 1st and 3rd quartiles and highest and lowest values. d, Measurements of adhesion force, e, length of adhesion interactions and f, adhesion energy generated from force-indentation curves on control, DBeQ- and bortezomib-treated cultures. Plots show medians. Histograms with their associated statistical analyses show how the distributions of values differed between the groups. In c.-f. a non-parametric Kruskal-Wallis test followed by Dunn's multiple comparison was used to determine statistical significance. Significant differences in the distributions of adhesion values were evaluated using a Mantel-Haenszel linear-by-linear association Chi-squared (χ2) test for trend. Power was evaluated by determining Goodman and Kruskal's gamma (γ). *p < 0.05, **p < 0.01 and ***p < 0.001. For detailed n and p values see Supplementary Table 6.
Fig. 4
Fig. 4
VCP/p97 inhibition impacts the ultra- and micro-structure of mineralised nodules. Transmission electron microscopy (TEM) and density-dependent colour scanning electron microscopy (DDC-SEM) micrographs of mineralised nodules formed from hMSC under standard osteogenic conditions or treated with DBeQ or bortezomib. In TEM images, proteinaceous fibrils are evident in the intercellular space in control and bortezomib-treated cultures. In DBeQ-treated samples, the proteinaceous matrix between cells appeared amorphous and clear fibrils were often not evident. Scale bar = 250 nm. In DDC-SEM micrographs, images were coloured in post-processing by combining images from secondary and backscatter electron detectors to identify dense mineral (red) and less dense matrix (green). In control and bortezomib-treated groups, there appears to be an association between the organic matrix and the mineral. In DBeQ-treated groups, dense mineral was often detected without the associated presence of less-dense matrix. Images are representative from experiments carried out on cultures grown from 3 independent donors. Scale bar = 2 μm. (For interpretation of the references to colour in this figure legend, the reader is referred to the Web version of this article.)

References

    1. Perez V.I., Buffenstein R., Masamsetti V., Leonard S., Salmon A.B., Mele J. Protein stability and resistance to oxidative stress are determinants of longevity in the longest-living rodent, the naked mole-rat. Proc. Natl. Acad. Sci. U.S.A. 2009;106:3059–3064. - PMC - PubMed
    1. Kaushik S., Cuervo A.M. Proteostasis and aging. Nat. Med. 2015;21:1406–1415. - PubMed
    1. Labbadia J., Morimoto R.I. The biology of proteostasis in aging and disease. Annu. Rev. Biochem. 2015;84:435–464. - PMC - PubMed
    1. Schneider K., Bertolotti A. Surviving protein quality control catastrophes--from cells to organisms. J. Cell Sci. 2015;128:3861–3869. - PubMed
    1. Clarke H.J., Chambers J.E., Liniker E., Marciniak S.J. Endoplasmic reticulum stress in malignancy. Canc. Cell. 2014;25:563–573. - PubMed

Publication types

MeSH terms

Substances