. 2018 Sep 7:12:817-828.
doi: 10.1016/j.omtn.2018.07.016. Epub 2018 Aug 4.

BMP4 Upregulation Is Associated with Acquired Drug Resistance and Fatty Acid Metabolism in EGFR-Mutant Non-Small-Cell Lung Cancer Cells

Affiliations

BMP4 Upregulation Is Associated with Acquired Drug Resistance and Fatty Acid Metabolism in EGFR-Mutant Non-Small-Cell Lung Cancer Cells

Duc-Hiep Bach et al. Mol Ther Nucleic Acids. .

Abstract

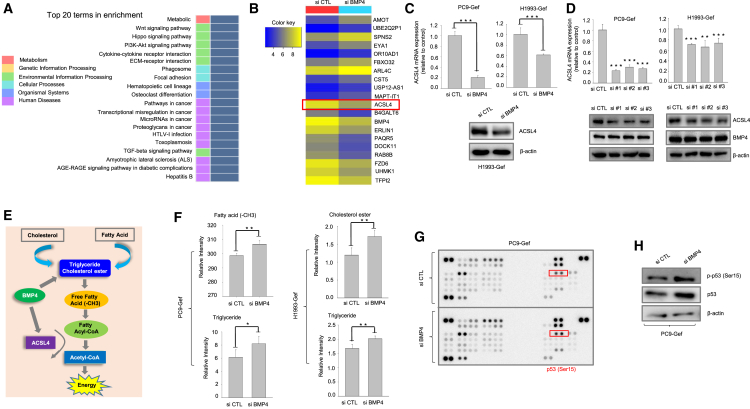
Lung cancer is the leading cause of cancer-associated deaths worldwide. In particular, non-small-cell lung cancer (NSCLC) cells harboring epidermal growth factor receptor (EGFR) mutations are associated with resistance development of EGFR tyrosine kinase inhibitor (EGFR-TKI) treatment. Recent findings suggest that bone morphogenetic proteins (BMPs) and microRNAs (miRNAs) might act as oncogenes or tumor suppressors in the tumor microenvironment. In this study, for the first time, we identified the potential roles of BMPs and miRNAs involved in EGFR-TKI resistance by analyzing datasets from a pair of parental cells and NSCLC cells with acquired EGFR-TKI resistance. BMP4 was observed to be significantly overexpressed in the EGFR-TKI-resistant cells, and its mechanism of action was strongly associated with the induction of cancer cell energy metabolism through the modulation of Acyl-CoA synthetase long-chain family member 4. In addition, miR-139-5p was observed to be significantly downregulated in the resistant NSCLC cells. The combination of miR-139-5p and yuanhuadine, a naturally derived antitumor agent, synergistically suppressed BMP4 expression in the resistant cells. We further confirmed that LDN-193189, a small molecule BMP receptor 1 inhibitor, effectively inhibited tumor growth in a xenograft nude mouse model implanted with the EFGR-TKI-resistant cells. These findings suggest a novel role of BMP4-mediated tumorigenesis in the progression of acquired drug resistance in EGFR-mutant NSCLC cells.

Keywords: Acyl-CoA synthetase long-chain family member 4; EGFR-TKI resistance; EGFR-mutant NSCLC cells; bone morphogenetic protein 4; energy metabolism; fatty acid; miR-139-5p; p53; yuanhuadine.


Figures

None
Graphical abstract
Figure 1
Figure 1
miR-139-5p Is a Novel miRNA Related to EGFR-TKI Resistance in NSCLC and Is Enhanced by YD (A) Heatmap representing changes in expression of top upregulated and downregulated miRNAs in PC9-Gef cells compared to PC9 cells. (B) Characterization of PC9 cells or PC9-Gef cells (left panel) and tissues (right panel) for miR-139-5p expression. miR-139-5p levels were quantified by Taqman assay and normalized to U6 small nuclear RNA (snRNA) levels. (C) Characterization of total exosome isolation from PC9 cells and PC9-Gef cells for miR-139-5p. miR-139-5p levels were quantified by Taqman assay as described in the Materials and Methods. (D–F) Characterization of indicated cells (D and E) and tissues (F) for miR-139-5p expression. miR-139-5p levels were quantified by Taqman assay as described in the Materials and Methods. (G) Heatmap showing changes in expression of top upregulated and downregulated miRNAs in PC9-Gef cells treated with control or YD (10 nM) for 24 hr. (H–K) Effects of YD on miR-139-5p expression. (H–J) The indicated cells (H, PC9-Gef or PC9-Erl; I, HCC827-Gef or HCC827-Erl; J, H1993-Gef or H1993-Erl) were treated with YD for 24 hr, and then miR-139-5p levels were analyzed by Taqman assay as described in the Materials and Methods. (K) Relative expression of miR-139-5p in the indicated xenografts. The levels of miR-139-5p were analyzed by Taqman assay as described in the Materials and Methods. Each assay was performed in triplicate and the expression of miR-139-5p was normalized to snRNA RNU6B.
Figure 2
Figure 2
BMP4 Is Identified by Combining Target Arrays (A) Heatmap showing relative expression among all groups. Left panel: PC9-Gef cells were treated for 24 hr with 10 nM YD or vehicle control. Right panel: PC9-Gef cells were transfected with miR-139-5p or miRNA mimic for 48 hr. Rows represent genes and columns represent samples. Yellow blocks represent high expression and blue blocks low expression relative to control cells. (B–D) Characterization of the indicated parental or drug-resistant cell lines and tissues (PC9 and PC9-Gef cells (B) or tissues (C); H1993 and H1993-Gef cells (D, left panel) and tissues (D, right panel) for BMP4 expression at both the protein and mRNA levels. (E) Effects of miR-139-5p mimic on miR-139-5p expression in the indicated gef-resistant cell lines. The indicated gef-resistant cell lines were cultured in 6-well plates and then transfected with negative control mimic or miR-139-5p for 48 hr (50 pmol/well). The expression levels of miR-139-5p were determined by Taqman assay with specific primers for mature miR-139-5p. Expression levels in each sample were normalized to levels of U6 snRNA. (F) The indicated cells were post-transfected with miR-139-5p for 24 hr. Then, the indicated cells were further treated with YD (10 nM) for 24 hr. The cell lysates were subsequently analyzed by real-time PCR and immunoblotting, as described in the Materials and Methods. (G and H) RIP assay of miR-139-5p interaction with BMP4 mRNA. Co-immunoprecipitated BMP4 mRNA (G) and miR-139-5p (H) by anti-AGO-2 RIP are shown. The data were normalized to β-actin or U6 snRNA, respectively. NC, negative control. (I) Relative expression of BMP4 in the indicated xenograft tumors. The levels of BMP4 were analyzed by real-time PCR (upper panel) or immunoblotting (lower panel), as described in the Materials and Methods. (J) Immunohistochemical analysis for BMP4 in the indicated tumor tissue sections.
Figure 3
Figure 3
BMP4 Depletion Modulates the Growth of EGFR-TKI-Resistant NSCLC Cells (A and B) Confirmation of BMP4-knockdown efficiency at the mRNA (upper panels) and protein levels (lower panels) in PC9-Gef (A) and H1993-Gef (B) cells. (C) Cells were transiently post-transfected with control or BMP4 #2 siRNA for 48 hr, and then incubated with the indicated concentrations of gef. Cell viability was further assessed by SRB assay as described in the Materials and Methods. (D) The indicated cells were transiently post-transfected with either scramble siRNA or BMP4 #2 siRNA for 48 hr, then cultured for colony formation assays as described in the Materials and Methods. (E and F) PC9-Gef cells were transiently post-transfected with either scramble siRNA or BMP4 #2 siRNA for 48 hr, then cultured for invasion (E) and migration (F) assays as described in the Materials and Methods. (G and H) Confirmation of BMP4-knockdown efficiency by shRNA at both the mRNA (G) and protein (H) levels in stable knockout PC9-Gef and H1993-Gef cells, as described in the Materials and Methods. (I and J) Tumor-forming ability of BMP4-silenced gef-resistant NSCLC cells. BALB/c nude mice received subcutaneous transplants of PC9-Gef-sh control (n = 5) and PC9-Gef-shBMP4 (shA or shD) (n = 5) cells or H1993-Gef-sh control (n = 5) and H1993-Gef-shBMP4 (shA or shD) (n = 5) cells. (I) Tumor volumes at the indicated time points. (J) Tumor weights (upper panels) and representative photographs 40 days (PC9-Gef) and 30 days (H1993-Gef) after injection (lower panels).
Figure 4
Figure 4
LDN-193189 Treatment Attenuates EGFR Mutation Resistance in In Vivo Tumor Growth (A) The indicated cells were treated with LDN-193189 for 72 hr and cell proliferation was determined by SRB assay. The IC50 values were calculated using the TableCurve 2D software and the data are presented as the mean ± SD. (B) PC9-Gef cells and H1993-Gef cells were treated with the indicated concentrations of LDN-193189 for 24 hr, and the cell lysates were further analyzed by immunoblotting using β-actin as a loading control. (C) PC9-Gef cells and H1993-Gef cells were treated with the indicated concentrations of LDN-193189 either alone or in combination with 10 nM YD for 48 hr. Cell proliferation was determined by SRB assay. (D) PC9-Gef cells (6 × 106 cells/mouse) and H1993-Gef cells (5 × 106 cells/mouse) were implanted subcutaneously into the flanks of BALB/c-nude mice. 3 weeks of dosing with LDN (4 mg/kg body weight for PC9-Gef cells or 5 mg/kg body weight for H1993-Gef cells) was initiated when the PC9-Gef tumor volumes reached approximately 100 mm3 and H1993-Gef tumor sizes reached approximately 170 mm3. The tumor volumes were measured every 3 days (n = 5 mice per group). The error bars represent the means ± SD. (E) Tumors were excised from animals on days 4 (PC9-Gef) or 21 (H1993-Gef) after treatment and tumor weights were measured. (F) Body weights of the mice were monitored during the experiments for toxicity. (G) Immunohistochemical analysis of PC9-Gef and H1993-Gef xenograft tumors. Formalin-fixed, paraffin-embedded tumor sections were blocked and probed with an antibody against Ki-67, which was detected using the LSAB + System-HRP kit (Dako).
Figure 5
Figure 5
BMP4 Knockdown Influences Metabolism and p53 (A) Heatmap showing and comparing top enriched terms. Enrichment test based on the gene ontology (GO, http://geneontology.org/) database was conducted using the significant gene list. Significant enrichments are displayed in blue (p value = 0.0001). (B) Heatmap representing changes in expression of top upregulated and downregulated genes in PC9-Gef cells transfected with control or BMP4 #2 siRNA. (C) PC9-Gef and H1993-Gef cells were transfected with control or BMP4 siRNA for 48 hr, then cell lysates were subjected to real-time PCR (top panels) or immunoblotting (bottom panels). (D) PC9-Gef and H1993-Gef cells were transfected with control or ACSL4 siRNA for 48 hr, then cell lysates were subjected to real-time PCR (top panels) or immunoblotting (bottom panels). (E) Schematic diagram illustrating the proposed BMP4 pathway modulating energy metabolism through ACSL4 and triglycerides. (F) PC9-Gef and H1993-Gef cells were transfected with control and BMP4 #2 siRNA for 48 hr, and then cell lysates were further processed for metabolic analyses as described in the Materials and Methods. (G) PC9-Gef cells were transfected with control or siBMP4 #2 siRNA for 48 hr, and cell lysates were subjected to the phosphor-kinase array. p-p53 (Ser15) expression levels are indicated. (H) Indicated cells were transfected with either siBMP4 #2 or siCTL for 48 hr, and then lysates were analyzed for p-p53 and total p53 by immunoblotting.

References

    1. Diaz L.A., Jr., Williams R.T., Wu J., Kinde I., Hecht J.R., Berlin J., Allen B., Bozic I., Reiter J.G., Nowak M.A. The molecular evolution of acquired resistance to targeted EGFR blockade in colorectal cancers. Nature. 2012;486:537–540. - PMC - PubMed
    1. Engelman J.A., Settleman J. Acquired resistance to tyrosine kinase inhibitors during cancer therapy. Curr. Opin. Genet. Dev. 2008;18:73–79. - PubMed
    1. Holohan C., Van Schaeybroeck S., Longley D.B., Johnston P.G. Cancer drug resistance: an evolving paradigm. Nat. Rev. Cancer. 2013;13:714–726. - PubMed
    1. Nakata A., Gotoh N. Recent understanding of the molecular mechanisms for the efficacy and resistance of EGF receptor-specific tyrosine kinase inhibitors in non-small cell lung cancer. Expert Opin. Ther. Targets. 2012;16:771–781. - PubMed
    1. Sharma S.V., Bell D.W., Settleman J., Haber D.A. Epidermal growth factor receptor mutations in lung cancer. Nat. Rev. Cancer. 2007;7:169–181. - PubMed