. 2018 Oct 15;78(20):5863-5876.
doi: 10.1158/0008-5472.CAN-18-0855. Epub 2018 Aug 28.

PTTG and PBF Functionally Interact with p53 and Predict Overall Survival in Head and Neck Cancer

Affiliations

PTTG and PBF Functionally Interact with p53 and Predict Overall Survival in Head and Neck Cancer

Martin L Read et al. Cancer Res. .

Abstract

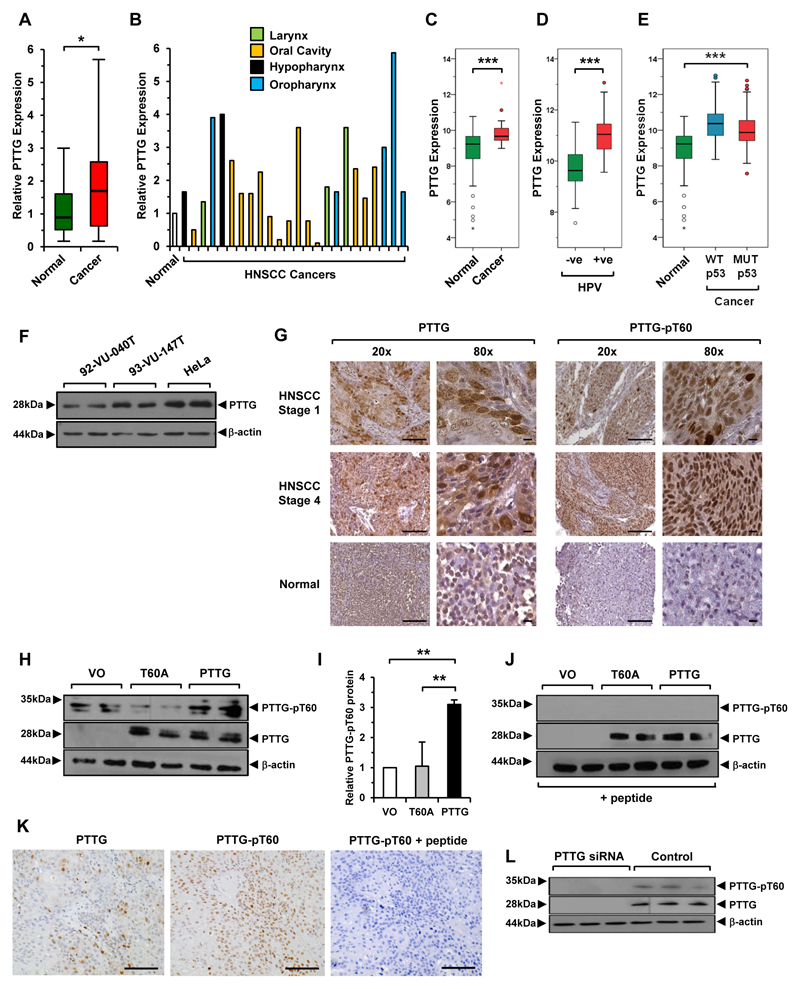
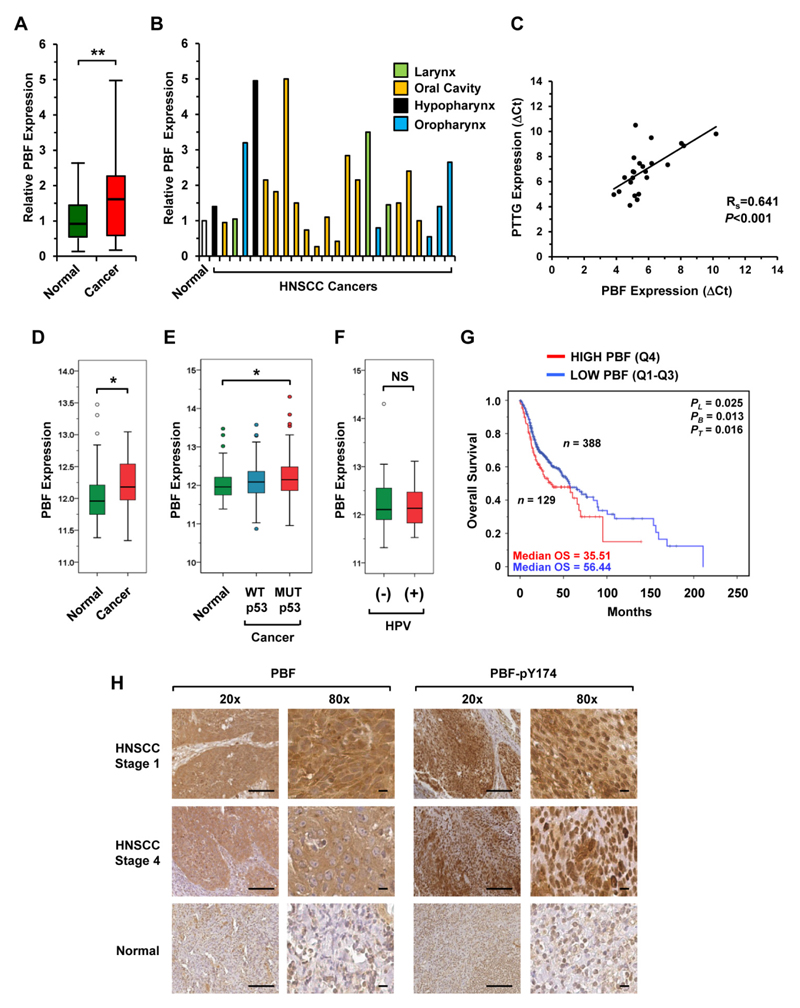
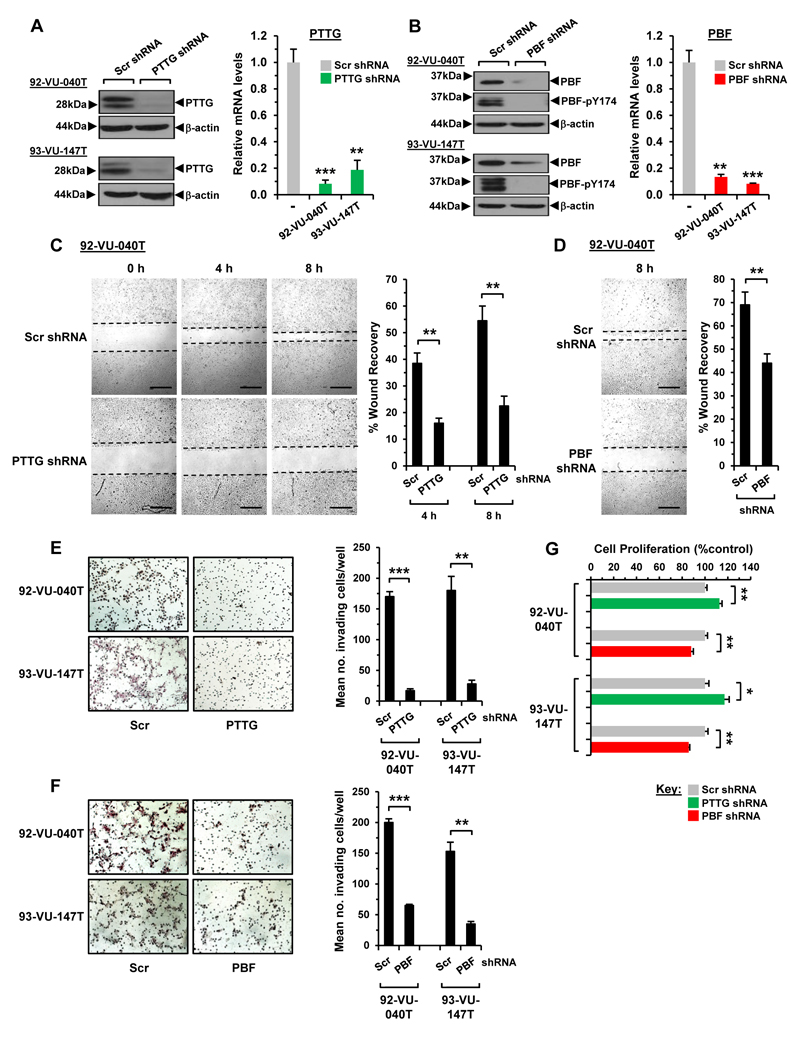
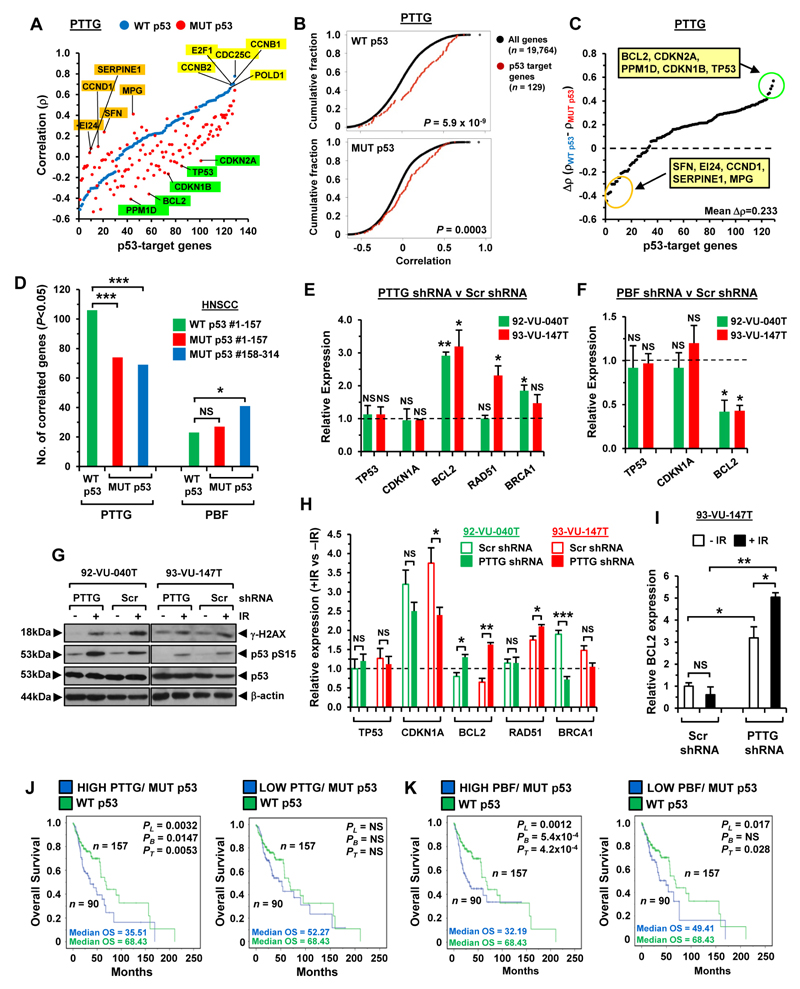
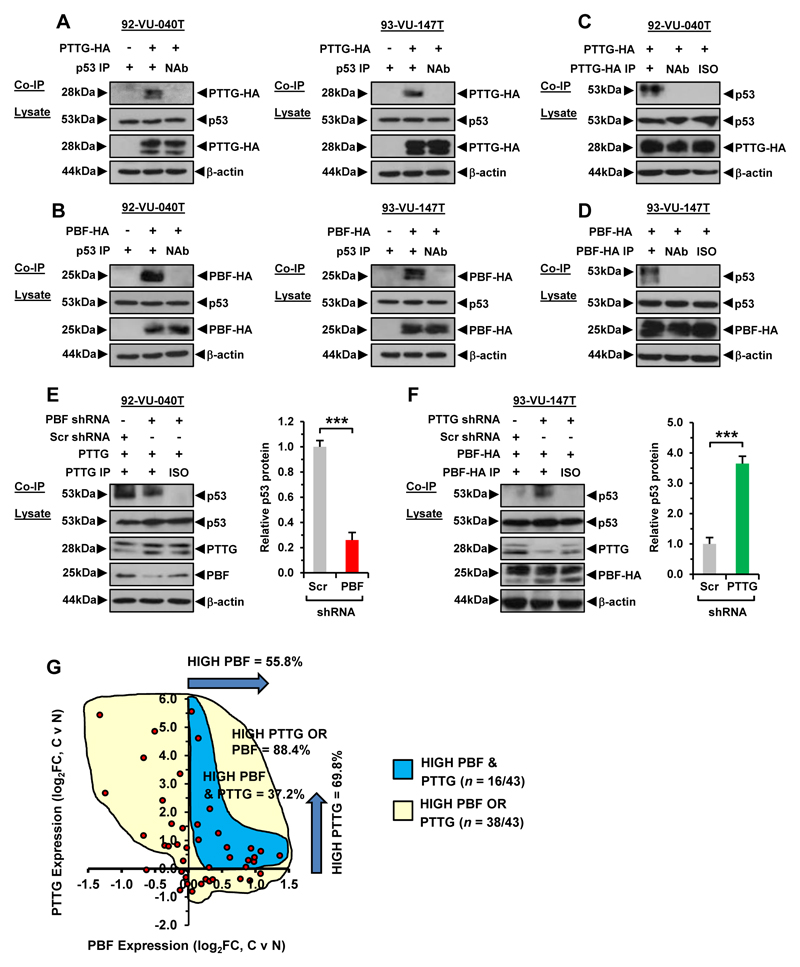
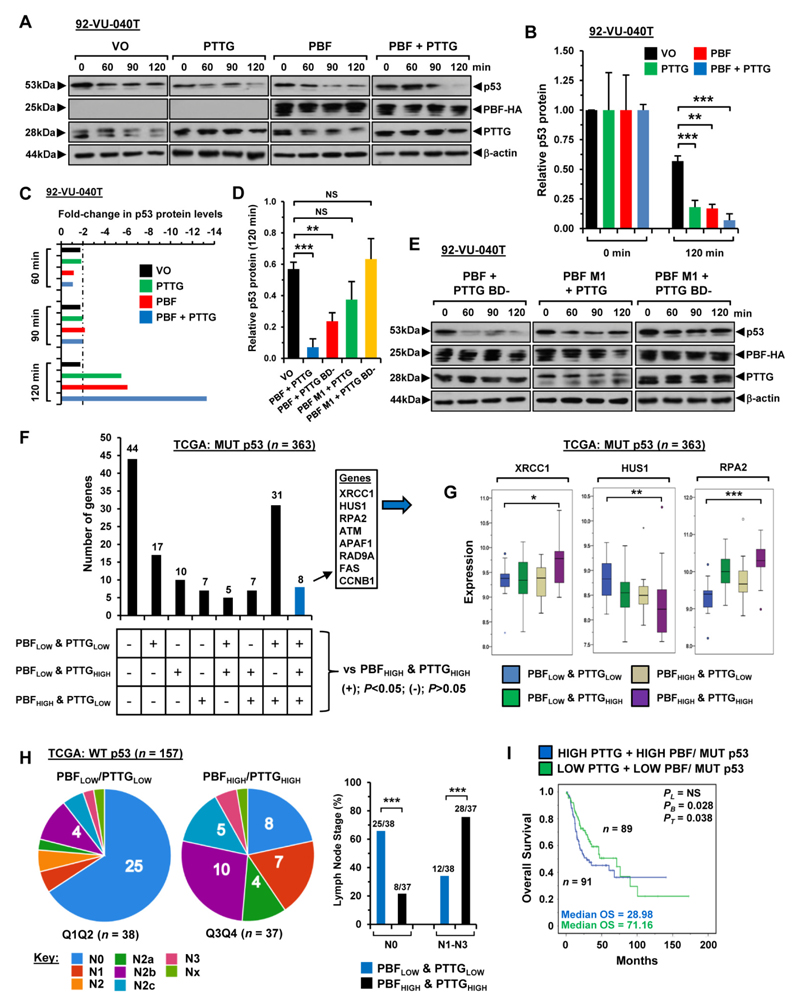
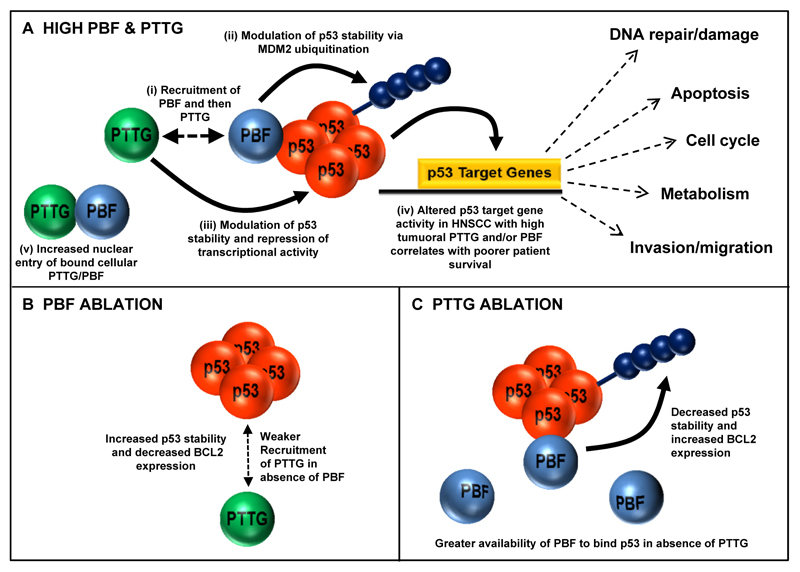
Head and neck squamous cell carcinoma (HNSCC) is the 6th most common cancer worldwide and poses a significant health burden due to its rising incidence. Although the proto-oncogene pituitary tumor-transforming gene 1 (PTTG) predicts poor patient outcome, its mechanisms of action are incompletely understood. We show here that the protein PBF modulates PTTG function, is overexpressed in HNSCC tumors, and correlates with significantly reduced survival. Lentiviral shRNA attenuation of PTTG or PBF expression in HNSCC cells with either wild-type or mutant p53, and with and without HPV infection, led to dysregulated expression of p53 target genes involved in DNA repair and apoptosis. Mechanistically, PTTG and PBF affected each other's interaction with p53 and cooperated to reduce p53 protein stability in HNSCC cells independently of HPV. Depletion of either PTTG or PBF significantly repressed cellular migration and invasion and impaired colony formation in HNSCC cells, implicating both proto-oncogenes in basic mechanisms of tumorigenesis. Patients with HNSCC with high tumoral PBF and PTTG had the poorest overall survival, which reflects a marked impairment of p53-dependent signaling.Significance: These findings reveal a complex and novel interrelationship between the expression and function of PTTG, PBF, and p53 in human HNSCC that significantly influences patient outcome. Cancer Res; 78(20); 5863-76. ©2018 AACR.


Conflict of interest statement

Conflict of interest: The authors assert they have no conflicts of interest.

Figures

Figure 1
Figure 1. Increased PTTG expression and phosphorylation.
A, PTTG mRNA expression in HNSCC (cancer) relative to matched normal; *, P<0.05. B, Individual PTTG mRNA levels at HNSCC subsites. C-E, Box-whisker plots of PTTG expression in (C) matched (normal/cancer) TCGA data, (D) HPV (-ve) versus (+ve) HNSCC and (E) unmatched HNSCC with either WT or MUT p53 relative to normal; ***P<0.001. F, Western blot analysis of PTTG expression in HNSCC cell lines used in study compared to HeLa cells. G, Representative images of PTTG (total and pT60) in HNSCC/normal tissue. Images at 20x (scale bars, 100μm) and 80x (scale bars, 10μm) magnification. H, Western blot analysis of PTTG (total and pT60) in HeLa cells transfected with WT PTTG, T60A mutant or vector only (VO). I, Quantification of PTTG-pT60 from (H); **P<0.01. J, Same as (H) but Western blot preincubated with neutralising peptide. K, Same as (G) but HNSCC tissue preincubated with neutralising peptide prior to immunostaining. (right) Control images of PTTG (left) and PTTG-pT60 (middle) in HNSCC tissue without neutralising peptide. Scale bars, 100 μm. L, Western blot analysis of PTTG (total and pT60) in HeLa cells transfected with PTTG or control siRNA.
Figure 2
Figure 2. Elevated PBF expression and poorer survival.
A, PBF mRNA expression in HNSCC (cancer) relative to matched normal; **P<0.01. B, Individual PBF mRNA levels at HNSCC subsites. C, Correlation of PBF and PTTG mRNA expression in HNSCC; ***P<0.001. D-F, Box-whisker plots showing PBF expression in (D) matched (normal/cancer) TCGA data, (E) unmatched HNSCC with either WT or MUT p53 relative to normal, and (F) HPV (-ve) versus (+ve) HNSCC; NS, not-significant; *P<0.05. G, Overall survival for HNSCC with high (top 25 percentile) versus low tumoural PBF expression (bottom 75 percentile) in TCGA; *P<0.05. H, Representative images of PBF (total and pY174) in HNSCC and normal tissue. Images at 20x (scale bars, 100μm) and 80x (scale bars, 10μm) magnification.
Figure 3
Figure 3. Depletion of PTTG and PBF abrogates cell movement.
A, Relative PTTG protein (left) and mRNA expression (right) in HNSCC cells transduced with PTTG or Scr shRNA; **P<0.01; ***P<0.001. B, Same as (A) but relative PBF expression in PBF shRNA transduced cells. C, Representative images of scratch wound assays in 92-VU-040T cells transduced with PTTG or Scr shRNA. Images taken after 0, 4 and 8h. Scale bars, 500μm. (right) %wound recovery at indicated time points; **P<0.01. D, Same as (C) but wound healing in PBF shRNA transduced cells. E, Representative photomicrographs of 2D Boyden cell invasion assays in HNSCC cells transduced with PTTG or Scr shRNA. (right) Quantification of invading cells; **P<0.01; ***P<0.001. F, Same as (E) but cells transduced with PBF shRNA. G, Proliferation of HNSCC cells transduced with PTTG, PBF or Scr shRNA; *P<0.05; **P<0.01. Data presented as mean±SE.
Figure 4
Figure 4. Association of PTTG and PBF with p53-target genes.
A, Correlation pattern of PTTG with 129 p53-target genes in unmatched HNSCC with WT p53 (blue dots) and MUT p53 (red dots). B, Cumulative distribution plot comparing the correlations between PTTG with all detectable genes versus p53-target genes in WT (upper) and MUT p53 (lower) HNSCC. C, Differences in ρ values for p53-target genes between WT and MUT p53 HNSCC. D, p53-target genes significantly correlated with PTTG or PBF in WT and MUT p53 HNSCC (n=157 per cohort; NS, not significant; *P<0.05; ***P<0.001). E, Relative mRNA expression of indicated genes in PTTG or Scr shRNA transduced cells. Data presented as mean±SE. F, Same as (E) but cells transduced with PBF shRNA. G, Western blot analysis of γ-H2AX, p53 S15 and p53 in PTTG or Scr shRNA transduced cells irradiated with 15-Gy dose. H, Relative fold-change in mRNA expression of indicated genes following irradiation (+IR) of PTTG or Scr shRNA transduced cells versus non-irradiated controls (-IR). (NS, not significant; *P<0.05; **P<0.01; ***P<0.001). I, BCL2 expression relative to levels in Scr shRNA transduced cells (-IR). J, Overall survival for MUT p53 HNSCC with high (Q4, left) or low (Q1, right) PTTG expression compared to WT p53 HNSCC. K, Overall survival for MUT p53 HNSCC with high (Q4, left) or low (Q1, right) PBF expression compared to WT p53 HNSCC.
Figure 5
Figure 5. PTTG and PBF reciprocally alter stringency of binding to p53.
A, Co-IP assays in 92-VU-040T (left) and 93-VU-147T cells (right) showing specific interaction between PTTG-HA and p53. B, Same as (A) but specific interaction between PBF-HA and p53. C, Reciprocal co-IP assay in 92-VU-040T cells showing specific interaction between PTTG-HA and p53. D, Same as (C) but specific interaction between PBF-HA and p53 in 93-VU-147T cells. E, Co-IP assay in PBF shRNA transduced 92-VU-040T cells showing reduced interaction between PTTG and p53. (right) Mean p53 protein levels relative to β-actin. Data presented as mean±SE; ***P<0.001. F, Co-IP assay in PTTG shRNA transduced 93-VU-147T cells showing greater interaction between PBF and p53. (right) Mean p53 protein levels relative to β-actin. Data presented as mean±SE; ***P<0.001. G, Scatterplot showing fold change (FC) in PBF and PTTG expression in HNSCC versus matched normal samples (log2, n = 43, TCGA data set).
Figure 6
Figure 6. Impact of PBF and PTTG on dynamics of p53 turnover.
A, Western Blot analysis of p53 stability in 92-VU-040T cells transfected with VO, PBF, PTTG or PBF+PTTG and lysed at indicated times post-treatment with anisomycin. B, Mean p53 protein levels normalised to β-actin from half-life study described in (A). Data presented as mean±SE from 3 independent experiments; **P<0.001; ***P<0.001. C, Fold-changes in relative p53 protein levels normalised to β-actin at indicated time points post-anisomycin treatment in 92-VU-040T cells. D-E, p53 stability assays as in (A) and (B) but using 92-VU-040T cells transfected with PBF M1+PTTG, PBF+PTTG BD- or PBF M1+BD-. F, Differentially expressed p53-target genes in MUT p53 HNSCC with high PBF/PTTG expression versus other PBF/PTTG expression subgroups. G, Box whisker plots for XRCC1, HUS1 and RPA2 in PBF/PTTG expression subgroups in MUT p53 HNSCC as identified in (F); *P<0.05; **P<0.001; ***P<0.001. H, Association of PBF/PTTG expression subgroups with lymph node staging in WT p53 HNSCC; ***P<0.001; Fisher’s exact test. I, Overall survival for MUT p53 HNSCC with high versus low PBF/PTTG expression. Median PBF and PTTG expression values used to stratify patients into subgroups.
Figure 7
Figure 7. Proposed model of PTTG, PBF and p53 functional interaction.
A, (i) PBF binds p53 and recruits PTTG. (ii) PBF targets p53 ubiquitination via MDM2 while (iii) PTTG can modulate p53 stability and repress transcriptional activity. (iv) PTTG and PBF cooperate to disrupt p53 pathways associated with processes such as DNA damage repair to promote tumorigenesis. High PTTG and/or PBF correlates with poorer HNSCC patient survival. (v) High tumoural PBF expression also promotes nuclear uptake of PTTG. B, PBF ablation weakens recruitment of PTTG to p53 thereby reducing capacity to modulate p53 stability. C, PTTG ablation increases PBF availability to bind p53 due to diminished PBF:PTTG interaction.

References

    1. Ferlay J, Soerjomataram I, Dikshit R, Eser S, Mathers C, Rebelo M, et al. Cancer incidence and mortality worldwide: sources, methods and major patterns in GLOBOCAN 2012. Int J Cancer. 2015;136:E359–86. - PubMed
    1. Global Burden of Disease Cancer C. Fitzmaurice C, Allen C, Barber RM, Barregard L, Bhutta ZA, et al. Global, Regional, and National Cancer Incidence, Mortality, Years of Life Lost, Years Lived With Disability, and Disability-Adjusted Life-years for 32 Cancer Groups, 1990 to 2015: A Systematic Analysis for the Global Burden of Disease Study. JAMA Oncol. 2017;3:524–48. - PMC - PubMed
    1. Chung CH, Parker JS, Karaca G, Wu J, Funkhouser WK, Moore D, et al. Molecular classification of head and neck squamous cell carcinomas using patterns of gene expression. Cancer Cell. 2004;5:489–500. - PubMed
    1. Rampias T, Pectasides E, Prasad M, Sasaki C, Gouveris P, Dimou A, et al. Molecular profile of head and neck squamous cell carcinomas bearing p16 high phenotype. Ann Oncol. 2013;24:2124–31. - PubMed
    1. Walter V, Yin X, Wilkerson MD, Cabanski CR, Zhao N, Du Y, et al. Molecular subtypes in head and neck cancer exhibit distinct patterns of chromosomal gain and loss of canonical cancer genes. PLoS One. 2013;8:e56823. - PMC - PubMed

Publication types

MeSH terms