. 2018 Sep 11;115(37):9110-9115.
doi: 10.1073/pnas.1807750115. Epub 2018 Aug 28.

Mechanics of elastomeric molecular composites

Affiliations

Mechanics of elastomeric molecular composites

Pierre Millereau et al. Proc Natl Acad Sci U S A. .

Abstract

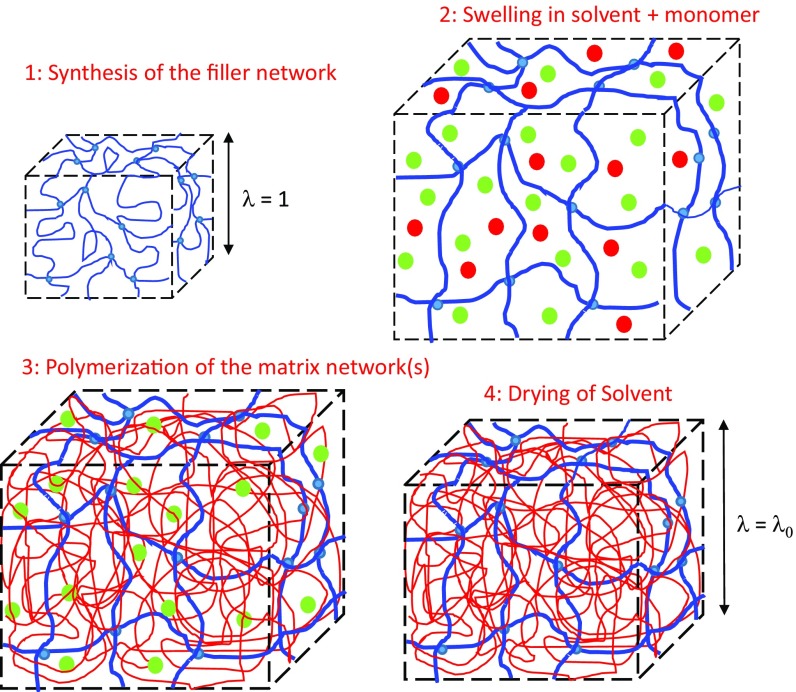
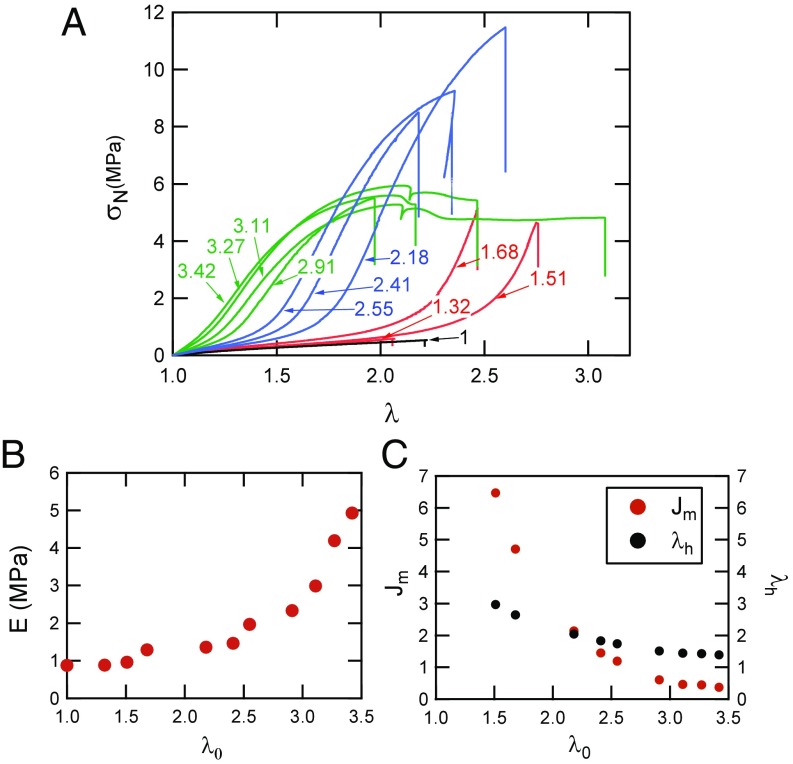
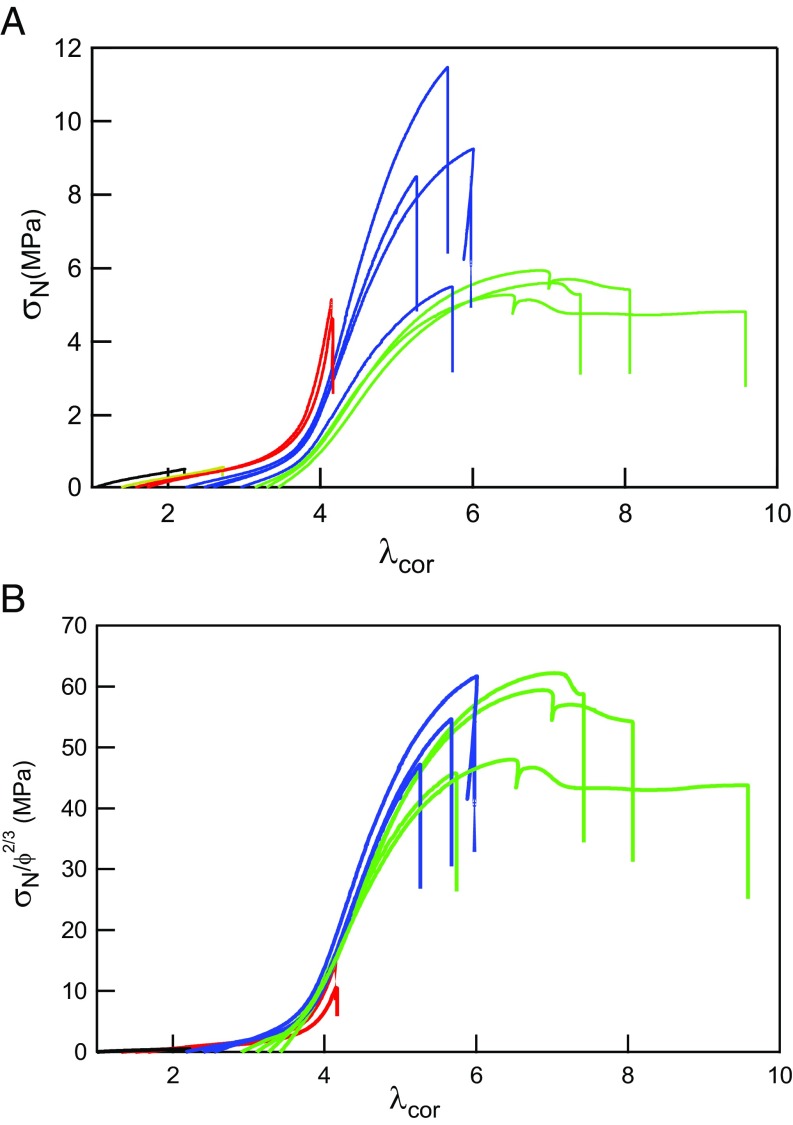
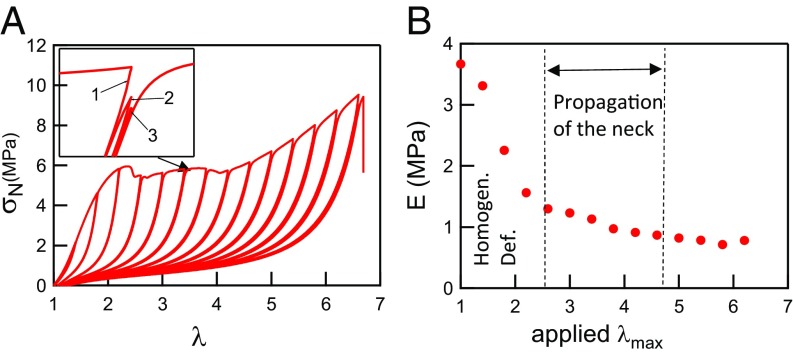
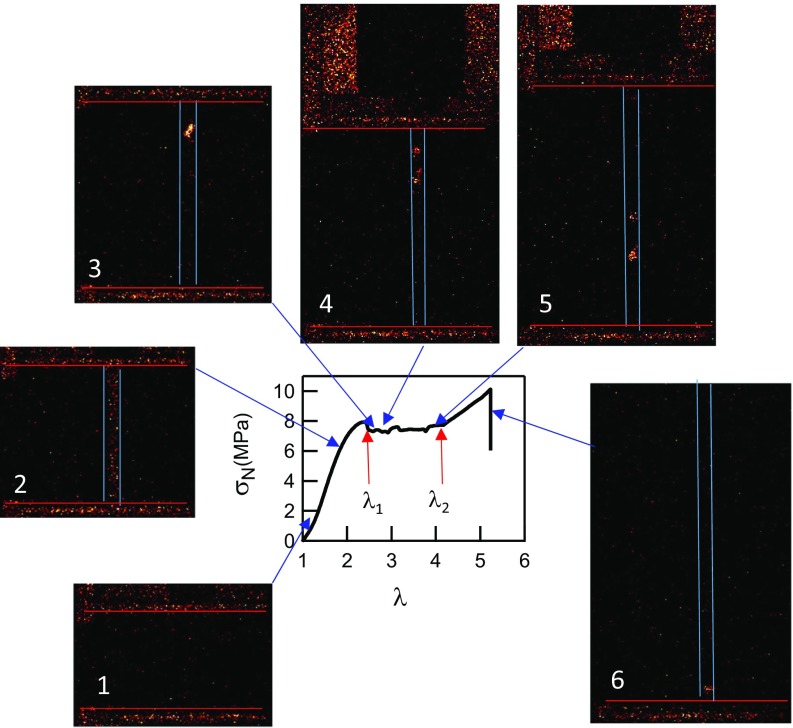
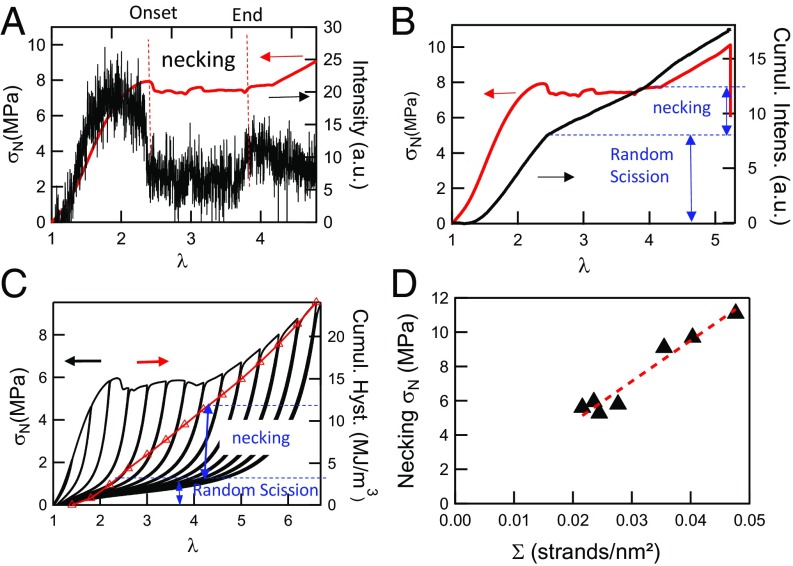
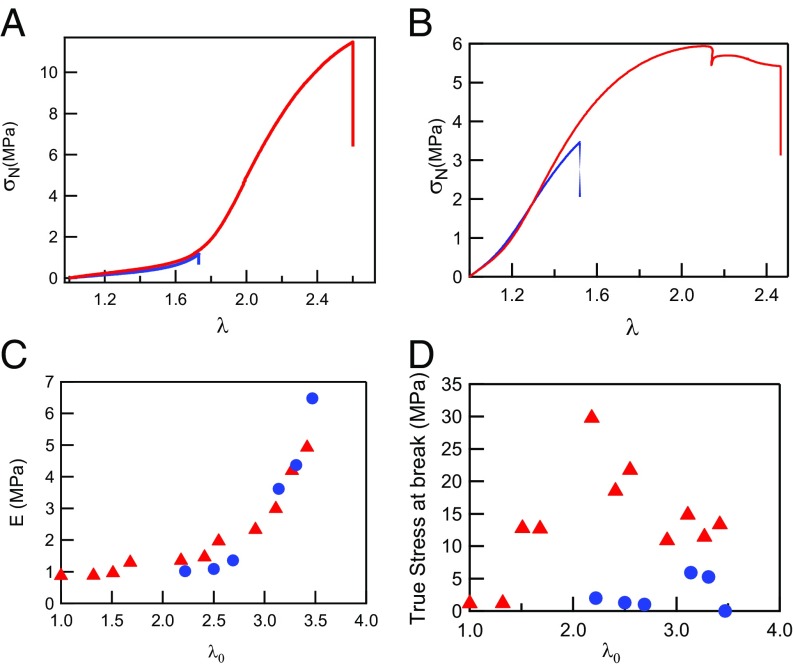
A classic paradigm of soft and extensible polymer materials is the difficulty of combining reversible elasticity with high fracture toughness, in particular for moduli above 1 MPa. Our recent discovery of multiple network acrylic elastomers opened a pathway to obtain precisely such a combination. We show here that they can be seen as true molecular composites with a well-cross-linked network acting as a percolating filler embedded in an extensible matrix, so that the stress-strain curves of a family of molecular composite materials made with different volume fractions of the same cross-linked network can be renormalized into a master curve. For low volume fractions (<3%) of cross-linked network, we demonstrate with mechanoluminescence experiments that the elastomer undergoes a strong localized softening due to scission of covalent bonds followed by a stable necking process, a phenomenon never observed before in elastomers. The quantification of the emitted luminescence shows that the damage in the material occurs in two steps, with a first step where random bond breakage occurs in the material accompanied by a moderate level of dissipated energy and a second step where a moderate level of more localized bond scission leads to a much larger level of dissipated energy. This combined use of mechanical macroscopic testing and molecular bond scission data provides unprecedented insight on how tough soft materials can damage and fail.

Keywords: composite; elastomer; mechanical properties; network; polymer.


Conflict of interest statement

The authors declare no conflict of interest.

Figures

Fig. 1.
Fig. 1.
Synthesis of multiple networks with intermediate value of the prestretching λ0. Red dots, EA monomer; green dots, ethyl acetate; blue network, filler network; red network, matrix network.
Fig. 2.
Fig. 2.
(A) Stress–strain curves of different composites EA (λ0) made from the same filler network. The value of λ0 is shown in the labels attached to each curve. The color corresponds to the number of polymerization steps: black, one; red, two; blue, three; and green, four. λ˙ = 0.021 s−1 for all tests. (B) Young’s modulus as a function of the degree of prestretching λ0 of the filler network. (C) Evolution of Jm and λh obtained from the best fit to the Gent model as a function of λ0.
Fig. 3.
Fig. 3.
(A) Nominal stress σN as a function of λcor for the stress–strain curves of Fig. 2A. (B) Nominal stress renormalized by ϕ2/3 as a function of λcor for the stress–strain curves of Fig. 2A. In both figures the color corresponds to the number of polymerization steps: black, one; red, two; blue, three; and green, four. λ˙ = 0.021 s−1 for all tests. λ˙ = 0.021 s−1.
Fig. 4.
Fig. 4.
(A) Step-cycle tensile experiment at λ˙ = 0.020 s−1 carried out on EA(3.42) showing a large hysteresis and a second hardening for λ > 4. Three cycles are carried out at each incremental value of λ. (B) Evolution of the normalized Young’s modulus with the maximum deformation.
Fig. 5.
Fig. 5.
Stress–strain curve of the sample EA(d20)0.73(2.94)EA. The signal was obtained while images were recorded. Images showing the mechanoluminescent signal of the sample EA(d20)0.73(2.94)EA. Red horizontal lines correspond to the position of the clamps and the two blue vertical lines in panels 2–6 represent the position of the sample. The numbers are referring to the state of stress and strain of the sample when the signal is recorded. The color scale represents the count that can be compared between each picture, but its unit is arbitrary.
Fig. 6.
Fig. 6.
(A) Stress–strain curve (red line) and intensity of the mechanoluminescent signal (black line) as a function stretch for the sample EA(d20)0.73(2.94). (B) Cumulated intensity (black line) of the mechanoluminescent signal and nominal stress (red line) as a function of λ. (C) Cumulated mechanical hysteresis (red symbols) and nominal stress (black line) in a cyclic test carried out on the EA1.45(3.42) as a function of λ, along with the nominal stress. (D) Evolution of the necking stress as a function of the filler network’s areal density of strands.
Fig. 7.
Fig. 7.
(A) Stress–strain curves of EA(1.68) swollen by DMSO to λ0 = 2.22 (blue line) in comparison with EA(2.18), a fully polymerized sample with a similar prestretching (red line). λ˙ = 0.021 s−1. (B) Stress–strain curves of EA(2.53) swollen by MPD to λ0 = 3.31 (blue line) in comparison with EA(3.27), a fully polymerized sample with a similar prestretching (red line). λ˙ = 0.021 s−1. (C) Evolution of the modulus as a function of λ0 for standard samples (red triangles) and for samples partially swollen in solvent (blue circles). (D) True stress at break as a function of λ0 for standard samples (red triangles) and for samples partially swollen in solvent (blue circles).

References

    1. Gent AN, editor. Engineering with Rubber. Vol 1 Hanser; Munich: 2001.
    1. Martinez RV, Glavan AC, Keplinger C, Oyetibo AI, Whitesides GM. Soft actuators and robots that are resistant to mechanical damage. Adv Funct Mater. 2014;24:3003–3010.
    1. Rogers JA, Someya T, Huang Y. Materials and mechanics for stretchable electronics. Science. 2010;327:1603–1607. - PubMed
    1. Lee KY, Mooney DJ. Hydrogels for tissue engineering. Chem Rev. 2001;101:1869–1879. - PubMed
    1. Minev IR, et al. Biomaterials. Electronic dura mater for long-term multimodal neural interfaces. Science. 2015;347:159–163. - PubMed

Publication types

LinkOut - more resources