. 2018 Nov 5;217(11):4025-4048.
doi: 10.1083/jcb.201807108. Epub 2018 Aug 28.

Mapping 3D genome organization relative to nuclear compartments using TSA-Seq as a cytological ruler

Affiliations

Mapping 3D genome organization relative to nuclear compartments using TSA-Seq as a cytological ruler

Yu Chen et al. J Cell Biol. .

Abstract

While nuclear compartmentalization is an essential feature of three-dimensional genome organization, no genomic method exists for measuring chromosome distances to defined nuclear structures. In this study, we describe TSA-Seq, a new mapping method capable of providing a "cytological ruler" for estimating mean chromosomal distances from nuclear speckles genome-wide and for predicting several Mbp chromosome trajectories between nuclear compartments without sophisticated computational modeling. Ensemble-averaged results in K562 cells reveal a clear nuclear lamina to speckle axis correlated with a striking spatial gradient in genome activity. This gradient represents a convolution of multiple spatially separated nuclear domains including two types of transcription "hot zones." Transcription hot zones protruding furthest into the nuclear interior and positioning deterministically very close to nuclear speckles have higher numbers of total genes, the most highly expressed genes, housekeeping genes, genes with low transcriptional pausing, and super-enhancers. Our results demonstrate the capability of TSA-Seq for genome-wide mapping of nuclear structure and suggest a new model for spatial organization of transcription and gene expression.


Figures

None
Graphical abstract
Figure 1.
Figure 1.
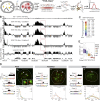
TSA generates biotin labeling, which decays exponentially from the staining target. (A) TSA: Primary and HRP-conjugated secondary antibodies (purple dots) target epitopes (gray dots). HRP catalyzes formation of tyramide-biotin free radicals (red), which diffuse and covalently link to nearby proteins (gray dots), DNA (gray lines), and RNA (brown lines). (B) Exponential fitting of spreading of TSA staining: condition 1 (top), condition 2 (middle), and condition 3 (bottom). Left: Biotin staining (red) of TSA staining of GFP-lac repressor (green) bound to BAC transgene array; white dashes encircle nuclei and red arrows mark GFP spot used for line scan. Middle: GFP spot (green) versus biotin intensities (red) along yellow line scan (left). Right: Exponential fit of biotin intensity versus distance from GFP spot. (C) Image (top) and intensities (bottom) along yellow line scan (top) of SON immunostaining (green), biotin staining after TSA (red), and DNA DAPI staining (blue). (D) Images of SON TSA staining conditions 1–3. Top: Biotin staining (red) merged with DAPI DNA staining (green). Bottom: TSA staining surface plots. Bars, 2 µm.
Figure 2.
Figure 2.
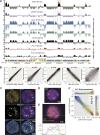
Genome-wide mapping chromosome organization relative to nuclear speckles using TSA-Seq. (A) Workflow schematic. (B) SON TSA-Seq genomic plots (human Chr11): no primary control (top), TSA staining conditions 1–3 (middle), and lamin B1 DamID (bottom). Red boxes indicate SON TSA-Seq peak-to-valley versus inter-LAD–LAD transitions. (C) Color-coding, TSA-Seq scores, and estimated speckle distances for 10 SON TSA-Seq deciles (TSA condition 2). (D) For each of the peak (probes A–C), transition (probes D and E), and valley (probes F–H) regions, SON TSA-Seq genomic plots flanking probe locations (red bars) are shown on left; histograms of probe distances to the nearest speckle (n = 100) are shown on right with representative 3D immuno-FISH images: SON (green), FISH (red), and nucleus (white lines). Bars, 1 µm. (E) Box plot of probe distances to nearest speckle (n = 100).
Figure 3.
Figure 3.
Deriving an accurate genome-wide mean distance map to nuclear speckles from the SON TSA-Seq score. (A) Exponential fit (red line) of SON TSA-Seq fold-enrichment (conditions 1–3) versus average speckle distances measured by FISH for eight probes (black squares). (B) Enrichment and distances measured for 10 additional FISH probes (open circles) map close to the fitted curve calculated using the original eight probes (shown for condition 1). (C) Top to bottom: Speckle distances (Chr11) calculated from the inverse of exponential fit (conditions 1–3) versus Repli-Seq DNA replication timing. (D) Histogram of genome-wide distance residuals between condition 1– and 2–calculated speckle distances.
Figure 4.
Figure 4.
Inverse correlation between SON and lamin B TSA-Seq scores as shown for all human chromosomes. (A) SON TSA-Seq (black) and lamin B TSA-Seq (blue) maps (staining condition 2); y axis shows log2 ratio of TSA-normalized versus input DNA–normalized reads in 20-kb bins. For comparison, Hi-C subcompartments (GM12878 cells) are shown between the SON and lamin B TSA-Seq plots (color code, bottom right). Plots are based on the hg19 assembly as visualized in the UCSC Genome Browser. Red boxes show examples of linear transitions connecting valleys (peaks) to peaks (valleys) in SON (lamin B) TSA-Seq maps. (B) SON TSA-Seq large peaks (red boxes), small peaks (orange boxes), and peaks within valleys (green boxes) correlate with lamin B TSA-Seq large valleys, shallow valleys, and dips between peaks, respectively. Top to bottom: K562 cell SON TSA-Seq, lamin B TSA-Seq, and lamin B1 DamID.
Figure 5.
Figure 5.
TSA-Seq versus light microscopy view of nuclear organization. (A) Top to bottom: TSA-Seq (Chr7) for SON, phosphorylated SC35, lamin B, lamin A/C, lamin B1 DamID, RNA Pol II-Ser5p TSA-Seq, Hi-C compartment eigenvector, and subcompartment assignment. Speckle TSA-Seq large peaks (red boxes), small peaks (orange boxes), and peaks within valleys (green boxes) align with lamin TSA-Seq deep valleys, shallow valleys, and dips between peaks, respectively. (B) 2D TSA-Seq percentile scatter plots for (left to right) same target SON but two TSA labeling conditions, SON versus pSC35, lamin A/C versus lamin B, lamin B versus SON, and RNA Pol II–Ser5p versus SON TSA (300-kb bins). (C) Top: 3D SIM of RNA Pol II–Ser5p (red) versus H3K27me2/3 (green; left) and RNA Pol II–Ser5p (red) relative to DAPI (blue; right). Middle: SON widefield image (left) superimposed on 3D SIM RNA Pol II–Ser5p (red) and DAPI (blue) images (right). Bottom: 3D SIM DAPI (blue) versus H3K27me3 (green; left) and both DAPI and H3K27me3 superimposed on a widefield SON image (white; right). Arrowheads point to nuclear speckles surrounded by RNA Pol II–Ser5p foci. (D) 5-Ethynyl uridine 5-min pulse label showing nascent RNA (red) versus DNA (DAPI) staining and SON immunofluorescence (green). (E) Image (top) and aligned intensities (bottom) along line scan (yellow; top) of RNA Pol II–Ser5p immunostaining (green), TSA staining (red), and DAPI (blue). RNA Pol II–Ser5p TSA signal (red) is high over nuclear interior but lower near nuclear periphery (and nucleoli). (F) 2D lamin B–SON TSA-Seq scatter plots showing distribution of Hi-C subcompartments (320-kb bin size).
Figure 6.
Figure 6.
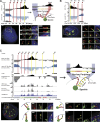
TSA-Seq predicts chromosome trajectories between the nuclear periphery and speckle. (A) Immuno-FISH against a 4-Mbp trajectory connecting SON TSA-Seq valley and peak. Top left: SON and lamin B TSA-Seq genomic plot and FISH probe locations. Top right: Schematic of TSA-Seq signal versus chromosome trajectory. Bottom: Probes 1–4 (red) and probe 5 (yellow) FISH and DAPI (blue). Bottom left: Boxed region over FISH nuclear signal. Bottom middle: Trajectory viewed in different channels and merged image (top); three additional examples (bottom). Bottom right: Fifth example. (B) Immuno-FISH against 3 Mbp trajectory connecting SON TSA-Seq peak and valley. Top: TSA-Seq genomic plots and FISH probe locations. Bottom left: Probe 9 (yellow) and probes 10–12 (red) FISH and lamin B (blue). Boxed region over FISH nuclear signal. Bottom right: Boxed region viewed in different channels (top) plus three additional examples (bottom). (C) Immuno-FISH against ∼11 Mbp trajectory from SON TSA-Seq valley to peak to valley. Top left (top to bottom): Probe locations and SON TSA-Seq, lamin B TSA-Seq, smoothed, normalized RNA Pol II ChIP-Seq, RNA-Seq, GRO-Seq (20-kb bins), H3K36me3 ChIP, and Hi-C subcompartments. Right: Schematic of TSA-Seq signal versus chromosome trajectory. Bottom: Probes 1–4 (red) and probes 5–8 (yellow) FISH over lamin B (blue) staining. Bottom left: Boxed region over FISH nuclear signal. Bottom middle and right: different channels (top and middle) plus three additional examples. Bars, 1 µm.
Figure 7.
Figure 7.
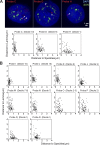
Single-cell analysis reveals that genomic regions positioned deterministically near nuclear speckles or lamina show stochastic positioning relative to the other compartment. (A and B) Although 2D lamin-SON TSA scatter plots show a tight inverse correlation, 3D immuno-FISH reveals that in single cells, cytological distances of a given locus from the nuclear speckle or lamina are not tightly correlated. (A) Top: DNA FISH probe location (red; arrowheads) relative to nuclear speckles (green) and nuclear DNA staining (blue, DAPI). Probes C (left; decile 10), D (middle; decile 9), and H (right; decile 1; probes same as in Figs. 2, 6, and S2) are from a SON TSA-Seq peak, transition zone, and valley (overlapping with a LAD), respectively; deciles refer to SON TSA-Seq. Bottom: 2D scatter plots showing shortest distances in micrometers from both the nearest nuclear speckle (x axis) and nuclear periphery (y axis) for probes C, D, and H measured for 100 alleles. Probe C shows a very tight distribution of distances (∼0–0.5 µm) close to the nuclear speckle but a broad distribution of distances to the periphery. Instead, Probe H shows a relatively tight distribution of distances for most alleles from the nuclear periphery (∼0–0.8 µm) but a broad distribution of distances to nuclear speckles. Probe D shows distance distributions with an intermediate degree of scatter relative to both nuclear speckle and periphery. (B) 10 additional 2D scatter plots for probes I to R (probes same as in Figs. 2, 6, and S2).
Figure 8.
Figure 8.
Gradients in transcription-related marks, gene expression, and DNA replication timing along the speckle–lamin TSA-Seq axis reflect ensemble averaging over cells and chromosome regions. (A–D) Gene expression and chromatin marks as functions of SON TSA-seq deciles. (A) H3K9me3, H3K27me3, and LAD fractions. (B) H3K4me3 (peaks), H3K9ac, and CTCF (peaks). (C) Protein-coding gene expression (FPKM; left), gene density (middle), and percentage of top 5% active genes (right). Box plot (left) shows median (black line), mean (red diamond), 75% (box top), whiskers equal to 1.5× box size, and outliers (black dots). (D) Super-enhancers versus enhancers (percentage). (E and F) Lamin B versus SON TSA-Seq percentile 2D scatterplots (projections at top and right). (E) Expressed (red) versus nonexpressed (green) protein-coding genes. (F) Top 5% expressed genes (blue) versus remaining expressed protein-coding genes (gray). Top 5% expressed genes furthest from nuclear lamina (right; red box) show disproportionate skewing toward speckles (>95% SON TSA-Seq percentile; dashed line). (G) DNA replication timing (160-kb bin size): earliest to latest (red to blue). Red ellipse indicates slight skewing of early replicating regions toward higher SON TSA versus lower lamin B TSA percentiles. (H) Distributions of A1 (left), A2 (middle), and A1 plus A2 (right) active Hi-C subcompartments as a function of SON TSA-Seq deciles.
Figure 9.
Figure 9.
Two types of transcription hot zones align with SON TSA-Seq local maxima. (A) Peaks of approximate Mbp transcription hot zones marked by smoothed RNA Pol II ChIP-Seq maxima align with SON TSA-Seq maxima (red tick marks). Top to bottom (Chr2): SON TSA-Seq, Hi-C subcompartments, smoothed, normalized RNA Pol II ChIP-Seq, GRO-Seq (20-kb bins), RNA-Seq, H3K36me3, RNA Pol II–Ser5p TSA-Seq, Hi-C eigenvector (compartment), Repli-Seq, LADs, and RefSeq gene annotations. Arrows showing SON TSA-Seq local maxima align with type I (red) versus type II (yellow) transcription hot zones. (B) Bimodal distribution of SON TSA-Seq local maxima number (y axis) color coded by A1 (dark green) versus A2 (light green) Hi-C subcompartment identity versus SON TSA-Seq percentile (x axis). (C) Box plots of genomic distances between SON TSA-Seq local maxima and nearest LAD/inter-LAD boundary for A1 (red) versus A2 (blue) SON TSA-Seq peaks. (D) Two types of transcription hot zones: Type I, whose apexes map adjacent to nuclear speckles, and type II, whose apexes map to intermediate distances from nuclear speckles.
Figure 10.
Figure 10.
Differences between type I and II transcription hot zones and a refined model for nuclear organization. (A) Left to right: Density (y axis; gene number) of total genes, top 10% expressed genes, genes with 40–60% expression levels, and genes with 10% lowest expression as function of genomic distance (x axis; kb) from centers of type I (red) versus type II (blue) transcription hot zones. (B) Pausing index distribution for expressed genes within ±100 kb of SON TSA-Seq local maxima contained within type I (A1 peaks) versus type II (A2 peaks) hot zones. (C) Percentage (y axis) of housekeeping versus nonhousekeeping genes versus SON TSA-Seq deciles for all genes (left), genes only in A1 subcompartment regions near speckles (middle), or only in A2 subcompartment regions (right). (D) Previous model: Transcriptional activity increases radially from low near the nuclear periphery to high toward the nuclear center. (E) New, refined model: Transcriptionally active chromosome regions are depleted from heterochromatic compartments close to the nuclear and nucleolar periphery (black). Apexes of chromosome trajectories protruding into the nuclear interior correspond with centers of transcription hot zones, which localize either at the periphery (red rings) of nuclear speckles (gray; type I) or at interior sites at intermediate distances from speckles, possibly near unknown compartments such as transcription factories (type II). A second repressive compartment enriched in H3K27me3 (green dots) maps throughout the nuclear interior, dispersed between RNA Pol II–Ser5p foci and speckles. Large-scale chromatin fibers (gray curves) traverse between these compartments.

References

    1. Agard D.A., Hiraoka Y., Shaw P., and Sedat J.W.. 1989. Fluorescence microscopy in three dimensions. Methods Cell Biol. 30:353–377. 10.1016/S0091-679X(08)60986-3 - DOI - PubMed
    1. Belmont A.S., and Bruce K.. 1994. Visualization of G1 chromosomes: a folded, twisted, supercoiled chromonema model of interphase chromatid structure. J. Cell Biol. 127:287–302. 10.1083/jcb.127.2.287 - DOI - PMC - PubMed
    1. Bickmore W.A. 2013. The spatial organization of the human genome. Annu. Rev. Genomics Hum. Genet. 14:67–84. 10.1146/annurev-genom-091212-153515 - DOI - PubMed
    1. Bobrow M.N., Harris T.D., Shaughnessy K.J., and Litt G.J.. 1989. Catalyzed reporter deposition, a novel method of signal amplification. Application to immunoassays. J. Immunol. Methods. 125:279–285. 10.1016/0022-1759(89)90104-X - DOI - PubMed
    1. Bobrow M.N., Shaughnessy K.J., and Litt G.J.. 1991. Catalyzed reporter deposition, a novel method of signal amplification. II. Application to membrane immunoassays. J. Immunol. Methods. 137:103–112. 10.1016/0022-1759(91)90399-Z - DOI - PubMed

Publication types