. 2018 Oct 1;215(10):2520-2535.
doi: 10.1084/jem.20180684. Epub 2018 Aug 28.

High-dimensional single cell analysis identifies stem-like cytotoxic CD8+ T cells infiltrating human tumors

Affiliations

High-dimensional single cell analysis identifies stem-like cytotoxic CD8+ T cells infiltrating human tumors

Jolanda Brummelman et al. J Exp Med. .

Abstract

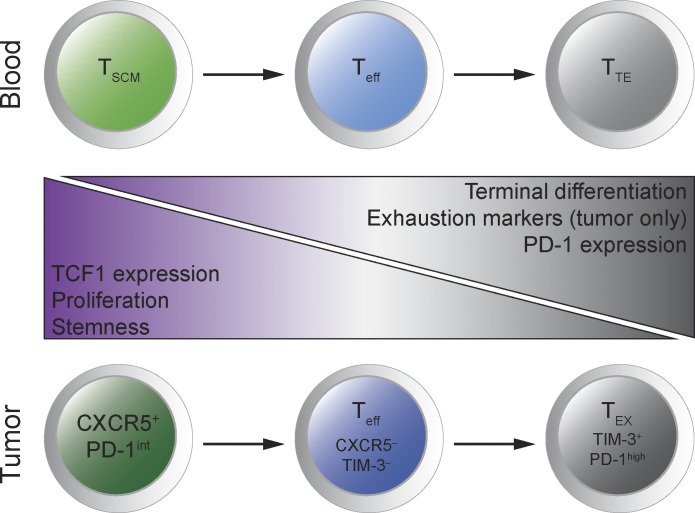
CD8+ T cells infiltrating tumors are largely dysfunctional, but whether a subset maintains superior functionality remains ill defined. By high-dimensional single cell analysis of millions of CD8+ T cells from 53 individuals with lung cancer, we defined those subsets that are enriched in tumors compared with cancer-free tissues and blood. Besides exhausted and activated cells, we identified CXCR5+ TIM-3- CD8+ T cells with a partial exhausted phenotype, while retaining gene networks responsible for stem-like plasticity and cytotoxicity, as revealed by single cell sequencing of the whole transcriptome. Ex vivo, CXCR5+ TIM-3- CD8+ T cells displayed enhanced self-renewal and multipotency compared with more differentiated subsets and were largely polyfunctional. Analysis of inhibitory and costimulatory receptors revealed PD-1, TIGIT, and CD27 as possible targets of immunotherapy. We thus demonstrate a hierarchy of differentiation in the context of T cell exhaustion in human cancer similar to that of chronically infected mice, which is further shown to disappear with disease progression.


Figures

None
Graphical abstract
Figure 1.
Figure 1.
High-dimensional single cell analysis of tumor-infiltrating CD8+ T cells in NSCLC identifies tumor-enriched immunophenotypes. (A) Illustration depicting the experimental workflow. Analysis is performed on peripheral blood (n = 22), normal lung tissue (n = 45), and tumor (n = 53) from NSCLC patients. Data were obtained in six independent experiments. (B) tSNE analysis of concatenated CD8+ T cells (3,000 cells/sample) from peripheral blood (n = 22), normal lung tissue (n = 45), and tumor (n = 53) samples from NSCLC patients (top panel) and color-coded tSNE map depicting clusters identified by Phenograph (bottom panel). (C) Hierarchical metaclustering (using Ward’s method) of the frequencies of the 24 Phenograph clusters in single blood (gray; n = 22), normal tissue (orange; n = 45), and tumor (purple; n = 53) samples. (D) Heat map showing the iMFI of specific markers in discrete Phenograph clusters identified in B. Phenograph clusters (rows) and markers (columns) are hierarchically metaclustered using Ward’s method to group subpopulations with similar immunophenotypes. The median frequency of each Phenograph cluster within the blood (n = 22), normal lung tissue (n = 45), and tumor (n = 53) samples are depicted by balloon plots. *, P < 0.05; **, P < 0.01; ***, P < 0.001; ****, P < 0.0001 tumor versus blood and normal tissue samples; two-way ANOVA with Bonferroni post-hoc test.
Figure 2.
Figure 2.
NSCLC tumors are enriched in CXCR5+ CD8+ T cells. (A) Representative dot plots showing manual gating analysis of CXCR5+ TIM-3, CXCR5 TIM-3, and CXCR5 TIM-3+ CD8+ T cells from a blood, normal lung tissue, and tumor sample. Numbers in the dot plots indicate the percentage of cells identified by the gates. (B) Summary of the frequency of CXCR5+ TIM-3 of CD8+ T cells from blood (n = 22), normal lung tissue (n = 45), and tumor (n = 53) samples as determined in A. Data were obtained in six independent experiments. (C) Representative dot plots showing CD69 expression by the CXCR5+ TIM-3 CD8+ T cells from a blood, normal lung tissue, and tumor sample. Numbers in the dot plots indicate the percentage of cells identified by the gates. (D–F) Summary of the frequency of CD69+ within CXCR5+ TIM-3 cells (D) and CD69+ CXCR5+ TIM-3 (E) and CD69 CXCR5+ TIM-3 within CD8+ T cells (F) from blood (n = 22), normal lung tissue (n = 45), and tumor (n = 53) samples, as determined in C. Data were obtained in six independent experiments. **, P < 0.01; ****, P < 0.0001; paired Wilcoxon t test. (G and H) Frequency of CXCR5+ TIM-3 (G) and CD69+ expression in CXCR5+ TIM-3 (H) CD8+ T cells in primary CRC (1°CRC; n = 6) and colorectal liver metastasis (Liver met; n = 7). Data are obtained in one experiment and are shown as mean ± SEM. (I) Pearson correlation between the frequency of Phenograph cluster 17 (CD69+ CXCR5+) with cluster 7 (HLA-DR+ CD98hi activated cells), cluster 9 (Ki-67+, proliferating cells), and cluster 13 (exhausted cells). P values are shown in each panel. (J) Representative dot plots showing Ki-67 expression by the indicated CD8+ T cell subsets from a tumor sample. Numbers in the dot plots indicate the percentage of cells identified by the gates. (K) Summary of the frequency of Ki-67+ cells within the indicated CD8+ T cell subsets from all tumor samples (n = 53), as determined in J. ****, P < 0.0001; paired Wilcoxon t test. Data were obtained in six independent experiments.
Figure 3.
Figure 3.
Single cell transcriptomics defines the early differentiated memory identity and cytotoxic potential of CXCR5+ CD8+ T cells. (A) Pearson correlation analysis of CXCR5 profile-correlated genes in the public available scRNA-seq dataset from metastatic melanoma-infiltrating CD8+ T cells (n = 912) from Tirosh et al. (2016). (B) Heat map depicting the Z score of expression values of genes that characterize melanoma-infiltrating CXCR5+ (n = 58), CXCR5 TIM-3 (n = 278), and CXCR5 TIM-3+ (n = 297) CD8+ T cells from the same dataset as in A. (C) Violin plots showing expression probability distributions of indicated genes within the infiltrating CXCR5+ (n = 58), CXCR5 TIM-3 (n = 278), and CXCR5 TIM-3+ (n = 297) CD8+ T cells, as defined in B. *, P < 0.05; Wilcoxon rank sum test. (D) GSEA of the infiltrating CXCR5+ versus CXCR5 TIM-3+ CD8+ T cells for the indicated gene sets. ES, enrichment score; NES, normalized enrichment score; FDR, false discovery rate. (E) Representative histograms depicting expression of different markers on tumor-infiltrating CXCR5+ TIM-3, CXCR5 TIM-3, and CXCR5 TIM-3+ CD8+ T cells as determined by flow cytometry. (F) Summary of the results shown in C. All MFIs refer to marker expression in bulk populations identified by CXCR5 and TIM3 expression, except for PD-1, where MFI refers to the PD-1+ fraction. All graphs show measurements from 53 donors obtained in six independent experiments, except for TCF-1 (n = 16; four independent experiments) and CD28 (n = 13; three independent experiments). *, P < 0.05; ***, P < 0.001; ****, P < 0.0001; paired Wilcoxon t test.
Figure 4.
Figure 4.
CXCR5+ TIM-3 CD8+ T cells are efficient in rapidly producing effector molecules. (A–D) Sorted CXCR5+ TIM-3, CXCR5 TIM-3, and CXCR5 TIM-3+ CD8+ TILs were stimulated for 3 h with PMA/ionomycin, and CD107a expression and cytokine production was determined by flow cytometry (n = 7; all performed in independent experiments). (A) Representative dot plots showing the analysis of IL-2, TNF, and IFNγ production by NSCLC tumor-infiltrating CXCR5+ TIM-3, CXCR5 TIM-3, and CXCR5 TIM-3+ CD8+ T cells following short-term PMA/ionomycin stimulation. Numbers in the dot plots indicate the percentage of cells identified by the gates. (B) Representative histograms showing the expression of CD107a by the indicated subsets after short-term PMA/ionomycin stimulation. Numbers in the histograms indicate the percentage of cells identified by the gates. (C) Pie charts representing the proportion of CXCR5+ TIM-3, CXCR5 TIM-3, and CXCR5 TIM-3+ CD8+ TILs expressing and producing different combinations of CD107a, IL-2, IFNγ, and TNF after PMA/ionomycin stimulation (n = 7). Frequencies were corrected by background subtraction as determined in unstimulated controls. **, P < 0.01; ***, P < 0.001; partial permutation tests, using SPICE software. (D) Frequency of CXCR5+ TIM-3, CXCR5 TIM-3, and CXCR5 TIM-3+ CD8+ TILs expressing and producing different combinations of CD107a, IL-2, IFNγ, and TNF after PMA/ionomycin stimulation (n = 7). Data are given as mean ± SEM. *, P < 0.05 versus CXCR5+ TIM-3 CD8+ TILs; +, P < 0.05 versus CXCR5 TIM-3 CD8+ TILs, paired Wilcoxon t test.
Figure 5.
Figure 5.
Tumor-infiltrating CXCR5+ CD8+ T cells are endowed with enhanced stemness. (A) Representative dot plots depicting the purity of sorted CXCR5+ TIM-3, CXCR5 TIM-3, and CXCR5 TIM-3+ CD8+ T cells from a NSCLC tumor sample. Numbers in the dot plots indicate the percentage of cells identified by the gates. (B–L) Sorted CFSE-stained CXCR5+ TIM-3, CXCR5 TIM-3, and CXCR5 TIM-3+ CD8+ T cells were stimulated with αCD3/CD28 beads in combination with IL-2 and IL-15 (10 ng/ml, each) for 6 d (n = 9; all performed in independent experiments) to determine effector differentiation or with IL-15 (50 ng/ml) for 11 d (n = 7; performed in six independent experiments) to determine their self-renewal capacity. As a non-proliferating negative control, cells were kept in 1 ng/ml IL-15. (B and C) Representative histograms showing CFSE dilution in sorted subsets after αCD3/CD28 + IL-2/IL-15 (B) or IL-15 (C) stimulation. (D) Summary of the proliferation index, calculated as MFI non-proliferating fraction / MFI proliferating fraction × % cells with diluted CFSE, after αCD3/CD28 + IL-2/IL-15 (n = 9) or IL-15 (n = 7) stimulation normalized for the value obtained for the CXCR5+ TIM-3 subset. Data are given as mean ± SEM; **, P < 0.01; paired Wilcoxon t test. (E and F) Representative dot plots depicting the expression of CXCR5 and TIM-3 by the proliferated cells of the different sorted subsets after αCD3/CD28 + IL-2/IL-15 (E) or IL-15 (F) stimulation. Numbers in the dot plots indicate the percentage of cells identified by the gates. (G) TIM-3 MFI of the proliferating cells (CFSE diluted) of the different sorted subsets after αCD3/CD28 + IL-2/IL-15 stimulation (n = 9). Data are given as mean ± SEM; paired Wilcoxon t test. (H and I) Percentage of CFSE diluted cells with a given phenotype following stimulation with αCD3/CD28 + IL-2/IL-15 (H; n = 9) or IL-15 (I; n = 7). Data are given as mean ± SEM. Horizontal bars indicate significant comparisons. Bar colors refer to progenies with specific phenotypes as indicated in the legend. Paired Wilcoxon t test. (J) Representative dot plots showing CD45RA expression and CFSE dilution by IL-15–stimulated cells. Numbers in the dot plots indicate the percentage of cells identified by the gates. (K and L) Heat maps showing the median frequency of the indicated markers by the different αCD3/CD28 + IL-2/IL-15 (K; n = 9) or IL-15 (L; n = 7) stimulated CD8+ T subsets. NP, non-proliferating cells from the negative control; P, proliferating cells (CFSE diluted) after stimulation. Comparisons that are statistically significant are indicated in Fig. S4. *, P < 0.05.
Figure 6.
Figure 6.
Loss of CXCR5+ CD8+ TILs with lung cancer disease progression. (A) SUVmax values among NSCLC patients with pStage I (n = 24), II (n = 15), or III (n = 15); *, P < 0.05; **, P < 0.01; Mann-Whitney t test. (B) Based on the SUVmax values, samples were divided into SUVmax low and high with the median SUVmax value as cut-off. Frequency of Phenograph cluster 17 (CD69+CXCR5+) is depicted in the SUVmax low (n = 17) and high (n = 16) groups. *, P < 0.05; Mann-Whitney t test. (C) Frequency of Phenograph cluster 17 (CD69+CXCR5+) in tumor samples from patients with NSCLC pStage I (n = 19) versus II-IVA (n = 34). *, P < 0.05; Mann-Whitney t test. Data were obtained in six independent experiments. *, P < 0.05; **, P < 0.01; Mann-Whitney t test.

References

    1. Ahrends T., Bąbała N., Xiao Y., Yagita H., van Eenennaam H., and Borst J.. 2016. CD27 Agonism Plus PD-1 Blockade Recapitulates CD4+ T-cell Help in Therapeutic Anticancer Vaccination. Cancer Res. 76:2921–2931. 10.1158/0008-5472.CAN-15-3130 - DOI - PubMed
    1. Akondy R.S., Fitch M., Edupuganti S., Yang S., Kissick H.T., Li K.W., Youngblood B.A., Abdelsamed H.A., McGuire D.J., Cohen K.W., et al. . 2017. Origin and differentiation of human memory CD8 T cells after vaccination. Nature. 552:362–367. 10.1038/nature24633 - DOI - PMC - PubMed
    1. Amir E.-A.D., Davis K.L., Tadmor M.D., Simonds E.F., Levine J.H., Bendall S.C., Shenfeld D.K., Krishnaswamy S., Nolan G.P., and Pe’er D.. 2013. viSNE enables visualization of high dimensional single-cell data and reveals phenotypic heterogeneity of leukemia. Nat. Biotechnol. 31:545–552. 10.1038/nbt.2594 - DOI - PMC - PubMed
    1. Bindea G., Mlecnik B., Tosolini M., Kirilovsky A., Waldner M., Obenauf A.C., Angell H., Fredriksen T., Lafontaine L., Berger A., et al. . 2013. Spatiotemporal dynamics of intratumoral immune cells reveal the immune landscape in human cancer. Immunity. 39:782–795. 10.1016/j.immuni.2013.10.003 - DOI - PubMed
    1. Chapuis A.G., Ragnarsson G.B., Nguyen H.N., Chaney C.N., Pufnock J.S., Schmitt T.M., Duerkopp N., Roberts I.M., Pogosov G.L., Ho W.Y., et al. . 2013. Transferred WT1-reactive CD8+ T cells can mediate antileukemic activity and persist in post-transplant patients. Sci. Transl. Med. 5:174ra27 10.1126/scitranslmed.3004916 - DOI - PMC - PubMed

Publication types

Substances