. 2018 Aug 28;9(1):3487.
doi: 10.1038/s41467-018-05953-4.

Megahertz data collection from protein microcrystals at an X-ray free-electron laser

Affiliations

Megahertz data collection from protein microcrystals at an X-ray free-electron laser

Marie Luise Grünbein et al. Nat Commun. .

Abstract

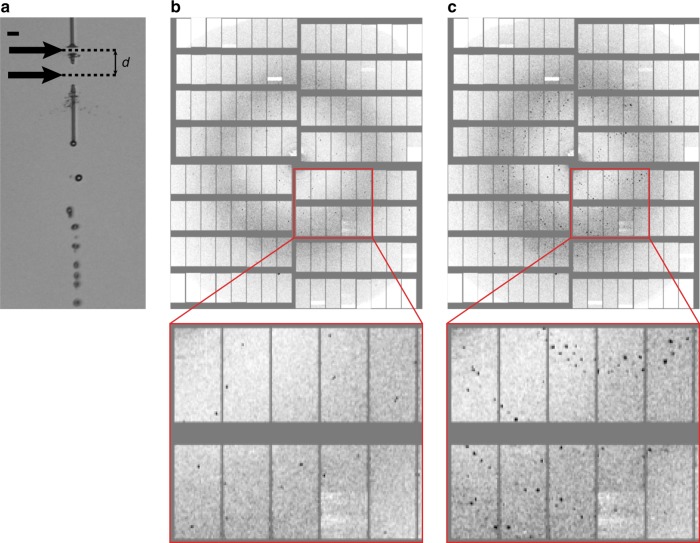
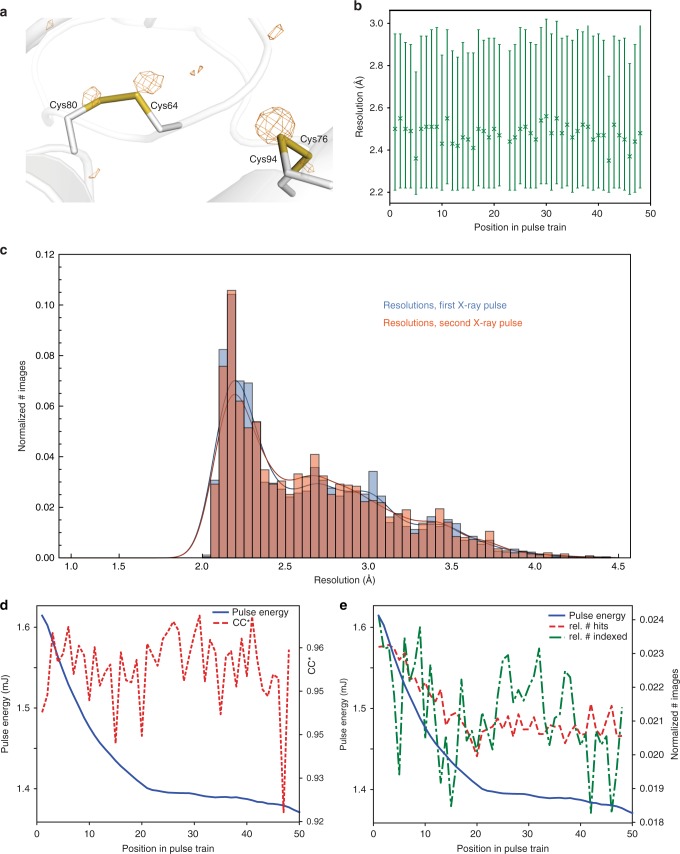
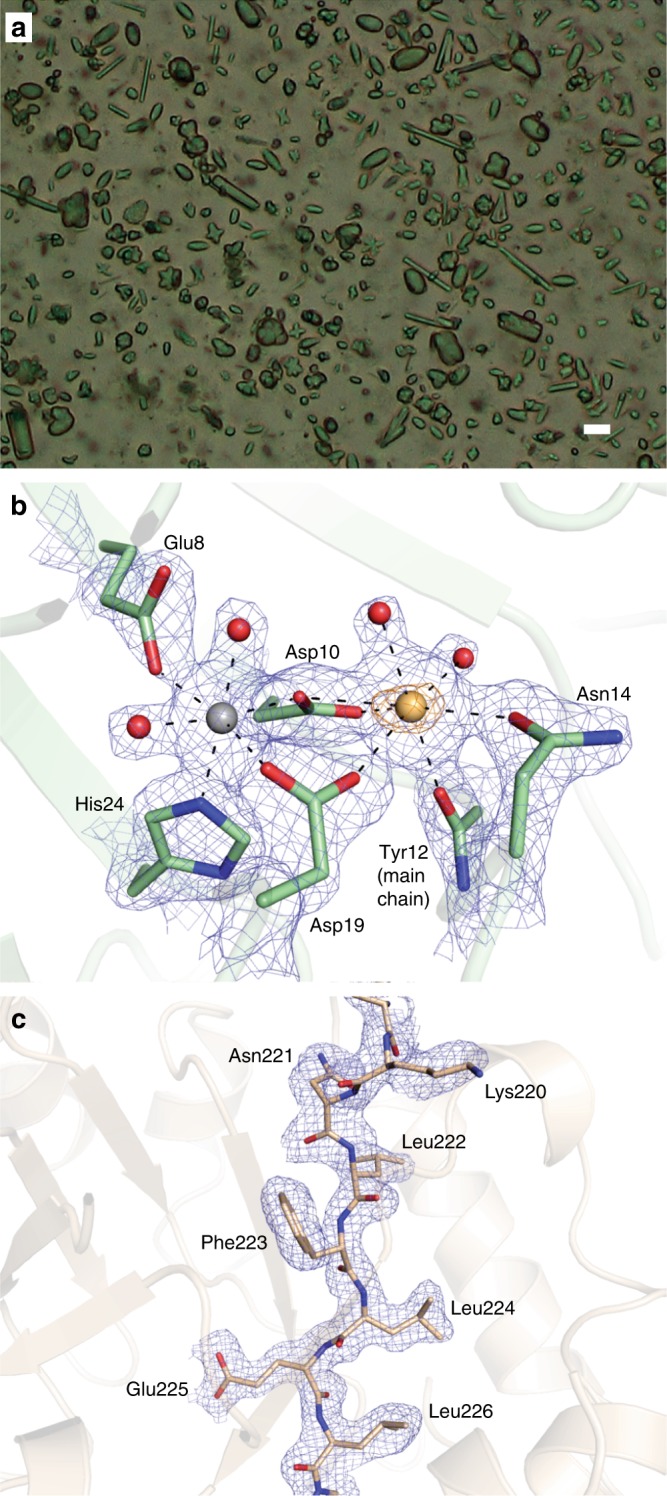
X-ray free-electron lasers (XFELs) enable novel experiments because of their high peak brilliance and femtosecond pulse duration. However, non-superconducting XFELs offer repetition rates of only 10-120 Hz, placing significant demands on beam time and sample consumption. We describe serial femtosecond crystallography experiments performed at the European XFEL, the first MHz repetition rate XFEL, delivering 1.128 MHz X-ray pulse trains at 10 Hz. Given the short spacing between pulses, damage caused by shock waves launched by one XFEL pulse on sample probed by subsequent pulses is a concern. To investigate this issue, we collected data from lysozyme microcrystals, exposed to a ~15 μm XFEL beam. Under these conditions, data quality is independent of whether the first or subsequent pulses of the train were used for data collection. We also analyzed a mixture of microcrystals of jack bean proteins, from which the structure of native, magnesium-containing concanavalin A was determined.


Conflict of interest statement

The authors declare no competing interests.

Figures

Fig. 1
Fig. 1
Consecutive X-ray exposures. a Liquid microjet (lysozyme microcrystals in mother liquor, ~4 µm jet diameter) after being hit by the first two consecutive X-ray pulses of a pulse train separated by 886 ns, as viewed by the off-axis camera using fs laser illumination shortly after the second X-ray pulse. Flow direction is pointing down in the image. Each X-ray pulse leads to an explosion in the jet, opening up a gap (black arrows). The jet is sufficiently fast (~45 m s1) to close the gap created by the first pulse (lower gap) in time for the second pulse to hit the jet (upper gap). The distance d between both gap centers is ~40 µm. The scale bar is 20 µm. b, c Diffraction patterns of lysozyme microcrystals recorded with the first (b) and second (c) X-ray pulse of the same pulse train (886 ns time delay between pulses) showing that the two pulses probed different crystals. ac All data were recorded from the same sample suspension, using the same nozzle and flow parameters
Fig. 2
Fig. 2
Quality of lysozyme control data collected at 7.47 keV photon energy. a Anomalous difference density map contoured at 3.0 σ, calculated using data to 2.2 Å resolution from 87,000 images. The main peaks are associated with the sulfur atoms (shown: two disulfide bridges). b Diffraction resolution as a function of the position in the pulse train. Symbols show the median resolution of all indexed images. The error bars indicate the 0.25 and 0.75 quantiles. c Histograms of the resolutions of lysozyme microcrystals of the 7.47 keV dataset for the first (blue, 2109 indexed images) and second (red, 1924 indexed images) pulses in the pulse trains. d CC* of partial datasets (red line) and pulse energy (blue line) as a function of the position in the pulse train. e Hit- and indexing rate (red and green lines, as the normalized number of images) as well as pulse energy (blue line) as a function of the position in the pulse train. The total number of hits and indexed images was 421,705 and 106,661, respectively
Fig. 3
Fig. 3
MHz serial femtosecond crystallography of jack bean proteins. a Microscope image of the microcrystalline mixture of jack bean proteins that was injected into the X-ray beam, clearly showing different types of crystal forms. The scale bar is 10 µm. b Map quality for the concanavalin A structure. The metal binding site is shown, with the simulated annealing composite omit map contoured at 1.0σ shown as a blue mesh and the anomalous difference density map (5.0σ) shown as an orange mesh. Selected residues are shown as sticks, the calcium and magnesium ions as yellow and grey spheres, respectively. Water molecules are shown as red spheres. c Map quality for the concanavalin B structure. Part of one of the β-strands of the TIM-barrel is shown as sticks, with the simulated annealing composite omit map (1.0σ) shown as a blue mesh

References

    1. Barends TRM, et al. Direct observation of ultrafast collective motions in co myoglobin upon ligand dissociation. Science. 2015;350:445–450. doi: 10.1126/science.aac5492. - DOI - PubMed
    1. Pande K, et al. Femtosecond structural dynamics drives the trans/cis isomerization in photoactive yellow protein. Science. 2016;352:725–729. doi: 10.1126/science.aad5081. - DOI - PMC - PubMed
    1. Coquelle N, et al. Chromophore twisting in the excited state of a photoswitchable fluorescent protein captured by time-resolved serial femtosecond crystallography. Nat. Chem. 2018;10:31–37. doi: 10.1038/nchem.2853. - DOI - PubMed
    1. Kern J, et al. Simultaneous femtosecond X-ray spectroscopy and diffraction of photosystem II at room temperature. Science. 2013;340:491–495. doi: 10.1126/science.1234273. - DOI - PMC - PubMed
    1. Suga M, et al. Native structure of photosystem II at 1.95 angstrom resolution viewed by femtosecond X-ray pulses. Nature. 2015;517:99–103. doi: 10.1038/nature13991. - DOI - PubMed

Publication types

LinkOut - more resources