. 2018 Aug 28;8(1):12982.
doi: 10.1038/s41598-018-31388-4.

Use of sucrose to diminish pore formation in freeze-dried heart valves

Affiliations

Use of sucrose to diminish pore formation in freeze-dried heart valves

Andrés Vásquez-Rivera et al. Sci Rep. .

Abstract

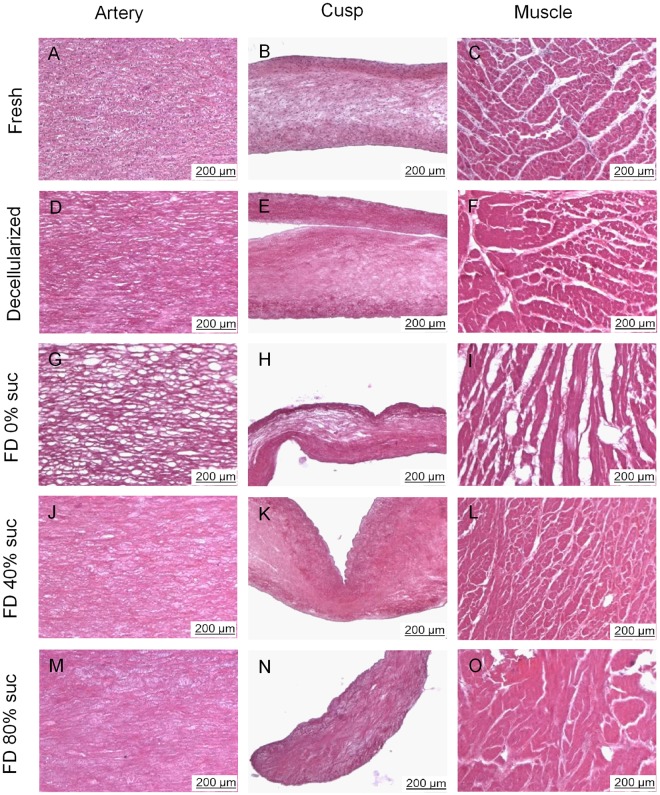
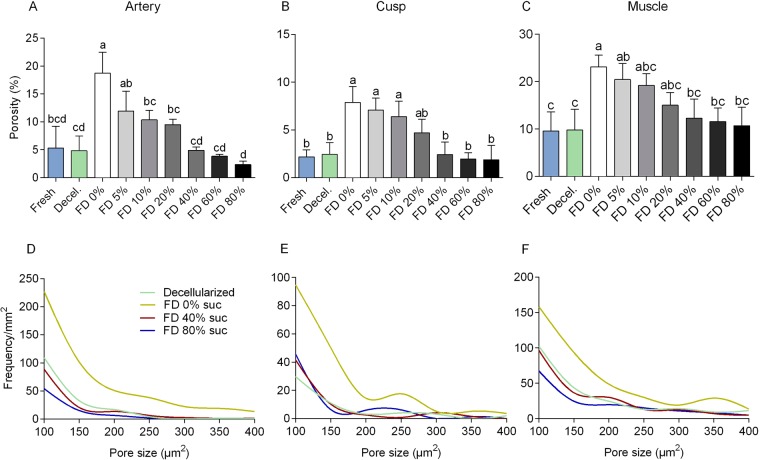
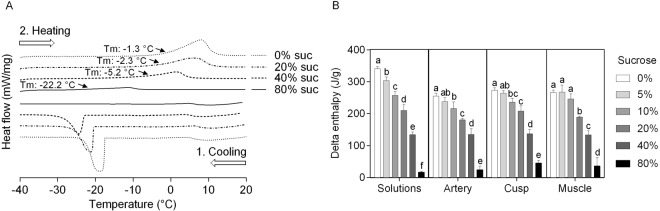
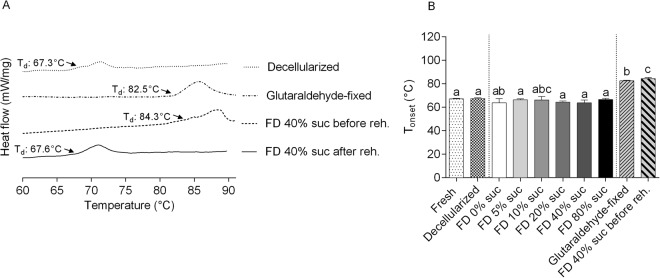
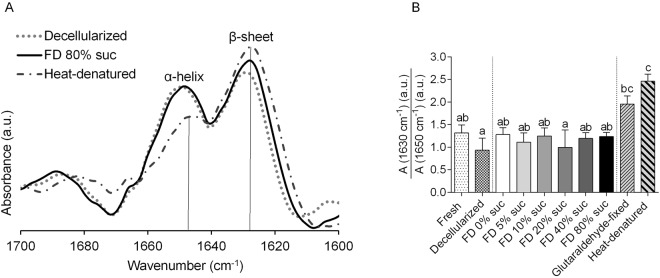
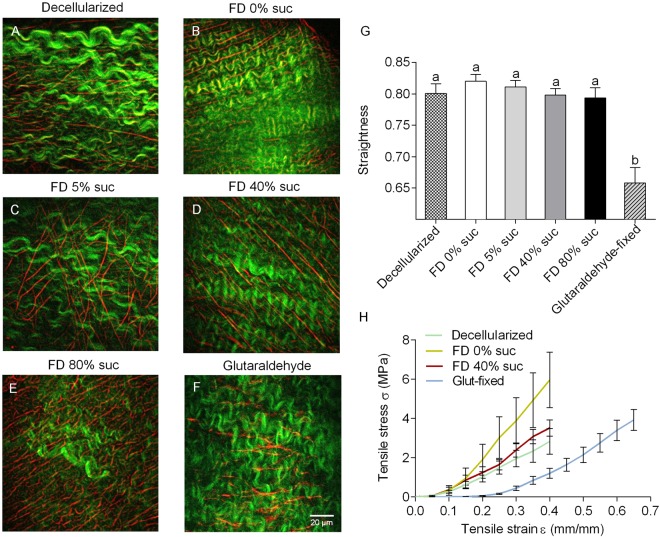
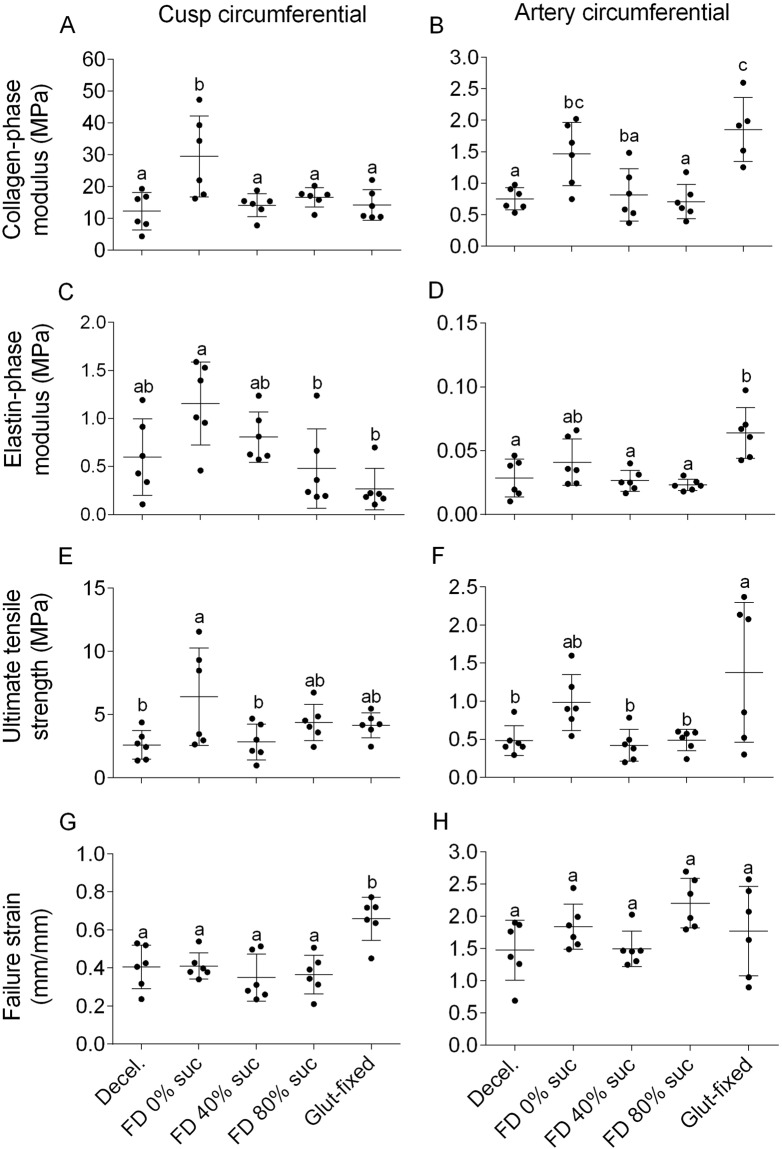
Freeze-dried storage of decellularized heart valves provides easy storage and transport for clinical use. Freeze-drying without protectants, however, results in a disrupted histoarchitecture after rehydration. In this study, heart valves were incubated in solutions of various sucrose concentrations and subsequently freeze-dried. Porosity of rehydrated valves was determined from histological images. In the absence of sucrose, freeze-dried valves were shown to have pores after rehydration in the cusp, artery and muscle sections. Use of sucrose reduced pore formation in a dose-dependent manner, and pretreatment of the valves in a 40% (w/v) sucrose solution prior to freeze-drying was found to be sufficient to completely diminish pore formation. The presence of pores in freeze-dried valves was found to coincide with altered biomechanical characteristics, whereas biomechanical parameters of valves freeze-dried with enough sucrose were not significantly different from those of valves not exposed to freeze-drying. Multiphoton imaging, Fourier transform infrared spectroscopy, and differential scanning calorimetry studies revealed that matrix proteins (i.e. collagen and elastin) were not affected by freeze-drying.


Conflict of interest statement

The authors declare no competing interests.

Figures

Figure 1
Figure 1
Micrographs of histological sections prepared from pulmonary heart valve tissues, before as well as after decellularization and freeze-drying. Hematoxylin and eosin staining was used to visualize structures in sections of pulmonary artery wall (A,D,G,J,M), valve cusp (B,E,H,K,N) and muscle tissue (C,F,I,L,O). Micrographs are presented of sections from fresh (A–C) and decellularized tissue (D–F), as well as rehydrated decellularized tissue subjected to freeze drying without protectant (G–I), or freeze-dried with 40% sucrose (J–L) or 80% sucrose (M–O).
Figure 2
Figure 2
Porosity assessment of pulmonary heart valve tissues, before as well as after decellularization and freeze-drying. Quantification of porosity and pore size distribution via image analysis of micrographs sections of pulmonary artery wall (A,D), valve cusp (B,E) and muscle tissue (C,F). Relative (i.e. percentage) ‘empty’ tissue areas were determined as a measure for porosity (A–C). Mean ± standard deviations were calculated from three different specimens, and different letters represent significant differences between groups (p ≤ 0.05). Pore size was measured and its frequency was plotted for decellularized tissue (green line) as well as decellularized tissues freeze-dried without protectants (yellow line) or supplemented with 40% sucrose (red line) or 80% sucrose (blue line).
Figure 3
Figure 3
Ice crystal formation in pulmonary heart valve tissues as assessed using DSC. Panel (A) shows thermograms of decellularized cusps without protectant or supplemented with sucrose (0%: dotted line, 20%: dashed/dotted line, 40%: dashed line 80%: solid line). Ice formation and melting are evident as exothermic and endothermic peaks during cooling (1), and warming (2), respectively. The specific enthalpy of ice melting (ΔH) was determined from such thermograms (B) for artery, cusp and muscle tissue without protectant or supplemented with 0–80% sucrose (grayscale bars). Mean ± standard deviations were calculated from three different specimens, and different letters represent significant differences between groups (p ≤ 0.05).
Figure 4
Figure 4
Protein denaturation temperatures in decellularized cusps, determined using DSC. Panel (A) shows thermograms of decellularized (dotted line) and glutaraldehyde-fixed (dashed/dotted line) samples. Furthermore, traces are shown for tissue after freeze-drying with 40% sucrose, both in the dry state (dashed) and after rehydration (solid line). The onset denaturation temperature was derived from such thermograms and is presented in panel (B). Protein denaturation temperatures were determined for fresh (bar with dots) and decellularized cusps (bar with squares), as well as rehydrated samples exposed to freeze-drying with 0–80% sucrose (grayscale bars). Furthermore, bars are shown for glutaraldehyde-fixed tissue (bars with upward diagonal lines) and freeze-dried tissue in dry state (bars with downward diagonal lines). Mean ± standard deviations were calculated from three different specimens, and different letters represent significant differences between groups (p ≤ 0.05).
Figure 5
Figure 5
Overall protein secondary structure of decellularized cusps, determined using FTIR. Panel (A) shows second derivative spectra in the 1700‒1600 cm−1 spectral region, for decellularized (dotted line) and rehydrated tissue exposed to freeze-drying with 40% sucrose (solid line). For comparison, heat-denatured tissue is also shown (dashed/dotted line). Spectra were normalized, and the ratio in α-helical (~1650 cm−1) versus β-sheet structures (~1630 cm−1) was determined, and presented in panel (B). This was done for fresh (bar with dots) and decellularized (bar with squares) cusps as well as rehydrated samples that were freeze-dried with 0–80% sucrose (grayscale bars). Furthermore, bars are shown for glutaraldehyde-fixed samples (bars with upward diagonal lines) and heat-denatured samples (bars with downward diagonal lines). Mean ± standard deviations were calculated from three different specimens, and different letters represent significant differences between groups (p ≤ 0.05).
Figure 6
Figure 6
Collagen and elastin microstructure as well as biomechanical properties of freeze-dried pulmonary heart valve cusps. In TPEF/SHG multiphoton images (A‒F) the distribution and appearance of collagen bundles (green) and elastic fibers (red) is shown for decellularized cusps (A), and rehydrated decellularized cusps subjected to freeze-drying without protectant (B) or supplemented with 5% (C), 40% (D), or 80% sucrose (E). Furthermore, an image is shown for a glutaraldehyde-fixed cusp (F). In panel (G), quantification of collagen waviness is presented, obtained after image analysis. Mean ± standard errors are reported and different letters represent significant differences between groups (p ≤ 0.05). From biomechanical tests, averaged stress-strain curves (n = 6) were calculated (H). Curves are shown for decellularized cusps (green line) and rehydrated decellularized cusps which were subjected to freeze-drying without protectants (yellow line) or 40% sucrose (red line). For comparison, a curve is shown for glutaraldehyde-fixed cusps (light blue).
Figure 7
Figure 7
Biomechanical properties of pulmonary decellularized heart valve tissues, both before and after freeze-drying. Freeze-drying was done without protectants as well as 40 or 80% sucrose, and tissues were rehydrated prior to analysis. The E-modulus was calculated from the slope of the collagen and the elastin phase, whereas values for the failure strain (εUTS) and ultimate tensile strength (σUTS) were obtained from the tissue failure point. Failure was taken to occur when the first decrease in load was detected during extension. Tests in circumferential direction are shown using cusp samples (A,C,E,G), and artery samples (B,D,F,H). E-modulus in the collagen phase (A,B), E-modulus in the elastin phase (C,D), ultimate tensile strength (E,F) and failure strain (G,H) values were determined. All acquired values are indicated (points), as well as mean values and standard deviations (lines). Different letters represent significant differences between groups (p ≤ 0.05).

Similar articles

Cited by

References

    1. Coffey S, Cox B, Williams MJA. Lack of progress in valvular heart disease in the pre-transcatheter aortic valve replacement era: Increasing deaths and minimal change in mortality rate over the past three decades. Am. Heart J. 2014;167:562–567. doi: 10.1016/j.ahj.2013.12.030. - DOI - PubMed
    1. Hammermeister, K. et al. Outcomes 15 years after valve replacement with a mechanical versus a bioprosthetic valve: Final report of the veterans affairs randomized trial. J. Am. Coll. Cardiol.36, 1152–1158 (2000). - PubMed
    1. Jayakrishnan A, Jameela SR. Glutaraldehyde as a fixative in bioprostheses and drug delivery matrices. Biomaterials. 1996;17:471–484. doi: 10.1016/0142-9612(96)82721-9. - DOI - PubMed
    1. Nachlas, A. L. Y., Li, S. & Davis, M. E. Developing a clinically relevant tissue engineered heart valve-A review of current approaches. Adv. Healthc. Mater.6, 1700918 (2017). - PubMed
    1. Cebotari S, et al. Clinical application of tissue engineered human heart valves using autologous progenitor cells. Circulation. 2006;114:I132–I137. doi: 10.1161/CIRCULATIONAHA.105.001065. - DOI - PubMed

Publication types

LinkOut - more resources