. 2018 Sep;20(9):1043-1051.
doi: 10.1038/s41556-018-0150-z. Epub 2018 Aug 27.

Decrease in plasma membrane tension triggers PtdIns(4,5)P2 phase separation to inactivate TORC2

Affiliations

Decrease in plasma membrane tension triggers PtdIns(4,5)P2 phase separation to inactivate TORC2

Margot Riggi et al. Nat Cell Biol. 2018 Sep.

Abstract

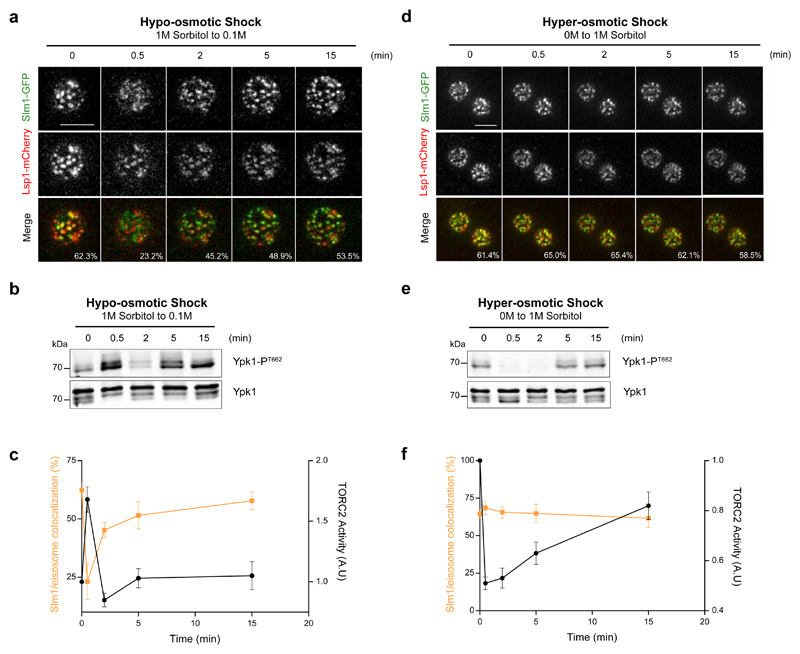
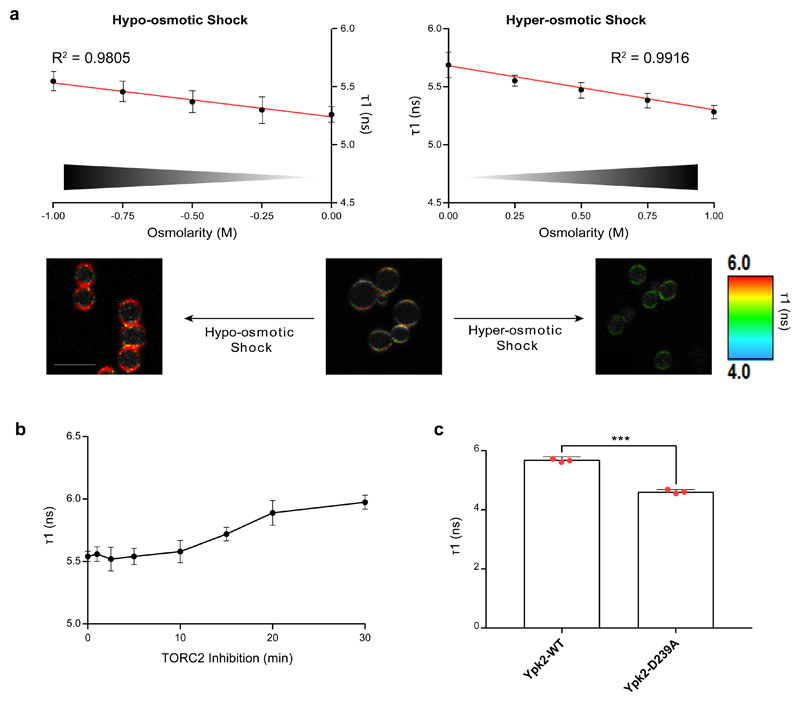
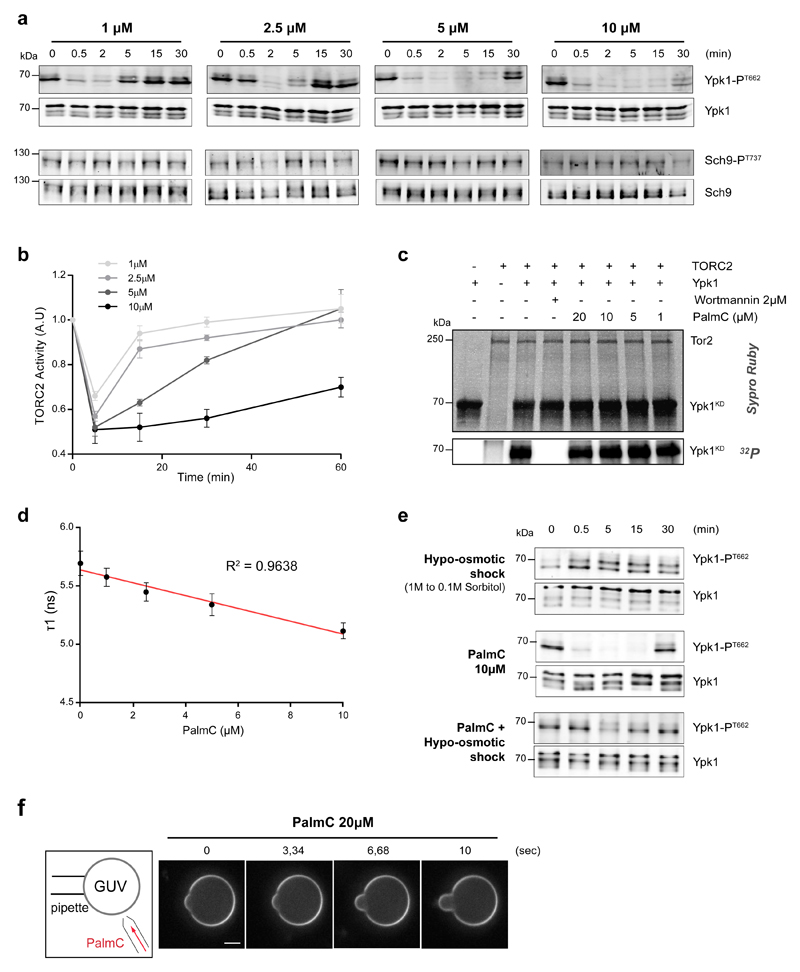
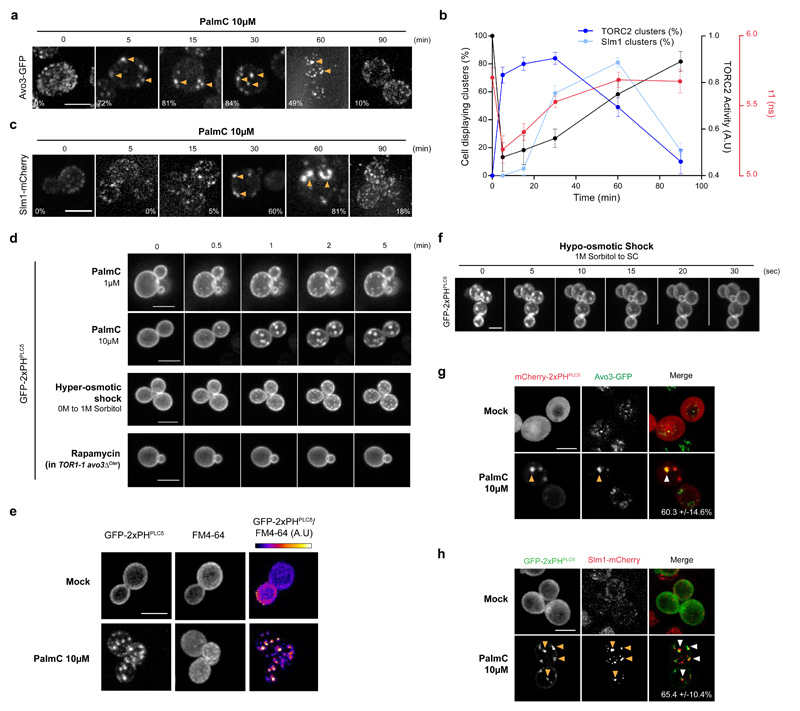
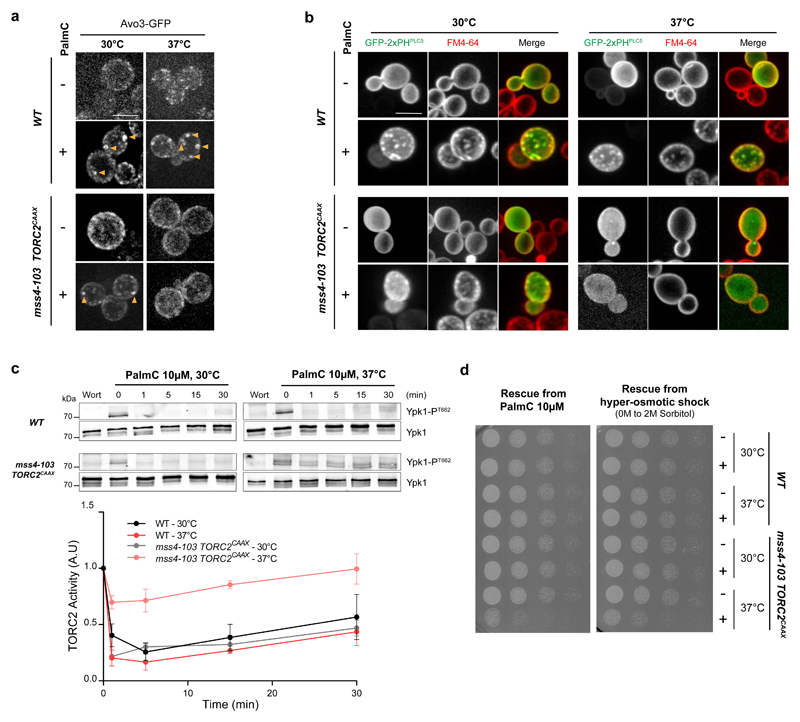
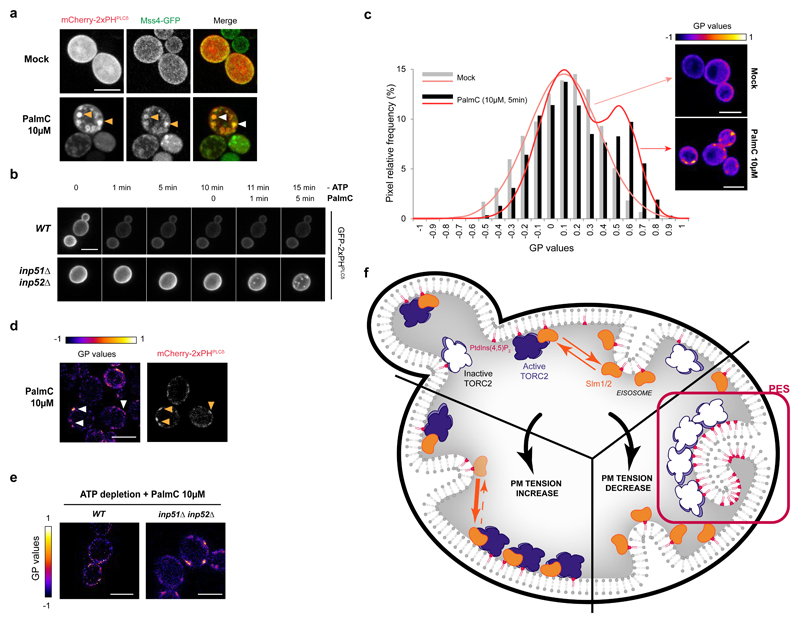
The target of rapamycin complex 2 (TORC2) plays a key role in maintaining the homeostasis of plasma membrane (PM) tension. TORC2 activation following increased PM tension involves redistribution of the Slm1 and 2 paralogues from PM invaginations known as eisosomes into membrane compartments containing TORC2. How Slm1/2 relocalization is triggered, and if/how this plays a role in TORC2 inactivation with decreased PM tension, is unknown. Using osmotic shocks and palmitoylcarnitine as orthogonal tools to manipulate PM tension, we demonstrate that decreased PM tension triggers spontaneous, energy-independent reorganization of pre-existing phosphatidylinositol-4,5-bisphosphate into discrete invaginated membrane domains, which cluster and inactivate TORC2. These results demonstrate that increased and decreased membrane tension are sensed through different mechanisms, highlighting a role for membrane lipid phase separation in mechanotransduction.


Conflict of interest statement

The authors declare no competing interest.

Figures

Fig. 1
Fig. 1. TORC2 senses hypo- and hyper-osmotic shocks through different mechanisms.
(a, d) Top section confocal images of cells expressing Slm1-GFP and Lsp1-mCherry following hypo- (a) or hyperosmotic shock (d). The percentage of colocalization between markers is indicated as the mean from n>30 cells [n=34 cells for hypo-osmotic shock and n=38 for hyper-osmotic shock] pooled from three independent experiments. Scale bars, 5μm. (b, e) Hypo- (b) and hyper-osmotic shocks (e) respectively activate and inhibit TORC2 activity, assessed by monitoring Ypk1 T662 phosphorylation. Presented blots are representative of results obtained in three independent experiments, and all unprocessed scans are shown in Supplementary Figure 7. (c, f) Correlation between Slm1-GFP/eisosome colocalization and TORC2 activity following hypo- (c) or hyperosmotic shock (f). Error bars represent the SD of mean values of three independent experiments concerning TORC2 activity, or the SD to the mean calculated from n>30 [n=34 cells for hypo-osmotic shock and n=38 for hyper-osmotic shock] cells pooled from three independent experiments in the case of the colocalization between Slm1 and eisosomes. Source data are included in Supplementary Table 3.
Fig. 2
Fig. 2. TORC2 regulates PM tension in a homeostatic feedback loop manner.
(a) Osmotic shocks impact PM tension in a dose-dependent, linear fashion. Cells were submitted to a range of osmotic shocks and the lifetime of the FLipTR (Fluorescent LIPid Tension Reporter) probe was determined by Fluorescence Lifetime Imaging Microscopy (FLIM). Note that different control values for the hyper- and hypo-osmotic shocks are due to the different initial growth conditions SC vs. SC + 1M sorbitol. Error bars represent the propagated error of mean values for three independent experiments (with n=20 cells). Scale bars, 5μm. (b) TORC2 inhibition results in increased PM tension. TORC2 was inhibited by Rapamycin in TOR1-1 AVO3∆1274-1430 cells , and the lifetime of the FLipTR probe was measured by FLIM, and presented as the mean +/- SD (n=20 cells). This experiment was repeated twice with similar results. (c) Elevated TORC2 signaling lowers PM tension. The lifetime of the FLipTR probe was measured by FLIM in cells expressing either a WT or a hyperactive version of YPK2 (*** p<0.001, two-tailed unpaired t-test, p=0.00014). Error bars represent the propagated error of mean values for three independent experiments (with n=20 cells). Source data are included in Supplementary Table 3.
Fig. 3
Fig. 3. Palmitoylcarnitine (PalmC) affects PM tension and TORC2 activity.
(a) PalmC inhibits TORC2, but not TORC1, in a time- and dose-dependent manner in vivo. Phosphorylation of Ypk1 T662 and Sch9 T737 were monitored in PalmC-treated cells. Presented blots are representative of results obtained in three independent experiments. (b) Evolution of TORC2 activity after varying PalmC doses. Error bars represent the SD of mean values of three independent experiments. (c) PalmC does not inhibit TORC2 in vitro. Purified TORC2 was incubated with the indicated inhibitors, radiolabeled γ-ATP, and a kinase-dead version of Ypk1. After separation proteins were visualized by Sypro Ruby staining and incorporation of radiolabeled ATP imaged with a phosphoimager. This experiment was repeated three times with similar results. (d) PalmC induces a decrease in PM tension. Cells incubated with the FLipTR probe were treated with PalmC and imaged after 5 min by FLIM. Error bars represent the propagated error of mean values for three independent experiments (n=20 cells). (e) Simultaneous increase in PM tension negates PalmC effects on TORC2 activity. Phosphorylation of Ypk1 T662 was monitored in fps1Δ cells treated with PalmC, +/- a hypo-osmotic shock, at the indicated time points. This experiment was repeated twice with similar results. (f) PalmC incorporates into membranes. Time-lapse following PalmC injection (20μM) in the vicinity of a Giant Unilamellar Vesicle (GUV). Additional membrane is evidenced by appearance of an aspiration tongue. This experiment was repeated twice with similar results. All unprocessed scans of blots are shown in Supplementary Figure 7. Source data are included in Supplementary Table 3.
Fig. 4
Fig. 4. Decreased PM tension causes TORC2 to cluster into PtdIns(4,5)P2-Enriched-Structures (PES).
(a, c) PalmC induces rapid TORC2 (Avo3-GFP, (a)) and delayed Slm1-mCherry (c) clustering. The percentage of cells displaying clusters is indicated as the mean of three independent experiments including 50 cells. (b) Correlation of TORC2 clustering (dark blue), Slm clustering (light blue), TORC2 activity (black), and PM tension (red), following PalmC treatment. Clustering was assessed in three independent experiments, each including 50 cells. TORC2 activity was monitored by Ypk1 T662 phosphorylation and the error bars represent the SD of three independent experiments. PM tension was monitored through the FLipTR probe lifetime and the error bars represent the propagated error of mean values of three independent experiments (n=20 cells). (d) A decrease in PM tension, but not direct inhibition of TORC2, triggers PtdIns(4,5)P2 redistribution. Time lapse of cells expressing the GFP-2xPHPLCδ biosensor upon PalmC treatment, hyper-osmotic shock, or Rapamycin treatment. (e) The membrane domains formed upon decreased PM tension are enriched in PtdIns(4,5)P2. Cells expressing the GFP-2xPHPLCδ biosensor and labelled with FM4-64 were mock treated or treated with PalmC for 5 min. The last column presents the ratiometric images of the two channels, constructed using ImageJ image calculator tool. (f) An increase in PM tension induces fast disassembly of the PES. Time lapse of cells expressing the GFP-2xPHPLCδ biosensor and pretreated with PalmC for 15 min upon a 1M hypo-osmotic shock. TORC2 (g) and Slm1 (h) clusters co-localize with PES after PalmC treatment. The percentage of colocalization between markers is the mean calculated from 10 cells pooled from two independent experiments, +/- SD. All images are maximum projections of 0.5μm-spaced Z-planes of the cells, and representative of results obtained in at least two independent experiments. Scale bars, 5μm. Source data are included in Supplementary Table 3.
Fig. 5
Fig. 5. PtdIns(4,5)P2 is crucial for TORC2 inhibition and cell survival upon an acute decrease in PM tension.
(a) PtdIns(4,5)P2 is required for TORC2 clustering upon decrease PM tension. Avo3-GFP localization upon PalmC treatment, in WT and mss4-103 TORC2CAAX cells grown at the indicated temperatures for 90min. (b) PtdIns(4,5)P2 is required for PM remodeling upon decreased PM tension. FM4-64 PM labeling in WT and mss4-103 TORC2CAAX cells expressing GFP-2xPHPLCδ and grown at the indicated temperatures for 90min, upon PalmC treatment. (c) PtdIns(4,5)P2 is required for TORC2 inhibition upon decrease PM tension. Evolution of Ypk1 T662 phosphorylation upon PalmC or Wortmannin (Wort, 2μM, 5min) treatment, in WT and mss4-103 TORC2CAAX cells grown at the indicated temperatures for 90min. Unprocessed scans of blots are shown in Supplementary Figure 7. Error bars represent the SD of mean values of three independent experiments, and source data are included in Supplementary Table 3. (d) TORC2 inhibition is necessary for efficient survival of an acute decrease in PM tension. WT or mss4-103 TORC2CAAX cells were grown at the indicated temperature for 90min before being treated with 10μM PalmC for 60min or 2M Sorbitol for 15min. Serial dilutions were then spotted onto YPD plates and cell regrowth monitored 24h later. All images are maximum projections of 0.5μm-spaced Z-planes of the cells, and representative of results obtained in at least three independent experiments. Scale bars, 5μm.
Fig. 6
Fig. 6. PtdIns(4,5)P2 redistributes through ATP-independent phase separation upon decreased PM tension
(a) Mss4-GFP relocalizes to PES upon decreased PM tension. Images are maximum projections of 0.5μm-spaced Z-planes of the cells. (b) Mss4 activity is not required for PES assembly. Time-lapse images of WT or inp51Δinp52Δ cells expressing the GFP-2xPHPLCδ biosensor upon ATP depletion followed by 10μM PalmC treatment. Images are maximum projections of 0.5μm-spaced Z-planes of the cells. (c) Decreased PM tension induces a lipid phase separation within the PM. PM pixel distribution and modeled distribution after Laurdan GP (Generalized Polarization) imaging of untreated and PalmC-treated cells (n=25 cells pooled from two independent experiments, >2250 pixels, n=2583 and 2251 pixels for the mock and PalmC conditions respectively). Representative color-coded GP images of the equatorial plan of the cells, constructed with ImageJ image calculator tool, are shown. Source data are included in Supplementary Table 3. (d) PM domains of higher GP correspond to PES. Cells expressing the mCherry-2xPHPLCδ biosensor were stained with the Laurdan dye after 5min of 10μM PalmC treatment, and a representative colour-coded GP image of the equatorial plan of the cells, constructed with ImageJ image calculator tool, is shown. (e) ATP depletion prevents the formation of puncta of higher GP upon PalmC treatment in WT, but not in inp51Δinp52Δ cells. Representative colour-coded GP images of maximum projections of 0.5μm-spaced Z-planes of the cells, constructed with ImageJ image calculator tool, are shown. (f) Increased and decreased PM tension are sensed through different mechanisms by TORC2. Increased PM tension induces the translocation of Slm proteins (orange) from eisosomes to MCTs where they activate TORC2 (purple). Decreased PM tension triggers a spontaneous, energy-independent PtdIns(4,5)P2 phase separation into invaginated membrane domains (PES) which cluster and inactivate TORC2 (white). All images are representative of results obtained in at least two independent experiments. Scale bars, 5μm.

Similar articles

Cited by

References

    1. Paluch E, Heisenberg CP. Biology and physics of cell shape changes in development. Curr Biol. 2009;19:R790–799. doi: 10.1016/j.cub.2009.07.029. - DOI - PubMed
    1. Yu H, Mouw JK, Weaver VM. Forcing form and function: biomechanical regulation of tumor evolution. Trends in Cell Biology. 2011;21:47–56. doi: 10.1016/j.tcb.2010.08.015. - DOI - PMC - PubMed
    1. Diz-Munoz A, Fletcher DA, Weiner OD. Use the force: membrane tension as an organizer of cell shape and motility. Trends Cell Biol. 2013;23:47–53. doi: 10.1016/j.tcb.2012.09.006. - DOI - PMC - PubMed
    1. Dai J, Sheetz MP. Mechanical properties of neuronal growth cone membranes studied by tether formation with laser optical tweezers. Biophys J. 1995;68:988–996. doi: 10.1016/S0006-3495(95)80274-2. - DOI - PMC - PubMed
    1. Lieber AD, Yehudai-Resheff S, Barnhart EL, Theriot JA, Keren K. Membrane tension in rapidly moving cells is determined by cytoskeletal forces. Curr Biol. 2013;23:1409–1417. doi: 10.1016/j.cub.2013.05.063. - DOI - PubMed

Methods only References

    1. Narita T, Naganuma T, Sase Y, Kihara A. Long-chain bases of sphingolipids are transported into cells via the acyl-CoA synthetases. Sci Rep. 2016;6 doi: 10.1038/srep25469. 25469. - DOI - PMC - PubMed
    1. Loewith R, Hall MN. Target of rapamycin (TOR) in nutrient signaling and growth control. Genetics. 2011;189:1177–1201. doi: 10.1534/genetics.111.133363. - DOI - PMC - PubMed
    1. Huber A, et al. Characterization of the rapamycin-sensitive phosphoproteome reveals that Sch9 is a central coordinator of protein synthesis. Genes Dev. 2009;23:1929–1943. doi: 10.1101/gad.532109. - DOI - PMC - PubMed
    1. Vincent J, et al. Small molecule inhibition of cGAS reduces interferon expression in primary macrophages from autoimmune mice. Nat Commun. 2017;8:750. doi: 10.1038/s41467-017-00833-9. - DOI - PMC - PubMed
    1. Wanke V, et al. Caffeine extends yeast lifespan by targeting TORC1. Mol Microbiol. 2008;69:277–285. doi: 10.1111/j.1365-2958.2008.06292.x. - DOI - PubMed

Publication types

MeSH terms

LinkOut - more resources