

An air-stable Dy(iii) single-ion magnet with high anisotropy barrier and blocking temperature
- PMID: 30155168
- PMCID: PMC6020529
- DOI: 10.1039/c6sc00279j
An air-stable Dy(iii) single-ion magnet with high anisotropy barrier and blocking temperature
Abstract
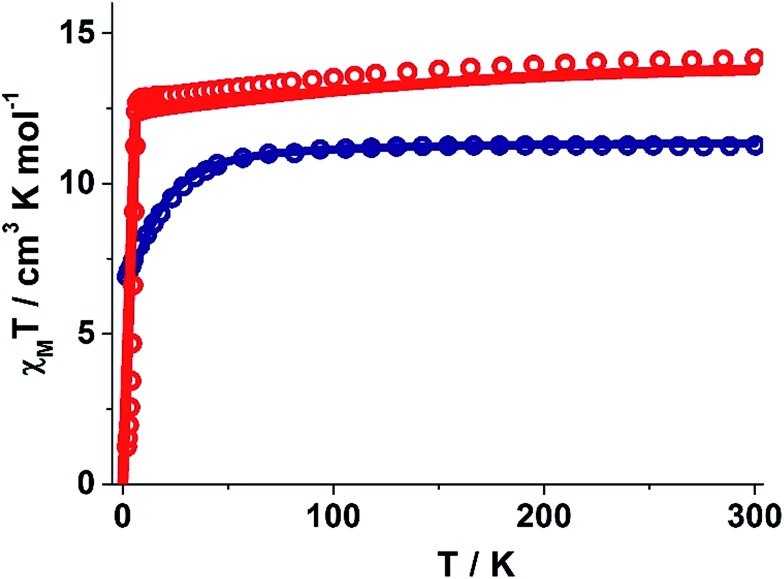
Herein we report air-stable Dy(iii) and Er(iii) single-ion magnets (SIMs) with pseudo-D5h symmetry, synthesized from a sterically encumbered phosphonamide, t BuPO(NHiPr)2, where the Dy(iii)-SIM exhibits a magnetization blocking (TB) up to 12 K, defined from the maxima of the zero-field cooled magnetization curve, with an anisotropy barrier (Ueff) as high as 735.4 K. The Dy(iii)-SIM exhibits a magnetic hysteresis up to 12 K (30 K) with a large coercivity of ∼0.9 T (∼1.5 T) at a sweep rate of ∼0.0018 T s-1 (0.02 T s-1). These high values combined with persistent stability under ambient conditions, render this system as one of the best-characterized SIMs. Ab initio calculations have been used to establish the connection between the higher-order symmetry of the molecule and the quenching of quantum tunnelling of magnetization (QTM) effects. The relaxation of magnetization is observed via the second excited Kramers doublet owing to pseudo-high-order symmetry, which quenches the QTM. This study highlights fine-tuning of symmetry around the lanthanide ion to obtain new-generation SIMs and offers further scope for pushing the limits of Ueff and TB using this approach.
Figures


References
-
- Blagg R. J., Ungur L., Tuna F., Speak J., Comar P., Collison D., Wernsdorfer W., McInnes E. J. L., Chibotaru L. F., Winpenny R. E. P. Nat. Chem. 2013;5:673–678. - PubMed
- Rinehart J. D., Fang M., Evans W. J., Long J. R. Nat. Chem. 2011;3:538–542. - PubMed
- Rinehart J. D., Fang M., Evans W. J., Long J. R. J. Am. Chem. Soc. 2011;133:14236–14239. - PubMed
- Ganivet C. R., Ballesteros B., de la Torre G., Clemente-Juan J. M., Coronado E., Torres T. Chem.–Eur. J. 2013;19:1457–1465. - PubMed
- Perfetti M., Cucinotta G., Boulon M.-E., El Hallak F., Gao S., Sessoli R. Chem.–Eur. J. 2014;20:14051–14056. - PubMed
- Le Roy J. J., Korobkov I., Murugesu M. Chem. Commun. 2014;50:1602–1604. - PubMed
- Gatteschi D., Sessoli R. and Villain J., in Molecular Nanomagnets, Oxford University Press, 2006.
-
- Jiang S.-D., Wang B.-W., Sun H.-L., Wang Z.-M., Gao S. J. Am. Chem. Soc. 2011;133:4730–4733. - PubMed
- Jiang S.-D., Liu S.-S., Zhou L.-N., Wang B.-W., Wang Z.-M., Gao S. Inorg. Chem. 2012;51:3079–3087. - PubMed
- Perfetti M., Lucaccini E., Sorace L., Costes J. P., Sessoli R. Inorg. Chem. 2015;54:3090–3092. - PubMed
- Demir S., Zadrozny J. M., Nippe M., Long J. R. J. Am. Chem. Soc. 2012;134:18546–18549. - PubMed
-
- Ungur L., Le Roy J. J., Korobkov I., Murugesu M., Chibotaru L. F. Angew. Chem., Int. Ed. 2014;53:4413–4417. - PubMed
- Brown A. J., Pinkowicz D., Saber M. R., Dunbar K. R. Angew. Chem., Int. Ed. 2015;54:5864–5868. - PubMed
- Boulon M.-E., Cucinotta G., Luzon J., Degl'Innocenti C., Perfetti M., Bernot K., Calvez G., Caneschi A., Sessoli R. Angew. Chem., Int. Ed. 2013;52:350–354. - PubMed
- Rechkemmer Y., Fischer J. E., Marx R., Dörfel M., Neugebauer P., Horvath S., Gysler M., Brock-Nannestad T., Frey W., Reid M. F., van Slageren J. J. Am. Chem. Soc. 2015;137:13114–13120. - PubMed
- Lucaccini E., Sorace L., Perfetti M., Costes J.-P., Sessoli R. Chem. Commun. 2014;50:1648–1651. - PubMed
- Cucinotta G., Perfetti M., Luzon J., Etienne M., Car P.-E., Caneschi A., Calvez G., Bernot K., Sessoli R. Angew. Chem., Int. Ed. 2012;51:1606–1610. - PubMed
- Gregson M., Chilton N. F., Ariciu A.-M., Tuna F., Crowe I. F., Lewis W., Blake A. J., Collison D., McInnes E. J. L., Winpenny R. E. P., Liddle S. T. Chem. Sci. 2016;7:155–165. - PMC - PubMed
- Pointillart F., Bernot K., Golhen S., Le Guennic B., Guizouarn T., Ouahab L., Cador O. Angew. Chem., Int. Ed. 2015;54:1504–1507. - PubMed
-
- Ishikawa N., Sugita M., Ishikawa T., Koshihara S.-y., Kaizu Y. J. Am. Chem. Soc. 2003;125:8694–8695. - PubMed
LinkOut - more resources
Full Text Sources
Other Literature Sources
Research Materials