. 2018 Jun 6;9(24):5441-5451.
doi: 10.1039/c8sc00148k. eCollection 2018 Jun 28.

Large-scale comparison of machine learning methods for drug target prediction on ChEMBL

Affiliations

Large-scale comparison of machine learning methods for drug target prediction on ChEMBL

Andreas Mayr et al. Chem Sci. .

Abstract

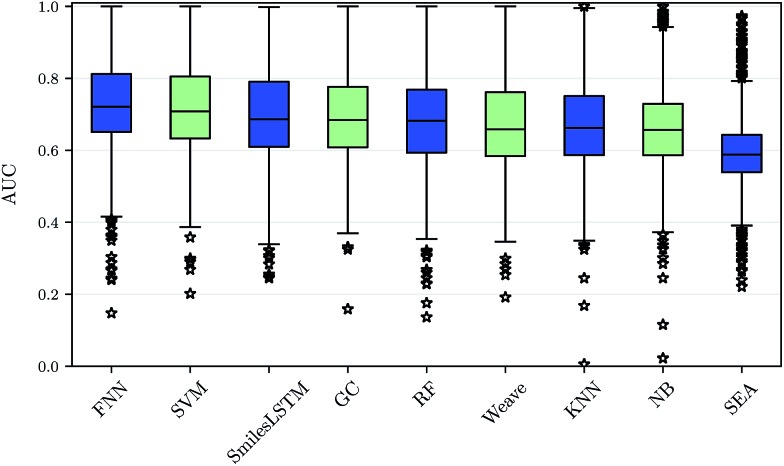
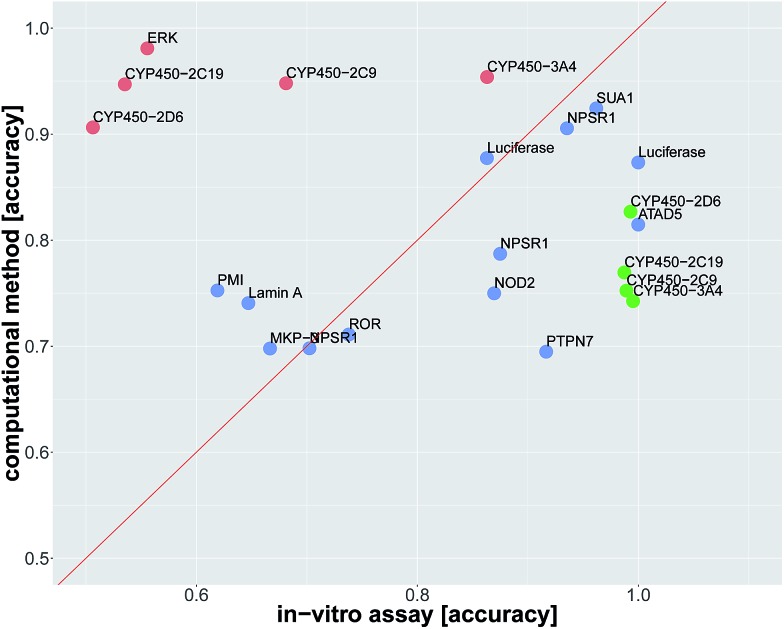
Deep learning is currently the most successful machine learning technique in a wide range of application areas and has recently been applied successfully in drug discovery research to predict potential drug targets and to screen for active molecules. However, due to (1) the lack of large-scale studies, (2) the compound series bias that is characteristic of drug discovery datasets and (3) the hyperparameter selection bias that comes with the high number of potential deep learning architectures, it remains unclear whether deep learning can indeed outperform existing computational methods in drug discovery tasks. We therefore assessed the performance of several deep learning methods on a large-scale drug discovery dataset and compared the results with those of other machine learning and target prediction methods. To avoid potential biases from hyperparameter selection or compound series, we used a nested cluster-cross-validation strategy. We found (1) that deep learning methods significantly outperform all competing methods and (2) that the predictive performance of deep learning is in many cases comparable to that of tests performed in wet labs (i.e., in vitro assays).


Figures

Fig. 1
Fig. 1. Assay correlation [left: number of compounds (log-scaled) measured on both assays, right: Pearson correlation on commonly measured compounds].
Fig. 2
Fig. 2. Performance comparison of drug target prediction methods. The assay-AUC values for various target prediction algorithms based on ECFP6 features, graphs and sequences are displayed as boxplot. Each compared method yields 1310 AUC values for each modelled assay. On average, deep feed-forward neural networks (FNN) perform best followed by support vector machines (SVM), sequence-based networks (SmilesLSTM), GC graph convolution networks (GC), random forests (RF), Weave graph convolution networks (Weave), k-nearest neighbour (KNN), naive bayes (NB) and SEA.
Fig. 3
Fig. 3. Comparison of prediction accuracy for an in vitro assay. The dots represent the in vitro assays, that should be predicted. The prediction is either by a surrogate in vitro assay with the same target as the assay, which has to be predicted, or by an in silico deep learning virtual assay. The x-axis indicates the in vitro accuracy and the y-axis the FNN deep learning accuracy. Significantly better accuracies of one prediction method over the other one are indicated in green and red. Blue dots denote assays for which the difference in accuracy was not significant. Point labels give the biomolecular target.
Fig. 4
Fig. 4. Scatterplot of predictive performance (“AUC”, y-axis) and size of the training set (“trainset size”, x-axis). Colors indicate three different predictive methods, namely FNNs, SVMs, and RFs. The trend that assays with a large number of training data points lead to better predictive models is consistent between the three shown machine learning methods.
Fig. 5
Fig. 5. Boxplot of assay-AUC values for various assay classes when using a DNN on a combination of ECFP6 and ToxF features. The number after the name of the x-axis label gives the amount of assays in the respective class.
Fig. 6
Fig. 6. Boxplot of assay-AUC values for various assay types when using a DNN on a combination of ECFP6 and ToxF features. The number after the name of the x-axis label gives the amount of assays for the respective type.
Fig. 7
Fig. 7. Number of different assay labels (log-scaled) per compound for the finally used benchmark dataset, numbers occurring only once are marked with a star.

References

    1. Molina D. M., Jafari R., Ignatushchenko M., Seki T., Larsson E. A., Dan C., Sreekumar L., Cao Y., Nordlund P. Science. 2013;341:84–87. - PubMed
    1. Huang R., Xia M., Nguyen D.-T., Zhao T., Sakamuru S., Zhao J., Shahane S. A., Rossoshek A., Simeonov A. Front. Environ. Sci. Eng. 2016;3:85.
    1. Ma J., Sheridan R. P., Liaw A., Dahl G. E., Svetnik V. J. Chem. Inf. Model. 2015;55:263–274. - PubMed
    1. Mayr A., Klambauer G., Unterthiner T., Hochreiter S. Front. Environ. Sci. Eng. 2016;3:80.
    1. Gómez-Bombarelli R., Wei J. N., Duvenaud D., Hernández-Lobato J. M., Sánchez-Lengeling B., Sheberla D., Aguilera-Iparraguirre J., Hirzel T. D., Adams R. P., Aspuru-Guzik A. ACS Cent. Sci. 2016;4:268–276. - PMC - PubMed