. 2018 Aug 23:4:34.
doi: 10.1038/s41540-018-0068-x. eCollection 2018.

A landscape view on the interplay between EMT and cancer metastasis

Affiliations

A landscape view on the interplay between EMT and cancer metastasis

Chunhe Li et al. NPJ Syst Biol Appl. .

Abstract

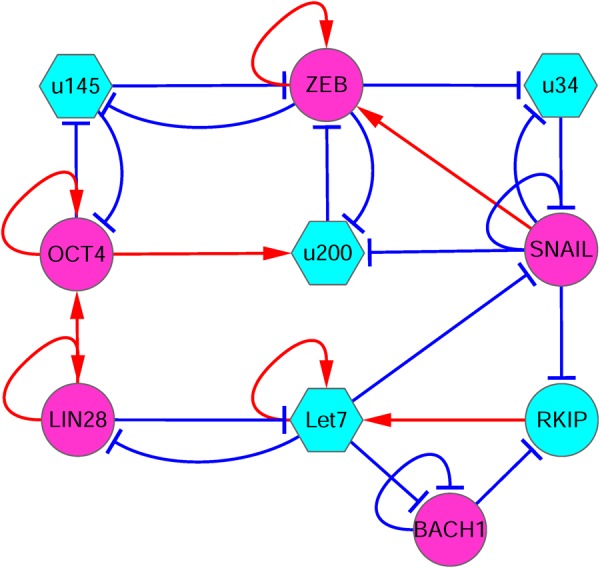
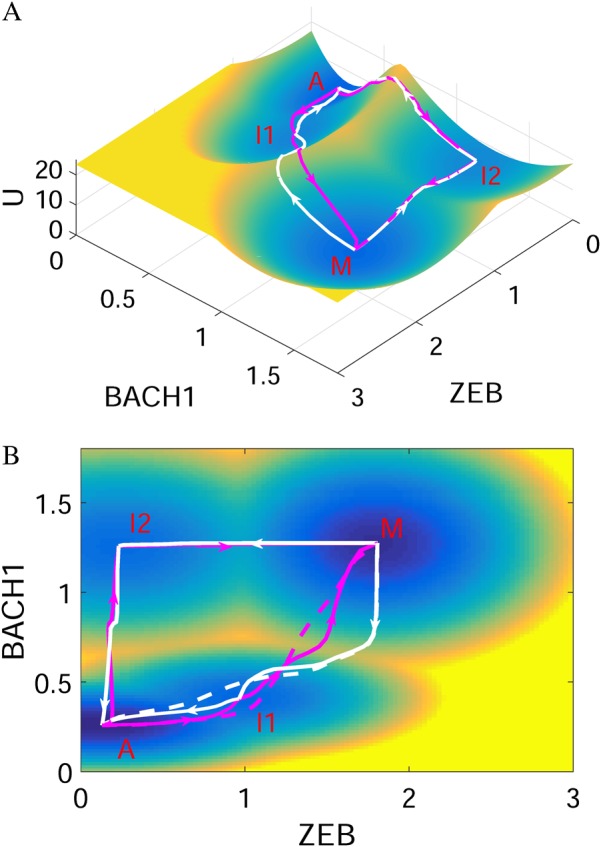
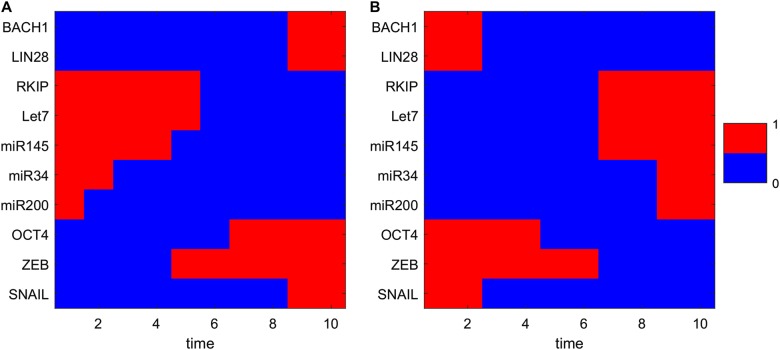
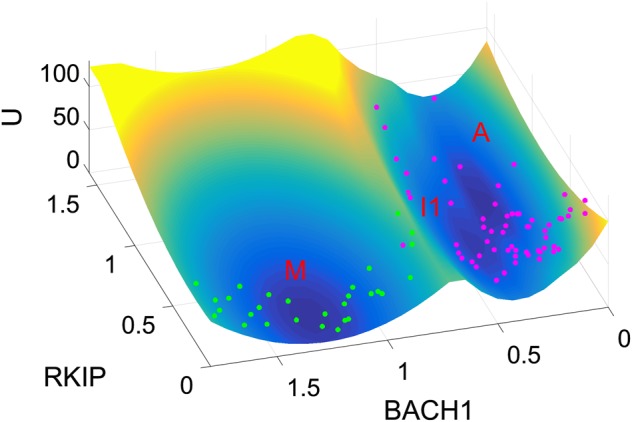
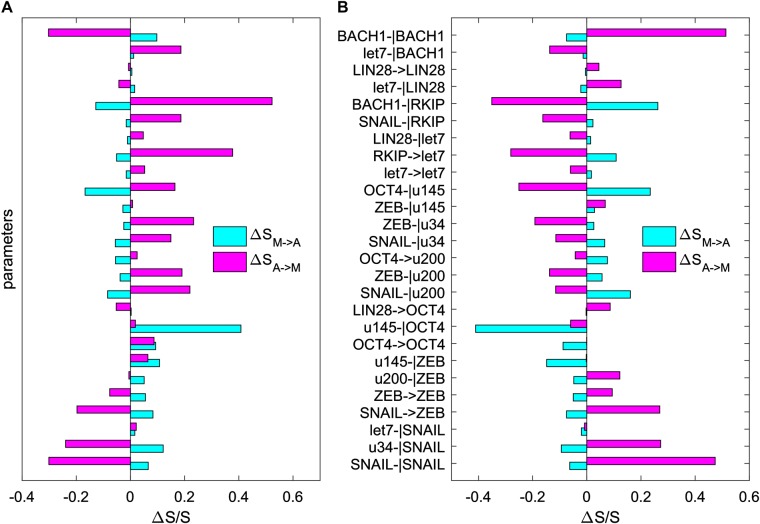
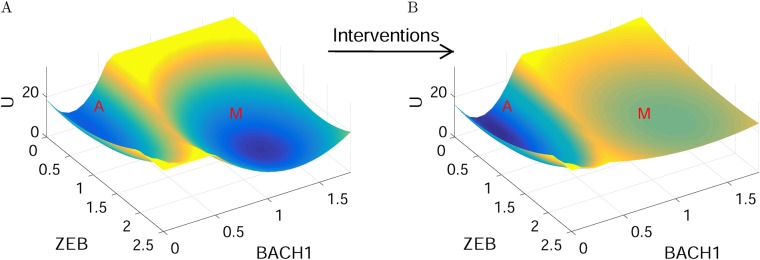
The epithelial-mesenchymal transition (EMT) is a basic developmental process that converts epithelial cells to mesenchymal cells. Although EMT might promote cancer metastasis, the molecular mechanisms for it remain to be fully clarified. To address this issue, we constructed an EMT-metastasis gene regulatory network model and quantified the potential landscape of cancer metastasis-promoting system computationally. We identified four steady-state attractors on the landscape, which separately characterize anti-metastatic (A), metastatic (M), and two other intermediate (I1 and I2) cell states. The tetrastable landscape and the existence of intermediate states are consistent with recent single-cell measurements. We identified one of the two intermediate states I1 as the EMT state. From a MAP approach, we found that for metastatic progression cells need to first undergo EMT (enter the I1 state), and then become metastatic (switch from the I1 state to the M state). Specifically, for metastatic progression, EMT genes (such as ZEB) should be activated before metastasis genes (such as BACH1). This suggests that temporal order is important for the activation of cellular programs in biological systems, and provides a possible mechanism of EMT-promoting cancer metastasis. To identify possible therapeutic targets from this landscape view, we performed sensitivity analysis for individual molecular factors, and identified optimal interventions for landscape control. We found that minimizing transition actions more effectively identifies optimal combinations of targets that induce transitions between attractors than single-factor sensitivity analysis. Overall, the landscape view not only suggests that intermediate states increase plasticity during cell fate decisions, providing a possible source for tumor heterogeneity that is critically important in metastatic progress, but also provides a way to identify therapeutic targets for preventing cancer progression.


Conflict of interest statement

The authors declare no competing interests.

Figures

Fig. 1
Fig. 1
The diagram for the core circuit of EMT-metastasis network including 10 gene nodes and 26 regulation links (8 activations and 18 repressions). Red arrows represent activation and blue bars represent repression. Magenta nodes represents pro-metastatic genes, and cyan nodes represent anti-metastatic genes. Circle nodes represent proteins and hexagonal nodes represent microRNAs. u34: miR34, u200: miR200, u145: miR145
Fig. 2
Fig. 2
The landscape and corresponding minimum action paths (MAPs) for the EMT-metastasis network are shown in three-dimensional (a) and two-dimensional figures (b). Magenta solid lines represent the MAP from A state (anti-metastatic cell state) to I states, and to M state (metastatic cell state), and the white solid lines represent the MAP from M to I, and to A state. The dashed lines represent the direct MAP from A to M and from M to A states, respectively. A: anti-metastatic state, M: metastatic state, I1, I2: intermediate state. Here, ZEB and BACH1 are selected as the two coordinates
Fig. 3
Fig. 3
Transition path from A state to M state (a corresponding to the metastatic progression) and from M state to A state (b corresponding to the anti-metastatic progress) in terms of expression levels of 10 different genes. The relative gene expressions are discretized to 0 or 1. 1 represents that the corresponding genes are in the on (activated) state and 0 represents that the corresponding genes are in the off (repressed) state. X-axis shows the 10 time points along the transition path
Fig. 4
Fig. 4
Landscape comparisons with single-cell experimental data (MDA-MB-231 cells). RKIP and BACH1 are chosen as the two coordinates. Each point represents a normalized gene expression value for one cell from single-cell experiments. Green points, untreated cells; magenta points, cells after shBACH1 treatment (BACH1 knockdown). M: metastatic state, A: anti-metastatic state, I1: intermediate state
Fig. 5
Fig. 5
Sensitivity analysis for the 26 key parameters (regulatory strengths among different genes, including 8 activation constants and 18 inhibition constants) on the transition action (SM−>A and SA−>M). Y-axis represents the 26 parameters. X-axis represents the percentage of the change of the transition action (S) relative to S with default parameters. Here, SM−>A represents the transition action from attractor M to attractor A (cyan bars), and SA−>M represents the transition action from attractor A to attractor M (magenta bars). a Each parameter is increased by 20%, individually. b Each parameter is decreased by 20%, individually. u145: miR145, u34: miR34, u200: miR200
Fig. 6
Fig. 6
An illustration for the landscapes of cancer metastasis network before and after interventions. Before interventions, the M state is deep and stable; after interventions, the M state becomes very shallow and cells are more inclined to stay in the A state. A: anti-metastatic state, M: metastatic state

References

    1. Brabletz T, Lyden D, Steeg PS, Werb Z. Roadblocks to translational advances on metastasis research. Nat. Med. 2013;19:1104–1109. doi: 10.1038/nm.3327. - DOI - PMC - PubMed
    1. Nieto MA. The ins and outs of the epithelial to mesenchymal transition in health and disease. Annu. Rev. Cell Dev. Biol. 2011;27:347–376. doi: 10.1146/annurev-cellbio-092910-154036. - DOI - PubMed
    1. Thiery JP, Acloque H, Huang RY, Nieto MA. Epithelial-mesenchymal transitions in development and disease. Cell. 2009;139:871–890. doi: 10.1016/j.cell.2009.11.007. - DOI - PubMed
    1. Nakaya Y, Sheng G. Emt in developmental morphogenesis. Cancer Lett. 2013;341:9–15. doi: 10.1016/j.canlet.2013.02.037. - DOI - PubMed
    1. Jia D, Jolly MK, Kulkarni P, Levine H. Phenotypic plasticity and cell fate decisions in cancer: insights from dynamical systems theory. Cancers. 2017;9:70. doi: 10.3390/cancers9070070. - DOI - PMC - PubMed