. 2018 Aug 1:2018:6736251.
doi: 10.1155/2018/6736251. eCollection 2018.

Using Anthropometric Indicator to Identify Hypertension in Adolescents: A Study in Sarawak, Malaysia

Affiliations

Using Anthropometric Indicator to Identify Hypertension in Adolescents: A Study in Sarawak, Malaysia

Whye Lian Cheah et al. Int J Hypertens. .

Abstract

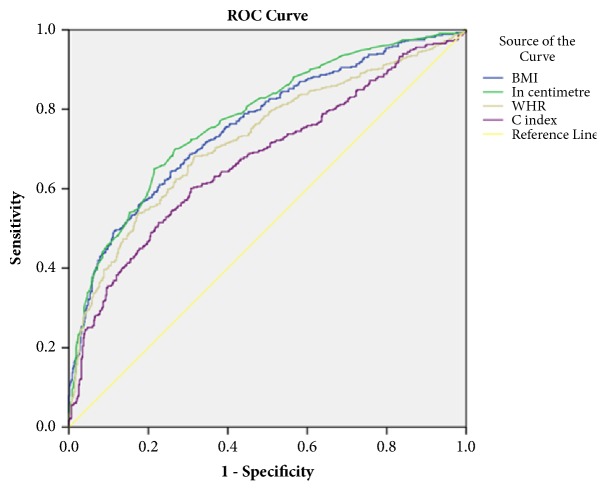
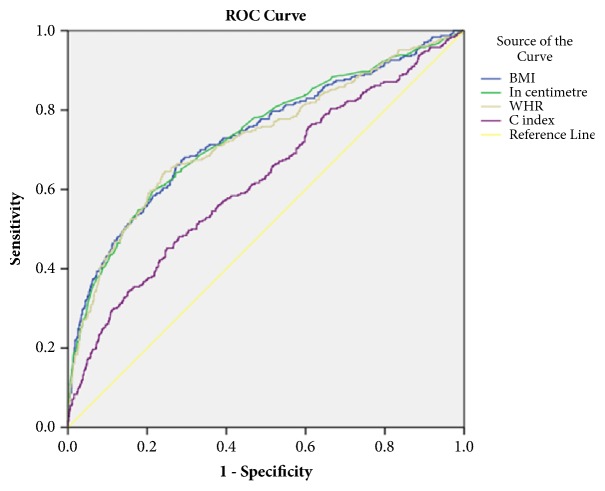
This cross-sectional study was conducted to determine the predictive power of anthropometric indicators and recommend cutoff points to discriminate hypertension among adolescents in Sarawak, Malaysia. A total of 2461 respondents aged 12-17 years participated in this study with mean age of 14.5±1.50 years. All anthropometric indicators had significant area under the ROC curve, with body mass index (BMI) and waist circumference (WC) ranging from 0.7 to 0.8. The best anthropometric indicators for predicting hypertension for boys were WC, BMI, and waist-to-height ratio (WHtR). For girls, BMI was the best indicators followed by WHtR and WC. The recommended BMI cutoff point for boys was 20 kg/m2 and 20.7 kg/m2 for girls. For WC, the recommended cutoff point was 67.1 cm for boys and 68.2 cm for girls. BMI and WC indicators were recommended to be used at the school setting where the measurement can easily be conducted.


Figures

Figure 1
Figure 1
ROC curves that compare four anthropometric indicators of obesity as discriminators of hypertension (boys). BMI: body mass index, in centimeter-waist circumference; WHR: waist-height ratio; C index: conicity index.
Figure 2
Figure 2
ROC curves that compare four anthropometric indicators of obesity as discriminators of hypertension (girls). BMI: body mass index, in centimeter-waist circumference; WHR: waist-height ratio; C index: conicity index.

Similar articles

Cited by

References

    1. Gupta N., Goel K., Shah P., Misra A. Childhood obesity in developing countries: epidemiology, determinants, and prevention. Endocrine Reviews. 2012;33(1):48–70. doi: 10.1210/er.2010-0028. - DOI - PubMed
    1. Sahoo K., Sahoo B., Choudhury A. K., et al. Childhood obesity: causes and consequences. Journal of Family Medicine and Primary Care. 2015;4(2):187–192. - PMC - PubMed
    1. Must A., Strauss R. S. Risks and consequences of childhood and adolescent obesity. International Journal of Obesity. 1999;23(supplement 2):S2–S11. doi: 10.1038/sj.ijo.0800879. - DOI - PubMed
    1. George C., Goedecke J. H., Crowther N. J., et al. The role of body fat and fat distribution in hypertension risk in urban Black South African women. PLoS ONE. 2016;11(5) doi: 10.1371/journal.pone.0154894.e0154894 - DOI - PMC - PubMed
    1. Duren D. L., Sherwood R. J., Czerwinski S. A., et al. Body composition methods: Comparisons and interpretation. Journal of Diabetes Science and Technology. 2008;2(6):1139–1146. doi: 10.1177/193229680800200623. - DOI - PMC - PubMed

LinkOut - more resources