. 2019 Feb;60(2):144-157.
doi: 10.1165/rcmb.2017-0405OC.

Intracellular C3 Protects Human Airway Epithelial Cells from Stress-associated Cell Death

Affiliations

Intracellular C3 Protects Human Airway Epithelial Cells from Stress-associated Cell Death

Hrishikesh S Kulkarni et al. Am J Respir Cell Mol Biol. 2019 Feb.

Abstract

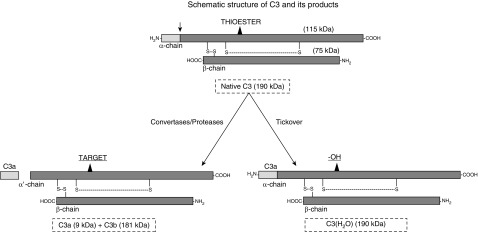
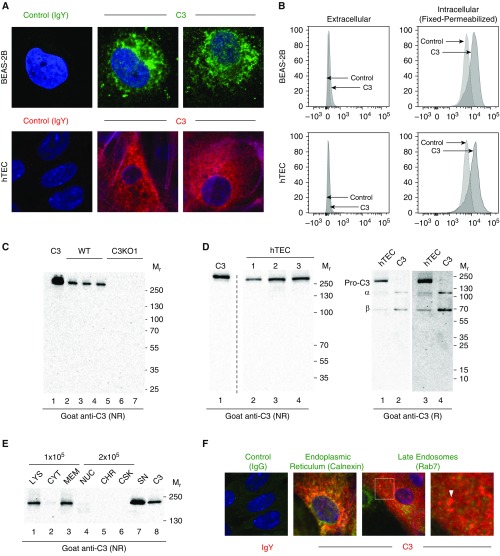
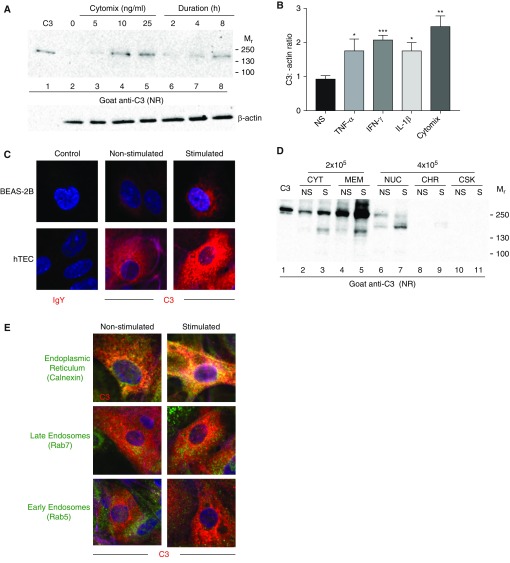
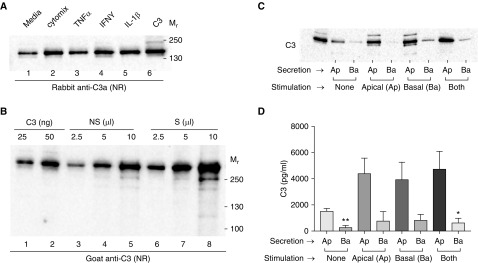
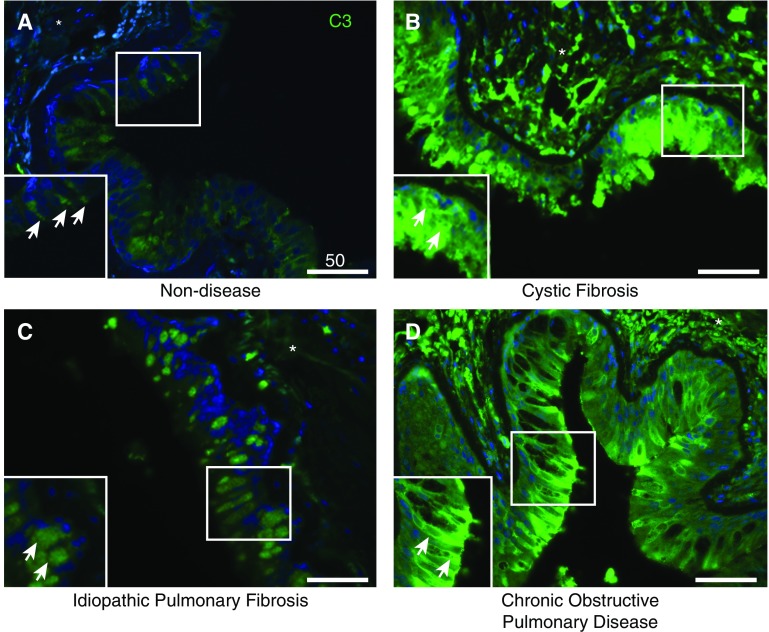
The complement system provides host defense against pathogens and environmental stress. C3, the central component of complement, is present in the blood and increases in BAL fluid after injury. We recently discovered that C3 is taken up by certain cell types and cleaved intracellularly to C3a and C3b. C3a is required for CD4+ T-cell survival. These observations made us question whether complement operates at environmental interfaces, particularly in the respiratory tract. We found that airway epithelial cells (AECs, represented by both primary human tracheobronchial cells and BEAS-2B [cell line]) cultured in C3-free media were unique from other cell types in that they contained large intracellular stores of de novo synthesized C3. A fraction of this protein reduced ("storage form") but the remainder did not, consistent with it being pro-C3 ("precursor form"). These two forms of intracellular C3 were absent in CRISPR knockout-induced C3-deficient AECs and decreased with the use of C3 siRNA, indicating endogenous generation. Proinflammatory cytokine exposure increased both stored and secreted forms of C3. Furthermore, AECs took up C3 from exogenous sources, which mitigated stress-associated cell death (e.g., from oxidative stress or starvation). C3 stores were notably increased within AECs in lung tissues from individuals with different end-stage lung diseases. Thus, at-risk cells furnish C3 through biosynthesis and/or uptake to increase locally available C3 during inflammation, while intracellularly, these stores protect against certain inducers of cell death. These results establish the relevance of intracellular C3 to airway epithelial biology and suggest novel pathways for complement-mediated host protection in the airway.

Keywords: anaphylatoxins; chronic obstructive pulmonary disease; cystic fibrosis; interstitial lung disease; oxidants.


Figures

Figure 1.
Figure 1.
Schematic representation of native C3 and C3(H2O). C3 is a two-chain protein consisting of an α-chain and a β-chain linked by a disulfide bond. The thioester bond on the α-chain allows C3 to covalently attach to a target. Upon activation via a protease or a specific C3 convertase, C3a is released (the arrow shows the cleavage site) and C3b attaches to a nearby target via an ester or amide bond. Constitutively, there is a low-grade spontaneous tickover in the blood where the hydroxyl group (−OH) from H2O reacts with the thioester, forming C3(H2O). In this case, C3a remains attached. Adapted from Reference .
Figure 2.
Figure 2.
Human airway epithelial cells contain stores of intracellular C3. (A) Representative confocal-microscopic images of permeabilized BEAS-2B (upper panel) and primary human tracheal epithelial cells (hTECs, lower panel) cultured in C3-free media. Control: chicken IgY. Primary antibody: chicken anti-C3. Representative of five independent experiments for each cell type. A different secondary antibody (Alexa 647, red) was used in the lower panel to address any concerns associated with autofluorescence in the upper panel with Alexa 488 (green). DAPI (blue), ×400. (B) C3 is predominantly intracellular in both the BEAS-2B cells (upper panel) and hTECs (lower panel) by flow cytometry. Antibody: chicken anti-human C3. Representative of three independent experiments for each cell type. CRISPR-induced C3KO cells were used as a control for both BEAS-2B cells and hTECs. The x-axis is the geometric mean fluorescent intensity of C3. The y-axis is modal, which scales all channels as a percentage of the maximum count. (C) C3 analysis of lysates from BEAS-2B cell lines—wild-type (WT) and a C3-deficient clone (C3KO1; see Figure E2A)—under nonreducing (NR) conditions using Western blotting (WB). Equivalent amounts of cell lysates (Bradford assay) were used for WB. The blot shows that C3 is absent in the CRISPR-induced C3KO clones. Positive control: C3, 50 ng (lane 1). The numbers represent lysates prepared from cells growing in three different wells for each condition. (D) C3 analysis of lysates from hTECs under NR (left) and reducing (R, right) conditions by WB. C3, 40 ng (left), 20 ng (right). Lanes 3 and 4 are longer exposures (10 min) of lanes 1 and 2 (5 min). Representative of three independent experiments. This antibody binds more strongly to the NR form of C3 than to its α- or β-chains, as demonstrated in this image. (E) C3 analysis of hTEC subcellular fractions using WB. Cytoplasmic (CYT), membrane (MEM), nuclear (NUC), chromatin (CHR), and cytoskeletal (CSK) fractions were obtained; 1 × 105 cell equivalents/lane were loaded for the CYT and MEM fractions, and 2 × 105 cell equivalents/lane were loaded for the others. Serum-free supernatant (SN) was collected after 24 hours and concentrated five-fold. Lysate (LYS) was loaded to serve as a comparator on the left. C3, 60 ng. Representative of three independent experiments. (F) Colocalization of intracellular C3 (green) and markers of the endoplasmic reticulum (ER; red, calnexin) and late endosomes (red, Rab7, arrows, magnified inset) in hTECs cultured in C3-free conditions. DAPI (blue), original magnification, ×630. Mr = relative molecular mass.
Figure 3.
Figure 3.
Intracellular C3 is upregulated by proinflammatory stimuli. (A) C3 analysis of lysates from BEAS-2B cells under NR conditions by WB. Cells were incubated in the presence of serum-free media with increasing doses of cytomix (a combination of TNF-α, IFN-γ, and IL-1β; lanes 2–5), and with 25 ng/ml for increasing durations of time (2, 4, and 8 h). C3, 60 ng. Representative of three independent experiments. (B) C3 analysis of lysates from hTECs under NR conditions by WB. Cells were treated in a manner similar to that described in A, with or without 25 ng/ml of cytomix for 24 hours (or each individual cytokine at the same dose). Graphical representation based on densitometric scanning from WB (representative blot; Figure E2A). Shown is the mean ± SEM of two independent experiments. All three cytokines increased C3 significantly over nonstimulated (NS) cells (*P < 0.05, ***P < 0.0001 by t test), but the highest increase occurred with the cytomix (**P < 0.01). (C) Confocal-microscopic images showing an increase in intracellular C3 (red) in BEAS-2B cells (upper panel) and hTECs (lower panel) after stimulation with 50 ng/ml of cytomix for 24 hours. DAPI (blue), original magnification, ×630. Representative of three independent experiments. C3 did not colocalize with the nucleus (Figure E3B). (D) C3 analysis of hTEC subcellular fractions (prepared in a manner similar to that described in Figure 2E) at rest (NS) and after exposure to 50 ng/ml of cytomix (S) for 24 hours. C3, 50 ng. CYT, MEM: 2 × 105 cell equivalents/lane loaded; other fractions: 4 × 105 cell equivalents/lane loaded. Bands running at 130–150k likely represent proteolytic fragments. Representative of two independent experiments. (E) Representative confocal microscopy of hTECs demonstrating that upon exposure to 50 ng/ml of cytomix for 24 hours, intracellular C3 (red) increases and colocalizes primarily with the ER (calnexin) and the late endosomes (Rab7). C3 in early endosomes (Rab5) is unchanged. DAPI (blue). Original magnification, ×630.
Figure 4.
Figure 4.
C3 is secreted by airway epithelial cells and increases upon cytokine exposure. (A) C3 analysis of SN from BEAS-2B cells were incubated with serum-free media alone, media plus cytomix (25 ng/ml), or media with each of the individual components of the cytomix at 25 ng/ml. SN was collected after 24 hours, concentrated 10-fold, and analyzed by WB. Antibody: rabbit anti-C3a (to identify that the C3a fragment is attached to the secreted protein). C3, 50 ng. (B) C3 analysis of serum-free SN from the BEAS-2B cells before (NS) and after stimulation (S) with 25 ng/ml cytomix. SN was concentrated 20-fold and analyzed by WB. Increasing amounts of SN were used to estimate the quantity of C3 per 100,000 cells secreted over a 24-hour period. (C) Undifferentiated hTECs cultured on Transwells in serum-free media were treated on the apical (Ap) or basal (Ba) surface with 25 ng/ml of a cytomix combination for 24 hours. The media from each chamber was then collected, concentrated 10-fold, and analyzed for C3 under NR conditions using WB (goat anti-C3). Purified C3, 50 ng. Left: representative immunoblot. (D) Graphical representation of C based on densitometric scanning of WB. Shown is the mean ± SEM of three independent experiments. *P < 0.05, **P < 0.01 when comparing apical versus basal for each condition.
Figure 5.
Figure 5.
C3 is taken up by airway epithelial cells. (A) C3 analysis using WB of lysate from a CRISPR-induced C3KO clone. C3KO2 cells were incubated without (lanes 2–4) and with 10% normal human serum (NHS) for 15 minutes (lanes 5–7), after which the cells were washed with PBS and lysed. Equivalent amounts of cell lysates (Bradford assay) were used. The blot shows that C3 is absent in the CRISPR-induced C3KO clones. Positive control: C3, 50 ng (lane 1). The numbers represent lysates prepared from cells growing in three different wells for each condition. See Figure 2C for C3KO1. (B) hTEC lysates (L) incubated with either 10% C3-depleted (C3 dp) serum or 10% NHS for 15 minutes were analyzed for C3 under both NR and R conditions using WB. C3, 50 ng (lane 1) and 100 ng (lane 6), C3b, 100 ng (lane 7). C3b has an α′-chain that runs at a lower Mr (106k) than the C3α-chain (115k). The figure is from a single blot in which lanes relevant to the experiment have been selected. Lanes 4–7 represent a longer exposure (20 min) of the same blot, as those were done under R conditions. The antibody binds the α′ fragment of C3b better than the α-chain of C3. (C) C3 analysis of subcellular fractions (prepared in a manner similar to that described in Figure 2E). hTECs were incubated with either serum-free media alone (−) or media + 10% NHS (+) for 15 minutes. CYT, MEM: 1.25 × 105 cell equivalents/lane loaded; other fractions: 2.5 × 105 cell equivalents/lane loaded. C3, 50 ng. Lanes 5 and 8 contain only PBS to avoid the possibility of spillover. Bands running at 130–150k likely represent proteolytic fragments. Representative of two independent experiments. (D) CRISPR-induced C3KO clones that were incubated with either serum-free media alone (−) or media + 10% NHS (+) for 15 minutes. CYT, MEM: 2.5 × 105 cell equivalents/lane loaded; other fractions: 5 × 105 cell equivalents/lane loaded. C3, 50 ng. Representative of two experiments using distinct clones (C3KO1 and C3KO2).
Figure 6.
Figure 6.
C3 taken up by airway epithelial cells mitigates stress-induced cell death. (A–C) BEAS-2B cells were grown to confluence in a 12-well plate and treated with either serum-free media or H2O2 (500 μM) for 60 minutes, washed, and incubated with 10% C3 dp serum, 10% NHS, C3 dp serum + C3 (15 μg/ml), or C3 dp serum + C3-methylamine (C3-MA, 15 μg/ml) for 3 hours. The proportion of live cells (Q4) and dead cells (Q2 + Q3) was determined using annexin (x-axis) and propidium iodide (PI, y-axis) staining by flow cytometry. (A and B) Graphs represent the mean ± SEM of three to five replicates for each condition. (C) Representative flow-cytometry plots for each condition. (D–F) To evaluate whether the cytoprotective effect of C3 extends beyond H2O2-induced cell death, a growth factor deprivation model was used. BEAS-2B cells were grown to confluence in a 12-well plate and incubated with Earle’s balanced salt solution (EBSS) for 4 hours in the absence or presence of 10% C3 dp serum, 10% NHS, or C3 (15 μg/ml). (D and E) Graphs represent the mean ± SEM of two or three replicates for each condition. (F) Representative flow-cytometry plots for each condition. *P < 0.05, **P < 0.01. Representative of three independent experiments.
Figure 7.
Figure 7.
Intracellular complement protein C3 is upregulated in end-stage lung disease. (A–D) Representative confocal-microscopic images of formalin-fixed paraffin-embedded sections of lung tissue from control subjects without disease (A) and patients with end-stage cystic fibrosis (CF, B), idiopathic pulmonary fibrosis (IPF, C), or chronic obstructive pulmonary disease (COPD, D) that were stained for C3 (green). Control samples were obtained from donors without CF, IPF, or COPD using lung explants that were otherwise not usable for transplantation and excess lung tissue that was resected for downsizing. Representative images of three different individuals for each disease (Figure E5). Original magnification, ×400; scale bars: 50 μM for each figure. Images from the three sections are comparable because they were obtained in identical conditions (at the same time and the same exposure, and including an isotype control). Arrows denote the epithelium in the magnified inset, and the asterisk denotes the subepithelial/submucosal space. DAPI (blue) intensity was globally adjusted for all images.

References

    1. Elvington M, Liszewski MK, Atkinson JP. Evolution of the complement system: from defense of the single cell to guardian of the intravascular space. Immunol Rev. 2016;274:9–15. - PMC - PubMed
    1. Ricklin D, Reis ES, Mastellos DC, Gros P, Lambris JD. Complement component C3—the “Swiss Army Knife” of innate immunity and host defense. Immunol Rev. 2016;274:33–58. - PMC - PubMed
    1. Ram S, Lewis LA, Rice PA. Infections of people with complement deficiencies and patients who have undergone splenectomy. Clin Microbiol Rev. 2010;23:740–780. - PMC - PubMed
    1. Lavoie EG, Wangdi T, Kazmierczak BI. Innate immune responses to Pseudomonas aeruginosa infection. Microbes Infect. 2011;13:1133–1145. - PMC - PubMed
    1. Circolo A, Garnier G, Fukuda W, Wang X, Hidvegi T, Szalai AJ, et al. Genetic disruption of the murine complement C3 promoter region generates deficient mice with extrahepatic expression of C3 mRNA. Immunopharmacology. 1999;42:135–149. - PubMed

Publication types