. 2019 Feb;33(2):1873-1886.
doi: 10.1096/fj.201801176R. Epub 2018 Aug 29.

Stat3 is indispensable for damage-induced crypt regeneration but not for Wnt-driven intestinal tumorigenesis

Affiliations

Stat3 is indispensable for damage-induced crypt regeneration but not for Wnt-driven intestinal tumorigenesis

Hiroko Oshima et al. FASEB J. 2019 Feb.

Abstract

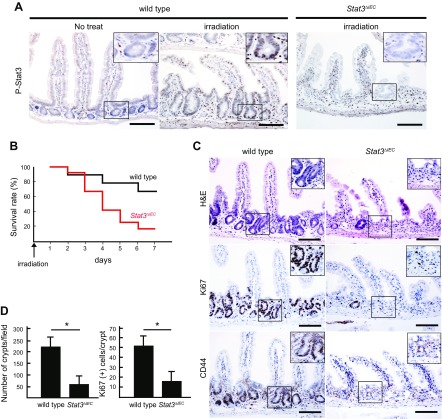
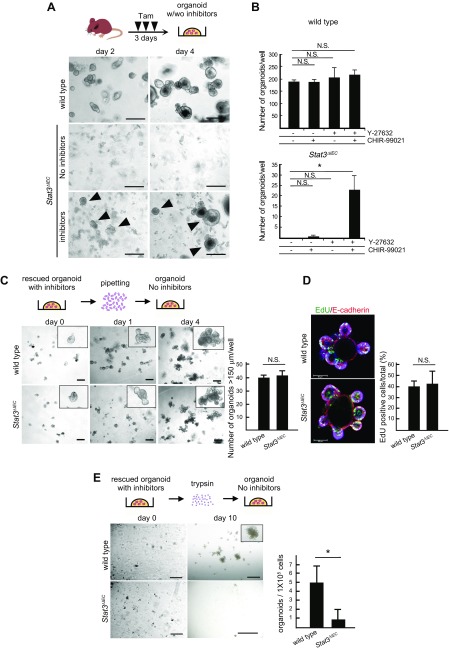
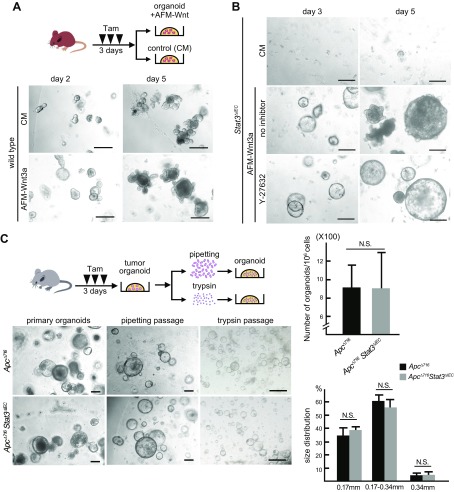
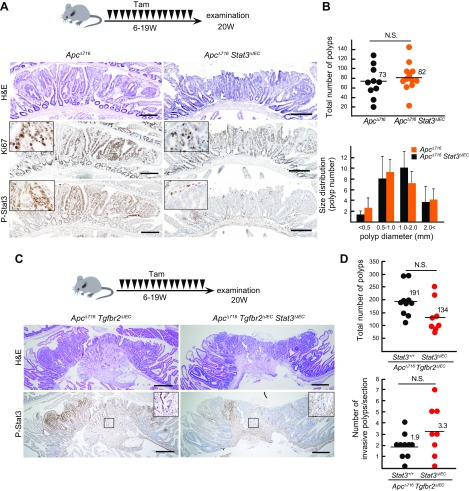
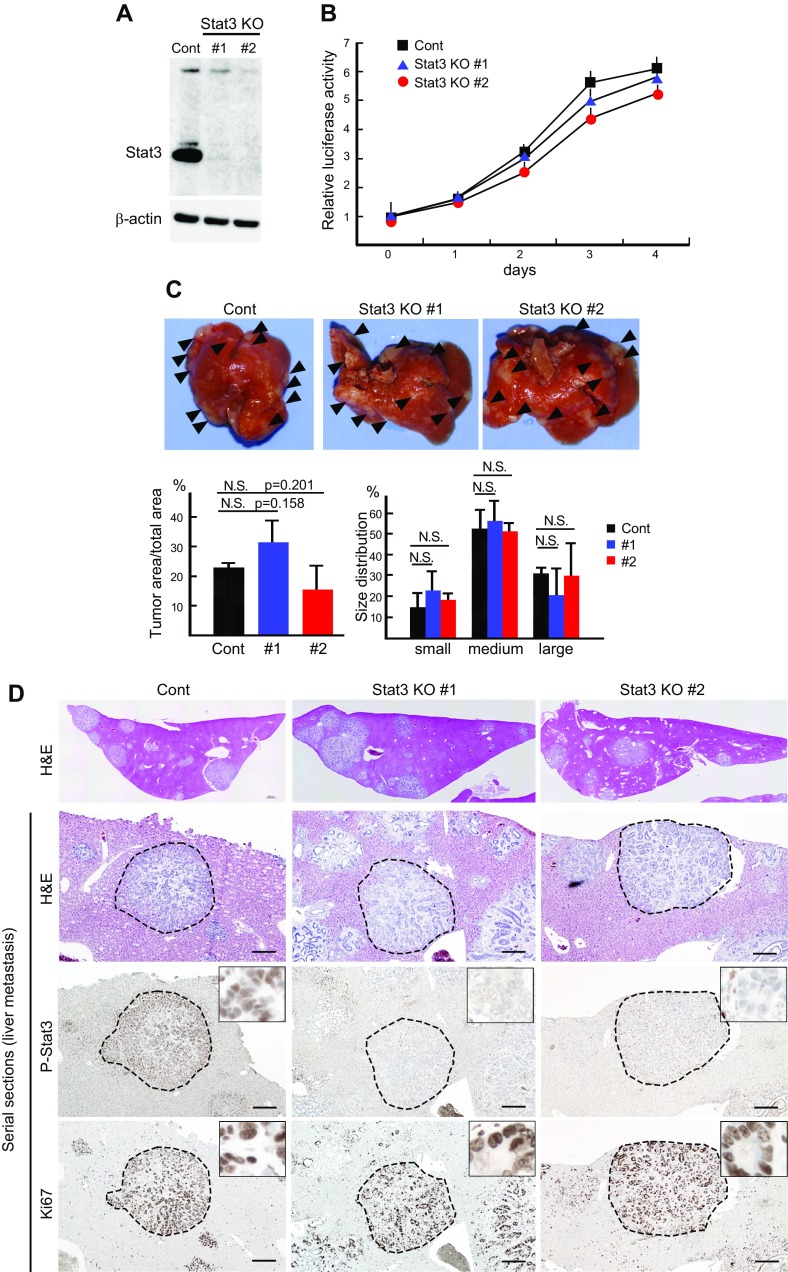
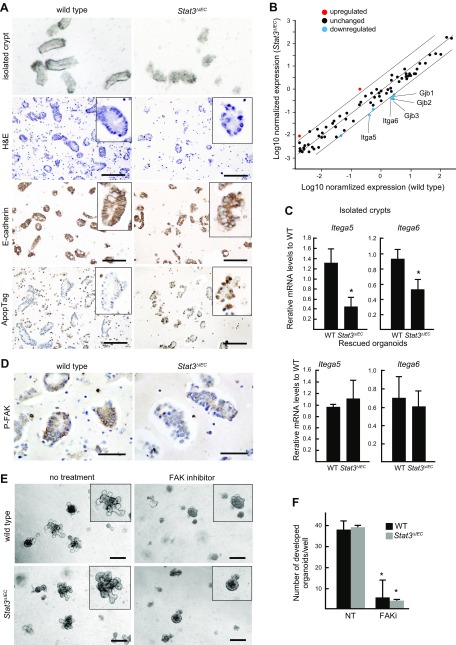
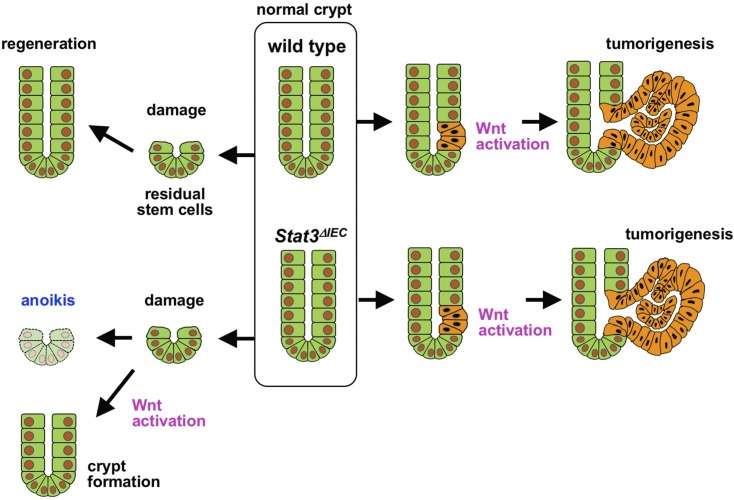
Signal transducer and activator of transcription 3 (Stat3) has been shown to play a role in intestinal regeneration and colitis-associated colon carcinogenesis. However, the role of Stat3 in the Wnt-driven sporadic intestinal tumorigenesis remains poorly understood. We examined the roles of Stat3 in intestinal regeneration and tumorigenesis by organoid culture experiments using Stat3∆IEC mouse-derived intestinal epithelial cells in which Stat3 was disrupted. The regeneration of intestinal mucosa and organoid formation were significantly suppressed by Stat3 disruption, which was compensated by Wnt activation. Furthermore, once organoids were recovered, Stat3 was no longer required for organoid growth. These results indicate that Stat3 and Wnt signaling cooperatively protect epithelial cells at the early phase of intestinal regeneration. In contrast, intestinal tumorigenesis was not suppressed by Stat3 disruption in adenomatous polyposis coli ( Apc) Δ716 and Apc∆716 Tgfbr2∆IEC mice, thus indicating that Stat3 is not required for Wnt activation-driven intestinal tumorigenesis. Mechanistically, Itga5 and Itga6 were down-regulated by Stat3 disruption, and focal adhesion kinase (FAK) activation was also suppressed. Notably, FAK inhibitor suppressed the organoid formation of wild-type epithelial cells. These results indicate that Stat3 is indispensable for the survival of epithelial cells through the activation of integrin signaling and the downstream FAK pathway; however, it is not required for the Wnt signaling-activated normal or tumor epithelial cells.-Oshima, H., Kok, S.-Y., Nakayama, M., Murakami, K., Voon, D. C.-C., Kimura, T., Oshima, M. Stat3 is indispensable for damage-induced crypt regeneration but not for Wnt-driven intestinal tumorigenesis.

Keywords: FAK; anoikis; colon cancer; integrin; organoids.


Conflict of interest statement

The authors thank M. Watanabe, A. Tsuda, and Y. Jomen (Division of Genetics, Cancer Research Institute, Kanazawa University) for their technical assistance. This study was supported by the Japan Agency for Medical Research and Development–Core Research for Evolutional Science and Technology (AMED–CREST) (JP17gm0410014) and AMED (JP17ck0106259); and Grants-in-Aid for Scientific Research (A) (JP18H04030) and (C) (JP16K07111) from the Ministry of Education, Culture, Sports, Science, and Technology of Japan; Takeda Science Foundation; and Mitsubishi Foundation. The authors declare no conflicts of interest.

Figures

Figure 1
Figure 1
Histologic analysis of X-ray–irradiated mouse small intestine. A) Representative sections immunohistochemically stained for P-Stat3 in small intestine of control WT and irradiated WT and irradiated Stat3ΔIEC mice. Scale bars, 100 μm. Insets indicate enlarged images of boxed areas. B) Survival rate of WT and Stat3ΔIEC mice after X-ray irradiation (n = 9 for WT and n = 12 for Stat3∆IEC mice). C) Representative histology sections from WT (left) and Stat3ΔIEC (right) mouse intestines (H&E) (top) and immunohistochemical staining for Ki-67 (middle) and CD44 (bottom). Insets show enlarged image views of boxed areas. Scale bars, 100 μm. D) Number of crypts in microscopy fields (left) and Ki-67–positive cells per crypt (right) are shown (means ± sd). *P < 0.05.
Figure 2
Figure 2
Role of Stat3 in organoid formation from intestinal crypts. A) Schematic illustration of Tam treatment and organoid formation (top). Representative microscopic photographs of organoid cultures of intestinal crypts of WT and Stat3ΔIEC mice on d 2 (left) and d 4 (right). Arrowheads indicate organoids rescued by inhibitors (Y-27632 and CHIR-99021). Scale bars, 250 μm. B) Numbers of organoids per well developed from intestinal crypts of WT (top) and Stat3ΔIEC mice (bottom) in indicated inhibitor conditions (means ± sd). *P < 0.05. Inhibitor treatment experiments were performed 3 times for each mouse genotype. C) Schematic illustration of organoid passaging by mechanical pipetting (top). Representative microscopic photographs of organoids passaged from WT and Stat3ΔIEC rescued organoids (bottom). Insets show enlarged views. Scale bars, 250 μm. Numbers of organoids >150 µm are shown in bar graph (means ± sd). Mechanical passage experiments were performed 3 times. D) Immunohistochemical staining of WT (top) and Stat3ΔIEC (bottom) rescued organoids for EdU (green) and E-cadherin (red). EdU labeling efficiency is shown in bar graph (means ± sd). Scale bars, 50 μm. E) Schematic illustration of organoid passaging by trypsin treatment (top). Representative microscopic photographs of organoids passaged from WT (top) and Stat3ΔIEC-rescued organoids (bottom). Scale bars, 200 μm (d 0) and 1 mm (d 10). Numbers of organoids are shown in bar graph (means ± sd). *P < 0.05. Enzymatic passage experiments were performed 3 times. N.S., not significant.
Figure 3
Figure 3
Wnt activation compensates for Stat3 disruption to support organoid formation. A) Schematic illustration of Tam treatment and organoid formation (top). Representative microscopic photographs of organoids of intestinal crypts from WT mice cultured with control medium (top) and AFM-Wnt3a (bottom) on d 2 (left) and d 5 (right). Scale bars, 250 μm. B) Representative microscopic photographs of organoid cultures of intestinal crypts from Stat3ΔIEC mice cultured with control medium (top), AFM-Wnt3a without inhibitor (middle), and with inhibitor (bottom) on d 3 (left) and d 5 (right). Scale bars, 250 μm. C) Schematic illustration of Tam treatment, tumor-derived organoid formation, and treatment with pipetting or trypsin to passage (top). Representative photomicrographs of primary organoids (left; scale bars, 250 μm) and organoids passaged by pipetting (middle; scale bars, 250 μm), and trypsin treatment (right; scale bars, 500 μm) derived from intestinal tumors of ApcΔ716 simple mutant mice (top) and ApcΔ716 Stat3ΔIEC compound mice (bottom). Numbers of organoids (top) and size distributions (bottom) after passaging with trypsin treatment in respective genotype are shown in bar graphs (means ± sd). Experiments were performed 3 times.
Figure 4
Figure 4
Dispensable role of Stat3 in Wnt-driven intestinal tumorigenesis. A) Schematic illustration of Tam treatment of ApcΔ716 mice (n = 10) and Apc∆716 villin-CreER Stat3flox/flox mice (n = 12) (top). Representative histology sections of small intestinal tumors of ApcΔ716 mice (left) and ApcΔ716 Stat3ΔIEC mice (right) for H&E (top) and immunohistochemical staining for Ki-67 (middle) and phosphorylated Stat3 (P-Stat3) (bottom). Insets show enlarged views. Scale bars, 200 μm. B) Total numbers of polyps in each mouse are shown with dots with mean values (top). Size distribution is shown in bar graph (means ± sd). C) Schematic illustration of Tam treatment of ApcΔ716 villin-CreER Tgfbr2flox/flox mice (n = 10) and ApcΔ716 villin-CreER Tgfbr2flox/flox Stat3flox/flox mice (n = 8) (top). Representative histology sections of small intestinal tumor of ApcΔ716 Tgfbr2ΔIEC mice (left) and ApcΔ716 Tgfbr2ΔIEC Stat3ΔIEC mice (right) for H&E (top) and immunohistochemical staining for P-Stat3 (bottom). Insets show enlarged views of boxed areas. Scale bars, 400 μm. D) Total numbers of polyps (top) and invasive polyps (bottom) per section are shown with mean numbers.
Figure 5
Figure 5
Dispensable role of Stat3 in Wnt activation–associated cancer cell metastasis. A) Western blot results for Stat3 in control AKTP cells (Cont) and Stat3-targeted AKTP cell lines, Stat3 KO#1 and KO#2, by Crispr/Cas9. β-Actin was used for internal controls. B) Results of cell proliferation analysis of control and Stat3 KO#1 and KO#2 AKTP cells (means ± sd). C) Control AKTP cells (Cont) and Stat3-targeted AKTP cell lines (Stat3 KO#1 and KO#2) were transplanted to spleen of NOD/Shi-scid Il2rg−/− (NSG) mice (n = 3 for each cell line). Representative macroscopic photographs of mouse livers at 4 wk after spleen transplantation are shown (top). Arrowheads indicate metastatic foci. Mean metastasis tumor areas (bottom left) and size distribution of metastatic foci (bottom right) on histologic sections are shown in bar graphs (means ± sd). D) Representative low-power images of liver metastasis (H&E) (top) and high-power images of serial sections of metastatic foci with H&E and immunohistochemical staining for P-Stat3 and Ki-67 (from top to bottom). Dotted lines indicate metastatic foci for each genotype. Insets show enlarged views inside of metastatic foci. Scale bars, 200 μm.
Figure 6
Figure 6
Stat3-dependent integrin expression and FAK activation. A) Representative photographs of isolated crypts under dissection microscope, histologic section of isolated crypts (H&E), and immunohistochemical staining for E-cadherin and ApopTag (from top to bottom) of WT (left) and Stat3ΔIEC isolated intestinal crypts (right). Insets show enlarged views. Scale bars, 100 μm. B) Results of filter array expression analysis are shown in dot graph, which displays up-regulated (>4 fold) and down-regulated (<0.25 fold) genes in Stat3ΔIEC crypts in different colors. C) Relative mRNA levels in isolated crypts (top) and rescued organoids (bottom) (means ± sd) were examined by RT-PCR for Itga5 and Itga6. *P < 0.05. D) Isolated crypts from WT (left) and Stat3∆IEC mice (right) subjected to immunohistochemical staining for P-FAK. Scale bars, 50 μm. E) Representative microscopic photographs of organoids derived from WT (top) and Stat3∆IEC mouse (bottom) crypts in absence (left) or presence (right) of FAK inhibitor in Matrigel. Insets show enlarged views. Note that crypt growth was suppressed by FAK inhibitor regardless of genotype. Scale bars, 250 μm. F) Numbers of developed organoids (budding number >5) in Matrigel with or without FAK inhibitor (FAKi and NT, respectively) (means ± sd). *P < 0.05 vs. NT.
Figure 7
Figure 7
Schematic illustration of role of Stat3 in regeneration and tumorigenesis of intestinal crypts. WT (top) and Stat3ΔIEC crypts (bottom) are shown. Stat3 is required for regeneration from damaged mucosa, which may be compensated by Wnt activation (left). In contrast, Stat3 is dispensable for Wnt activation–driven tumorigenesis (right).

References

    1. Grivennikov, S. I., Greten, F. R., Karin, M. (2010) Immunity, inflammation, and cancer. Cell 140, 883–899 - PMC - PubMed
    1. He, G., Karin, M. (2011) NF-κB and STAT3—key players in liver inflammation and cancer. Cell Res. 21, 159–168 - PMC - PubMed
    1. Frank, D. A. (2007) STAT3 as a central mediator of neoplastic cellular transformation. Cancer Lett. 251, 199–210 - PubMed
    1. Roeser, J. C., Leach, S. D., McAllister, F. (2015) Emerging strategies for cancer immunoprevention. Oncogene 34, 6029–6039 - PMC - PubMed
    1. Kusaba, T., Nakayama, T., Yamazumi, K., Yakata, Y., Yoshizaki, A., Nagayasu, T., Sekine, I. (2005) Expression of p-STAT3 in human colorectal adenocarcinoma and adenoma; correlation with clinicopathological factors. J. Clin. Pathol. 58, 833–838 - PMC - PubMed

Publication types

LinkOut - more resources