Randomized Controlled Trial
. 2018 Aug 30;379(9):823-833.
doi: 10.1056/NEJMoa1715849.

Bacterial Factors That Predict Relapse after Tuberculosis Therapy

Affiliations
Randomized Controlled Trial

Bacterial Factors That Predict Relapse after Tuberculosis Therapy

Roberto Colangeli et al. N Engl J Med. .

Abstract

Background: Approximately 5% of patients with drug-susceptible tuberculosis have a relapse after 6 months of first-line therapy, as do approximately 20% of patients after 4 months of short-course therapy. We postulated that by analyzing pretreatment isolates of Mycobacterium tuberculosis obtained from patients who subsequently had a relapse or were cured, we could determine any correlations between the minimum inhibitory concentration (MIC) of a drug below the standard resistance breakpoint and the relapse risk after treatment.

Methods: Using data from the Tuberculosis Trials Consortium Study 22 (development cohort), we assessed relapse and cure isolates to determine the MIC values of isoniazid and rifampin that were below the standard resistance breakpoint (0.1 μg per milliliter for isoniazid and 1.0 μg per milliliter for rifampin). We combined this analysis with clinical, radiologic, and laboratory data to generate predictive relapse models, which we validated by analyzing data from the DMID 01-009 study (validation cohort).

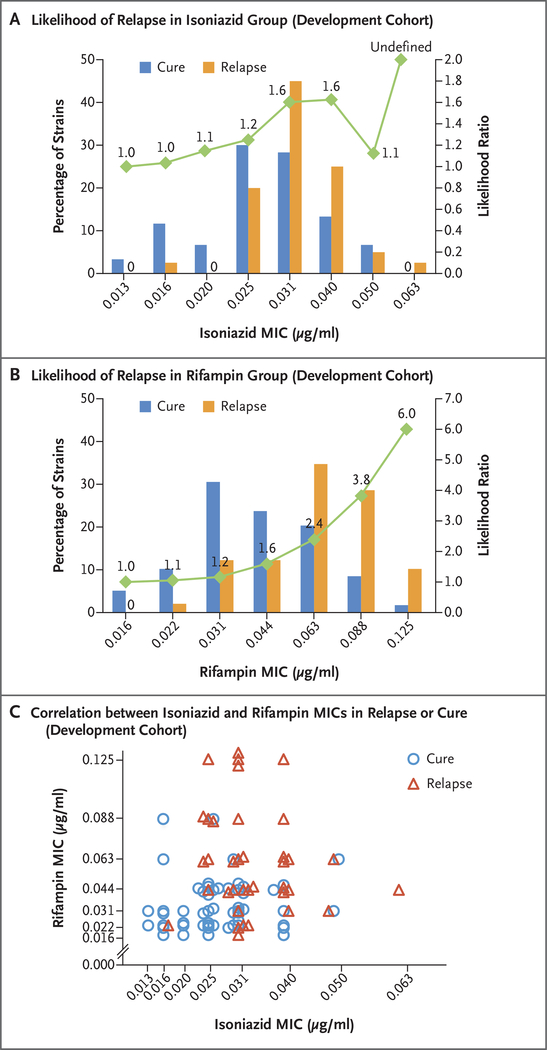
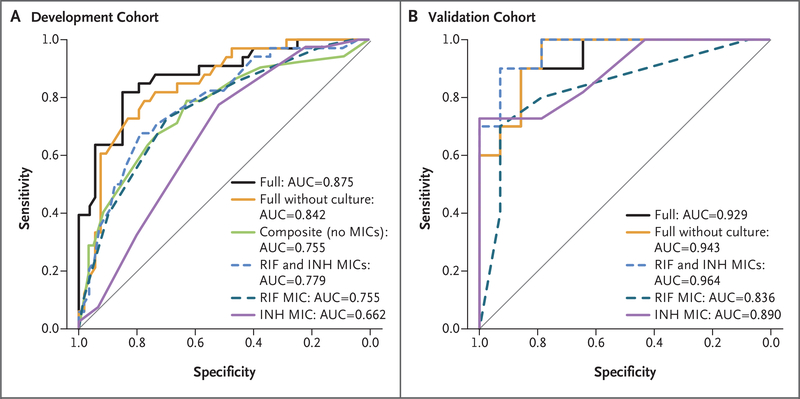
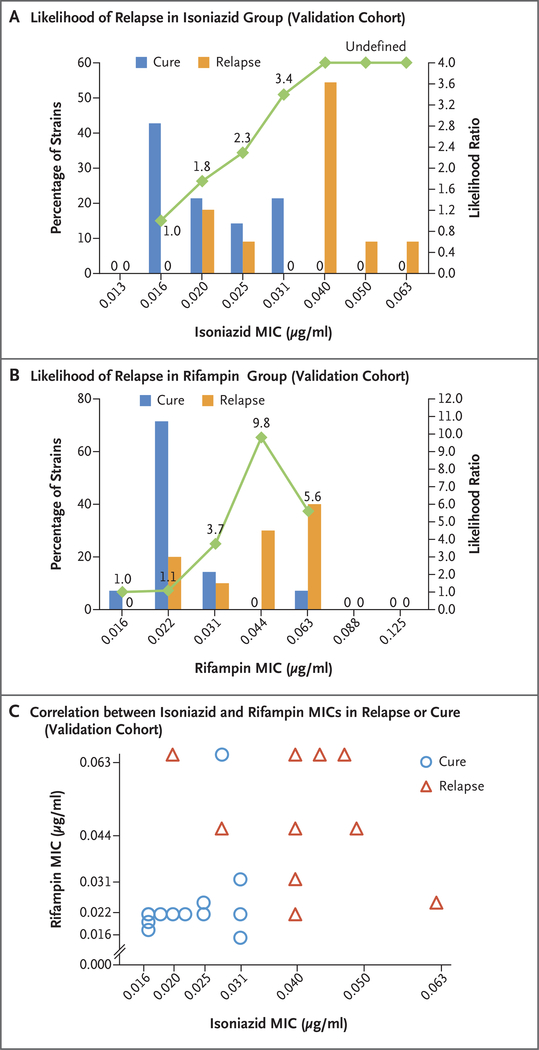
Results: In the development cohort, the mean (±SD) MIC of isoniazid below the breakpoint was 0.0334±0.0085 μg per milliliter in the relapse group and 0.0286±0.0092 μg per milliliter in the cure group, which represented a higher value in the relapse group by a factor of 1.17 (P=0.02). The corresponding MIC values of rifampin were 0.0695±0.0276 and 0.0453±0.0223 μg per milliliter, respectively, which represented a higher value in the relapse group by a factor of 1.53 (P<0.001). Higher MIC values remained associated with relapse in a multivariable analysis that included other significant between-group differences. In an analysis of receiver-operating-characteristic curves of relapse based on these MIC values, the area under the curve (AUC) was 0.779. In the development cohort, the AUC in a multivariable model that included MIC values was 0.875. In the validation cohort, the MIC values either alone or combined with other patient characteristics were also predictive of relapse, with AUC values of 0.964 and 0.929, respectively. The use of a model score for the MIC values of isoniazid and rifampin to achieve 75.0% sensitivity in cross-validation analysis predicted relapse with a specificity of 76.5% in the development cohort and a sensitivity of 70.0% and a specificity of 100% in the validation cohort.

Conclusions: In pretreatment isolates of M. tuberculosis with decrements of MIC values of isoniazid or rifampin below standard resistance breakpoints, higher MIC values were associated with a greater risk of relapse than lower MIC values. (Funded by the National Institute of Allergy and Infectious Diseases.).


Figures

Figure 1.
Figure 1.. MIC Values of Isoniazid and Rifampin and Treatment Outcomes in the Development Cohort.
Shown are the minimum inhibitory concentration (MIC) values of isoniazid (Panel A) and rifampin (Panel B) in Mycobacterium tuberculosis isolates obtained from patients in the development cohort, according to whether the patients were cured or had a relapse after the completion of treatment. The green curve indicates the likelihood ratios for a relapse for each MIC value shown. For MIC values at which no cure or relapse occurred, the absence is indicated by a zero. In Panel A, the likelihood ratio for the highest MIC value is undefined because there were no cures at this value. Panel C shows the MIC values of isoniazid and rifampin, according to cure or relapse status, in a subgroup of isolates in which the MIC values of both isoniazid and rifampin were known. Superimposed symbols have been slightly offset on the x and y axes for clarity.
Figure 2.
Figure 2.. Receiver-Operating-Characteristic (ROC) Curves for Relapse after Tuberculosis Treatment.
Shown are ROC curves in the development cohort (Panel A) and the validation cohort (Panel B). Curves are displayed for MIC values of isoniazid (INH) and rifampin (RIF) alone, for MIC values of isoniazid plus rifampin, and for the other models discussed below, as indicated. ROC curves are graphical plots that illustrate the performance of a binary classifier system as its discrimination threshold is varied. The curves were created by plotting the true positive rate against the false positive rate at various threshold settings. The area under the curve (AUC) that is shown in each plot summarizes the overall biomarker performance in a single number, with 0.5 indicating no difference from chance and 1.0 indicating a perfect biomarker with sensitivity and specificity both equal to 100%. The full model includes the following factors: MIC values of isoniazid and rifampin, cavitary disease on radiography, being underweight, and a positive 8-week sputum culture. The full model without culture results includes the same covariates as the full model with the exclusion of a positive 8-week sputum culture. The composite model includes the same covariates as the full model with the exclusion of the MIC values of isoniazid and rifampin.
Figure 3.
Figure 3.. MIC Values of Isoniazid and Rifampin and Treatment Outcomes in the Validation Cohort.
Shown are the MIC values of isoniazid (Panel A) and rifampin (Panel B), according to treatment outcome in the validation cohort, with corresponding likelihood ratios for relapse indicated. In Panel A, the likelihood ratios for the three highest MIC values are undefined because there were no cures at these values. For MIC values at which no cure or relapse occurred, such an absence is indicated by a zero. Panel C shows the MIC values of isoniazid and rifampin, according to cure or relapse status, in a subgroup of isolates for which the MIC values of both isoniazid and rifampin were known. Superimposed symbols have been slightly offset on the x and y axes for clarity.

Comment in

  • Of MICs and Men.
    Rubin EJ. Rubin EJ. N Engl J Med. 2018 Aug 30;379(9):882-883. doi: 10.1056/NEJMe1808564. N Engl J Med. 2018. PMID: 30157402 No abstract available.
  • Bacterial Factors and Relapse after Tuberculosis Therapy.
    Alsultan A, Ashkin D, Peloquin CA. Alsultan A, et al. N Engl J Med. 2019 Jan 10;380(2):197. doi: 10.1056/NEJMc1813645. N Engl J Med. 2019. PMID: 30628424 No abstract available.

References

    1. Lambert ML, Hasker E, Van Deun A, Roberfroid D, Boelaert M, Van der Stuyft P. Recurrence in tuberculosis: relapse or reinfection? Lancet Infect Dis 2003;3:282–7. - PubMed
    1. Merle CS, Fielding K, Sow OB, et al. A four-month gatifloxacin-containing regimen for treating tuberculosis. N Engl J Med 2014;371:1588–98. - PubMed
    1. Gillespie SH, Crook AM, McHugh TD, et al. Four-month moxifloxacin-based regimens for drug-sensitive tuberculosis. N Engl J Med 2014;371:1577–87. - PMC - PubMed
    1. Ukwaja KN, Alobu I, Lgwenyi C, Hopewell PC. The high cost of free tuberculosis services: patient and household costs associated with tuberculosis care in Ebonyi State, Nigeria. PLoS One 2013; 8(8):e73134. - PMC - PubMed
    1. Marks SM, Hirsch-Moverman Y, Salcedo K, et al. Characteristics and costs of multidrug-resistant tuberculosis in-patient care in the United States, 2005–2007. Int J Tuberc Lung Dis 2016;20:435–41. - PMC - PubMed

Publication types

MeSH terms