. 2018 Aug 28;24(9):2479-2492.e6.
doi: 10.1016/j.celrep.2018.07.084.

Metabolic and Transcriptional Modules Independently Diversify Plasma Cell Lifespan and Function

Affiliations

Metabolic and Transcriptional Modules Independently Diversify Plasma Cell Lifespan and Function

Wing Y Lam et al. Cell Rep. .

Abstract

Plasma cell survival and the consequent duration of immunity vary widely with infection or vaccination. Using fluorescent glucose analog uptake, we defined multiple developmentally independent mouse plasma cell populations with varying lifespans. Long-lived plasma cells imported more fluorescent glucose analog, expressed higher surface levels of the amino acid transporter CD98, and had more autophagosome mass than did short-lived cells. Low amino acid concentrations triggered reductions in both antibody secretion and mitochondrial respiration, especially by short-lived plasma cells. To explain these observations, we found that glutamine was used for both mitochondrial respiration and anaplerotic reactions, yielding glutamate and aspartate for antibody synthesis. Endoplasmic reticulum (ER) stress responses, which link metabolism to transcriptional outcomes, were similar between long- and short-lived subsets. Accordingly, population and single-cell transcriptional comparisons across mouse and human plasma cell subsets revealed few consistent and conserved differences. Thus, plasma cell antibody secretion and lifespan are primarily defined by non-transcriptional metabolic traits.

Keywords: cell respiration; endoplasmic reticulum stress; glucose metabolism; glutamine metabolism; glycosylation; hexosamine biosynthesis; immunoglobulin biosynthesis; plasma cells; single-cell RNA-sequencing.


Conflict of interest statement

DECLARATION OF INTERESTS

D.B. is a co-founder of Cloak Therapeutics and owns significant equity. A patent application related to the current work has been filed (PCT/US18/23288). G.J.P. is a scientific advisory board member for Cambridge Isotope Laboratories. R.M.N. is a paid consultant for Biocomposites, Cardinal Health; CardioMEMS; DePuy, A Johnson & Johnson Company; Integra Sciences; Medtronic; Smith & Nephew; and Wright Medical Technology, Inc. W.Y.L. is an employee of Amgen Inc.

Figures
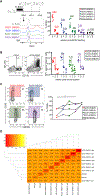
Figure 1.
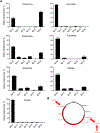
Figure 1.. Glucose Uptake Correlates with Long Half-Lives in Plasma Cell Subsets
(A) Mice were fed BrdU in the drinking water for 1 week and assessed for incorporation and retention at 0, 1, and 2 weeks post-BrdU withdrawal. Half-lives of each plasma cell population were calculated at weeks 1 and 2 of the chase period and are shown above each dataset. Data are cumulative from two independent experiments. Mean values ± SEM are shown. (B) Mice were immunized with NP-OVA, and antigenspecific plasma cells were assessed 1, 2, and 3 weeks thereafter. Example flow cytometric plots (left) and quantification (right) are shown from CD138-enriched cells and surface NP staining. Data are cumulative from two independent experiments. Mean values ± SEM are shown, as are the fold decreases relative to the previous time point. (C)Representative CD93 staining of each plasma cellsubset is shown to the left. Cumulative data from two independent experiments are shown to the right. Each data point represents cells from one mouse, and subsets from the same mouse are connected by lines. *p < 0.05, by paired one-way ANOVA with post hoc Tukey’s multiple comparisons test. (D)Heatmap showing percent clonal overlap betweenCDR3 nucleotide sequences of plasma cell populations. Plasma cell populations were sorted and immunoglobulin heavy chain VDJ sequences were amplified with common V region primers and either Cm- or pan-Cg-specific primers. Heatmap is derived from one individual mouse out of a total of three analyzed. Data from the remaining mice are shown in Figure S1.
Figure 2.
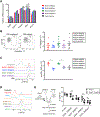
Figure 2.. Amino Acids Are Limiting for Plasma Cell Respiration and Antibody Secretion
(A)CD98 expression in plasma cell populations isshown as a representative plot (left) and quantified as mean fluorescence intensity (MFI) values to the right. Data are cumulative from two independent experiments, and each point represents cells from an individual mouse. Mean values ± SEM are shown. *p < 0.05, **p < 0.005, ***p < 0.0005 by oneway ANOVA with post hoc Tukey’s multiple comparisons test. (B)Autophagosome staining of plasma cell populations. Representative graph of autophagy blue staining (left) and quantification of MFI values cumulative from two experiments (right). Each data point represents cells from an individual mouse, and subsets from the same animal are connected by lines. *p < 0.05, **p < 0.005 by paired one-way ANOVA with post hoc Tukey’s multiple comparisons test. (C)Oxygen consumption rates of 2NBDG+ or 2NBDG cells cultured either in physiological media or media with supraphysiological concentration of amino acids. Data from the same experiment are connected by lines. *p < 0.05 by Student’s two-tailed paired t test. (D)Antibody secretion analysis of plasma cellpopulations cultured for 24 hr either in physiological media or media with supraphysiological concentrations of amino acids. *p < 0.05, ***p < 0.0005 by two-way ANOVA with post hoc Sidak’s multiple comparisons test.
Figure 3.
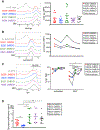
Figure 3.. Glutamine Catabolism Links Mitochondrial Function to Amino Acid Biosynthesis
(A) Liquid chromatography-mass spectrometry analysis of 13C enrichment in human bone marrow plasma cell intermediary metabolites. Plasma cells were cultured for 18 hr with uniformly labeled 13C-glutamine-containing media. Isotopologue distributions were corrected for natural abundance and isotope impurity. Mean values of four biological replicates ± SEM are shown. (B) Schematic of glutamine contribution to the TCA cycle in plasma cells. Red indicates intermediates in which glutamine-derived carbons are found.
Figure 4.
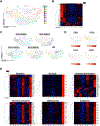
Figure 4.. ER Stress Responses Are Similar across Plasma Cell Subsets
(A)qRT-PCR analysis of ER stress response genesin plasma cell subsets. Data are cumulative from two individual experiments, each with three biological replicates of each plasma cell subset. Data are normalized to expression of HPRT. *p < 0.05, **p < 0.005, ***p < 0.0005, ****p < 0.00005 by twoway ANOVA with post hoc Sidak’s multiple comparisons test. (B)Caspase-12 activation in plasma cell populations. Plasma cell populations were sorted and labeled for 1 hr with the fluorescent caspase-12 inhibitor ATAD-FMK. Representative plots (left) and quantification (right) are shown, with each data point representing cells from an individual mouse. Mean values ± SEM are shown. No significant differences were observed using one-way ANOVA. (C)Flow cytometric representative plots (left) andquantification (right) of p-eIF2α mean fluorescence intensities (MFIs) in plasma cell subsets. *p < 0.05 by one-way ANOVA with post hoc Tukey’s multiple comparisons test. (D) Human bone marrow plasma cells were treatedwith inhibitors to PERK (4 nM GSK2606414), GCN2 (500 μM SP600125 or indirubin-3’-monoxime), HRI (50 μM hemin), or PKR (100 μM imidazole-oxindole C16) for 1 hr and analyzed for intracellular p-eIF2α. Plots of p-eIF2α representative of two independent experiments are shown. (E) Schematic representation of mixed bone marrow chimera experiment to assess plasma cell population dependence on PERK (left). CD45.2+ chimerism values are shown (right) and are cumulative from two experiments. Each symbol represents a distinct mouse. ****p < 0.00005 by two-way ANOVA with post hoc Sidak’s multiple comparisons test.
Figure 5.
Figure 5.. Plasma Cells with Diminished Glucose Uptake Maintain Translation Rates but Secrete Relatively Few Antibodies
(A) Representative plots (left) and quantification of mean fluorescence intensity (MFI) values (right) of total surface and intracellular Igk staining of splenic and bone marrow CD138+ plasma cells. Each point represents an individual mouse, and data are cumulative of three independent experiments. Mean values ± SEM are overlaid. No significant differences were observed by one-way ANOVA. (B) Mice were injected with puromycin and 2NBDG, and sacrificed 15 min later. Representative puromycin staining (left) and quantification of MFI values (right) of splenic and bone marrow plasma cells are shown. Data are from one representative experiment of three total. Each point represents an individual mouse, and subsets from the same mouse are linked by lines. No significant differences were observed by paired one-way ANOVA. (C) Plasma cell populations were sorted and cultured for 24 hr with or without protein translation inhibitor cycloheximide. Representative total surface and intracellular Igk staining (left) and quantification (right) of splenic and bone marrow plasma cells. Each point represents an individual mouse, and data are cumulative of two independent experiments. Subsets from the same mouse are linked by lines. *p < 0.05, ***p < 0.0005, ****p < 0.00005 by paired two-way ANOVA with post hoc Sidak’s multiple comparisons test. (D) Antibody secretion measured by ELISA after overnight culture of plasma cell subsets from spleen and bone marrow. Each point represents a plasma cell subset from one individual mouse. *p < 0.05, **p < 0.005 by one-way ANOVA with post hoc Tukey’s multiple comparisons test. Data are cumulative from three independent experiments.
Figure 6.
Figure 6.. Transcriptional Profiles Are Similar between Plasma Cell Subsets
(A)RNA-seq analysis of gene transcript levels between B2202NBDG versus B2202NBDG+, B220+2NBDG versus B220+2NBDG+, or B2202NBDG versus BM. Volcano plots of gene expression fold changes between 2NBDG+ and 2NBDG populations are shown. Adjusted p values were calculated using DESeq2, with red and blue boxes representing genes that are significantly upregulated or downregulated, respectively, in 2NBDG+ cells. Each dot represents a single gene. Three biological replicates were analyzed for each population. (B)Venn diagram analysis of common transcripts either upregulated (left) or downregulated (right) in 2NBDG+ populations. (C)RNA-seq analysis of gene transcript levels between human CD19+ short-lived plasma cells (SLPCs) and CD19 long-lived plasma cells (LLPCs). Volcano plot analysis of differential transcript expression between human LLPCs and SLPCs is shown. Each dot represents a single gene. Four biological replicates were analyzed for each population. Adjusted p values were calculated using DESeq2. Each dot represents a single gene. Four biological replicates were analyzed for each population. (D)Little overlap between overexpressed genes in 2NBDG+ murine and human long-lived plasma cell populations (top) or 2NBDG murine and human short-lived plasma cell populations (bottom). (E)Pathway analysis of genes downregulated in bone marrow plasma cells. Heatmap representation of genes and their expression across each biologicalreplicate of each plasma cell population. Color scale legend depicts row-normalized Z scores.
Figure 7.
Figure 7.. Plasma Cell Transcriptional Heterogeneity Is Defined by Proliferative Genes and Neutrophil Degranulation Pathways
(A) t-SNE analysis of single-cell RNA-seq data concatenated from all plasma cell subsets. Each data point represents one cell, and nine identified clusters are depicted in distinct colors. (B) All 352 genes were plotted that were statistically significantly and preferentially expressed by at least one cluster relative to the remaining population (adjusted p < 0.1, Benjamini-Hochberg test). Each gene and cluster were ordered and grouped based on average linkage and depicted in the corresponding dendrograms. Red indicates high relative expression, and blue indicates low expression, shown as row-normalized Z scores. (C) Data points from each plasma cell subset were overlaid as dark blue dots onto the concatenated t-SNE plot. (D) Expression of plasma cell marker genes aredepicted as a heatmap overlaid onto the concatenated t-SNE plot. (E) Pathway analysis of 352 significant clusterspecific genes. These genes were over-represented in translation, cell cycle, electron transport chain, ER protein processing, mRNA splicing, proteasome, and neutrophil degranulation pathways as analyzed using the Consensus Pathway database (q value < 105). Red indicates high relative expression, and blue indicates low expression, shown as row-normalized Z scores.

Similar articles

Cited by

References

    1. Amanna IJ, Carlson NE, and Slifka MK (2007). Duration of humoral immunity to common viral and vaccine antigens. N. Engl. J. Med 357, 1903–1915. - PubMed
    1. An M, Ryu DR, Won Park J, Ha Choi J, Park EM, Eun Lee K, Woo M, and Kim M (2017). ULK1 prevents cardiac dysfunction in obesity through autophagy-meditated regulation of lipid metabolism. Cardiovasc. Res 113, 1137–1147. - PubMed
    1. Aragon IV, Barrington RA, Jackowski S, Mori K, and Brewer JW (2012). The specialized unfolded protein response of B lymphocytes: ATF6a-independent development of antibody-secreting B cells. Mol. Immunol 51, 347–355. - PMC - PubMed
    1. Auner HW, Beham-Schmid C, Dillon N, and Sabbattini P (2010). The life span of short-lived plasma cells is partly determined by a block on activation of apoptotic caspases acting in combination with endoplasmic reticulum stress. Blood 116, 3445–3455. - PubMed
    1. Axten JM, Romeril SP, Shu A, Ralph J, Medina JR, Feng Y, Li WH, Grant SW, Heerding DA, Minthorn E, et al. (2013). Discovery of GSK2656157: an optimized PERK inhibitor selected for preclinical development. ACS Med. Chem. Lett 4, 964–968. - PMC - PubMed

Publication types