. 2018 Aug 29;18(1):126.
doi: 10.1186/s12862-018-1252-8.

Temperature responses of mutation rate and mutational spectrum in an Escherichia coli strain and the correlation with metabolic rate

Affiliations

Temperature responses of mutation rate and mutational spectrum in an Escherichia coli strain and the correlation with metabolic rate

Xiao-Lin Chu et al. BMC Evol Biol. .

Abstract

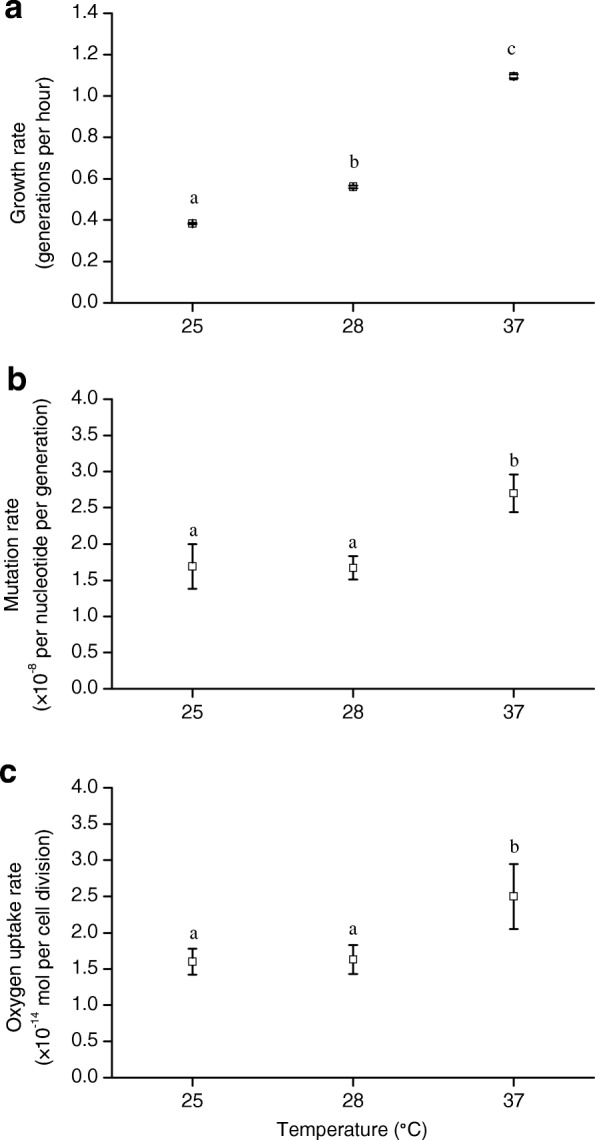
Background: Temperature is a major determinant of spontaneous mutation, but the precise mode, and the underlying mechanisms, of the temperature influences remain less clear. Here we used a mutation accumulation approach combined with whole-genome sequencing to investigate the temperature dependence of spontaneous mutation in an Escherichia coli strain. Experiments were performed under aerobic conditions at 25, 28 and 37 °C, three temperatures that were non-stressful for the bacterium but caused significantly different bacterial growth rates.

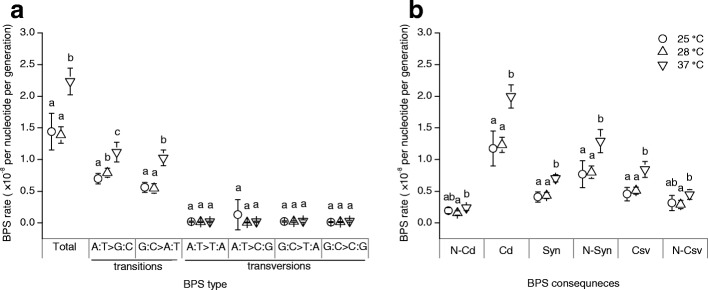
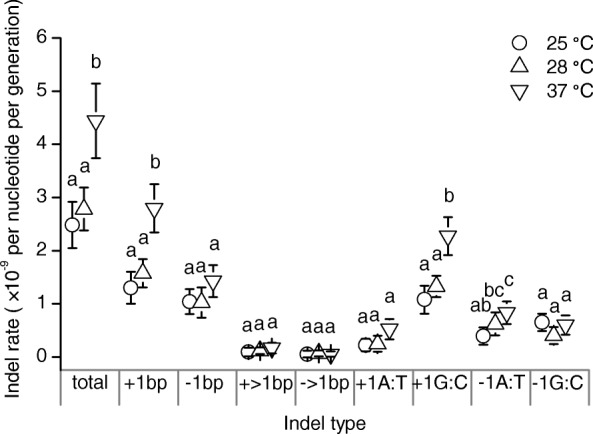
Results: Mutation rate did not differ between 25 and 28 °C, but was higher at 37 °C. Detailed analyses of the molecular spectrum of mutations were performed; and a particularly interesting finding is that higher temperature led to a bias of mutation to coding, relative to noncoding, DNA. Furthermore, the temperature response of mutation rate was extremely similar to that of metabolic rate, consistent with an idea that metabolic rate predicts mutation rate.

Conclusions: Temperature affects mutation rate and the types of mutation supply, both being crucial for the opportunity of natural selection. Our results help understand how temperature drives evolutionary speed of organisms and thus the global patterns of biodiversity. This study also lend support to the metabolic theory of ecology for linking metabolic rate and molecular evolution rate.

Keywords: Evolutionary speed hypothesis; Molecular evolution; Mutation accumulation; Mutation rate; Mutational spectrum; Oxidative DNA damage.


Conflict of interest statement

Ethics approval and consent to participate

Not applicable.

Consent for publication

Not applicable.

Competing interests

The authors declare that they have no competing interests.

Publisher’s Note

Springer Nature remains neutral with regard to jurisdictional claims in published maps and institutional affiliations.

Figures

Fig. 1
Fig. 1
Bacterial growth rate, mutation rate and metabolic rate at three temperatures. a Growth rate (sample size N = 20 colonies for each temperature). b Mutation rate (N = 20 lines for each temperature). c Metabolic rate (oxygen uptake rate; N = 14, 11, and 12 test agar plates at 25, 28 and 37 °C, respectively). In each panel, data show mean ± 95% CL, where the 95% CLs were given by multiplying SEMs by the critical value of the t distribution; and data points annotated with a same letter had no significant difference (Padj > 0.05; based on t tests, with P values from multiple comparisons between temperatures for each data set corrected using the Benjamini-Hochberg procedure)
Fig. 2
Fig. 2
Mutation rates of BPSs at three temperatures. a Rates of total, and the six types of, BPSs. b Rates of BPSs categorized based on consequences. Cd, coding; Csv, conservative; N-Cd, noncoding; N-Csv, non-conservative; N-Syn, nonsynonymous; Syn, synonymous. In each panel, data show mean ± 95% CL, where the 95% CLs were given by multiplying SEMs by the critical value of the t distribution. Within each category of BPSs, data points annotated with a same letter had no significant difference (Padj > 0.05; based on t tests, with P values from multiple comparisons between temperatures for each data set corrected using the Benjamini-Hochberg procedure)
Fig. 3
Fig. 3
Rates of indels at three temperatures. Bp, base pair. Data show mean ± 95% CL, where the 95% CLs were given by multiplying SEMs by the critical value of the t distribution. Within each category of indels, data points annotated with a same letter had no significant difference (Padj > 0.05; based on t tests, with P values from multiple comparisons between temperatures for each data set corrected using the Benjamini-Hochberg procedure)

Similar articles

Cited by

References

    1. Muller HJ. The measurement of gene mutation rate in Drosophila, its high variability, and its dependence upon temperature. Genetics. 1928;13:279–357. - PMC - PubMed
    1. Lindgren D. The temperature influence on the spontaneous mutation rate. Hereditas. 1972;70:165–178. doi: 10.1111/j.1601-5223.1972.tb01377.x. - DOI - PubMed
    1. Shigenaga MK, Gimeno CJ, Ames BN. Urinary 8-hydroxy-2′-deoxyguanosine as a biological marker of in vivo oxidative DNA damage. Proc Natl Acad Sci U S A. 1989;86:9697–9701. doi: 10.1073/pnas.86.24.9697. - DOI - PMC - PubMed
    1. Cheng KC, Cahill DS, Kasai H, Nishimura S, Loeb LA. 8-hydroxyguanine, an abundant form of oxidative DNA damage, causes G->T and A->C substitutions. J Biol Chem. 1992;267:166–172. - PubMed
    1. Martin AP, Palumbi SR. Body size, metabolic rate, generation time, and the molecular clock. Proc Natl Acad Sci U S A. 1993;90:4087–4091. doi: 10.1073/pnas.90.9.4087. - DOI - PMC - PubMed

Publication types

LinkOut - more resources