. 2018 Aug 29;18(1):18.
doi: 10.1186/s12861-018-0177-1.

Short term optical defocus perturbs normal developmental shifts in retina/RPE protein abundance

Affiliations

Short term optical defocus perturbs normal developmental shifts in retina/RPE protein abundance

Nina Riddell et al. BMC Dev Biol. .

Abstract

Background: Myopia (short-sightedness) affects approximately 1.4 billion people worldwide, and prevalence is increasing. Animal models induced by defocusing lenses show striking similarity with human myopia in terms of morphology and the implicated genetic pathways. Less is known about proteome changes in animals. Thus, the present study aimed to improve understanding of protein pathway responses to lens defocus, with an emphasis on relating expression changes to no lens control development and identifying bidirectional and/or distinct pathways across myopia and hyperopia (long-sightedness) models.

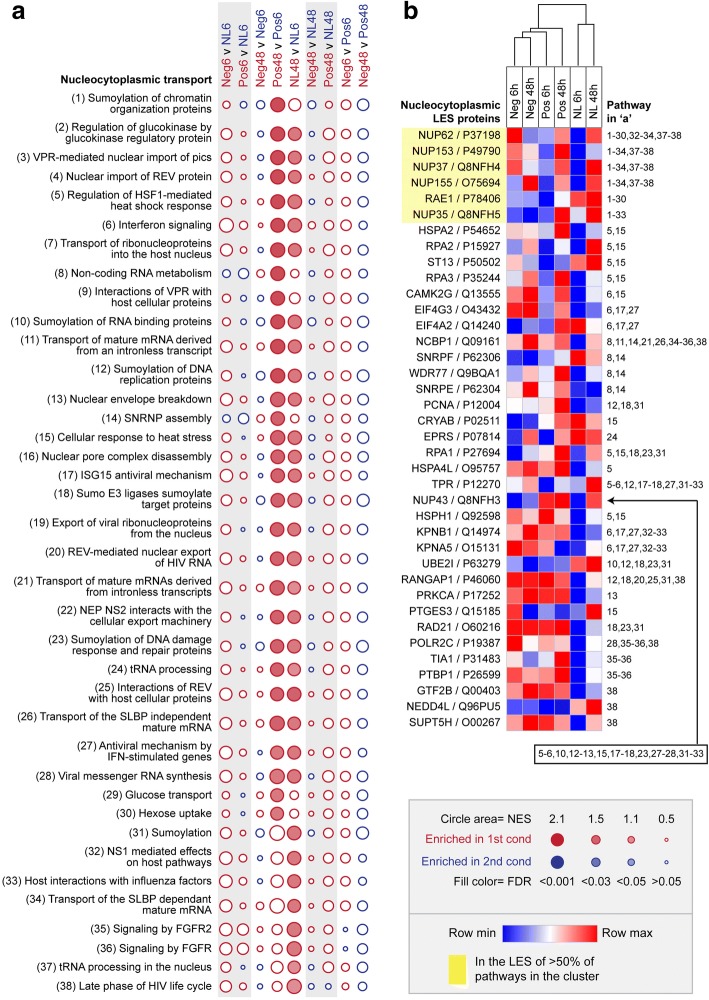
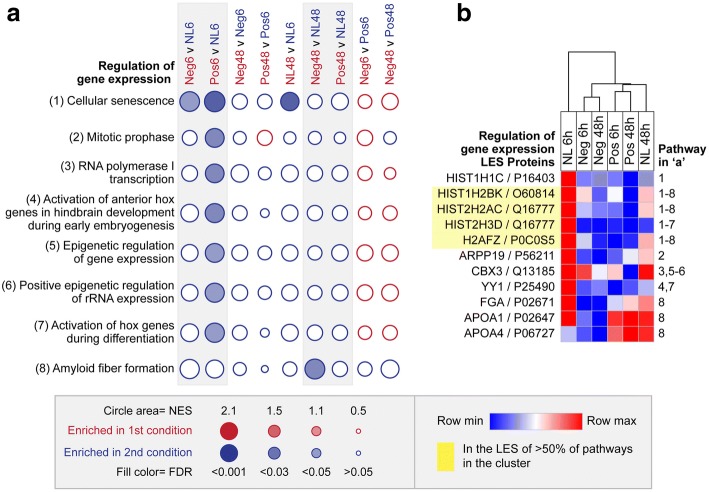
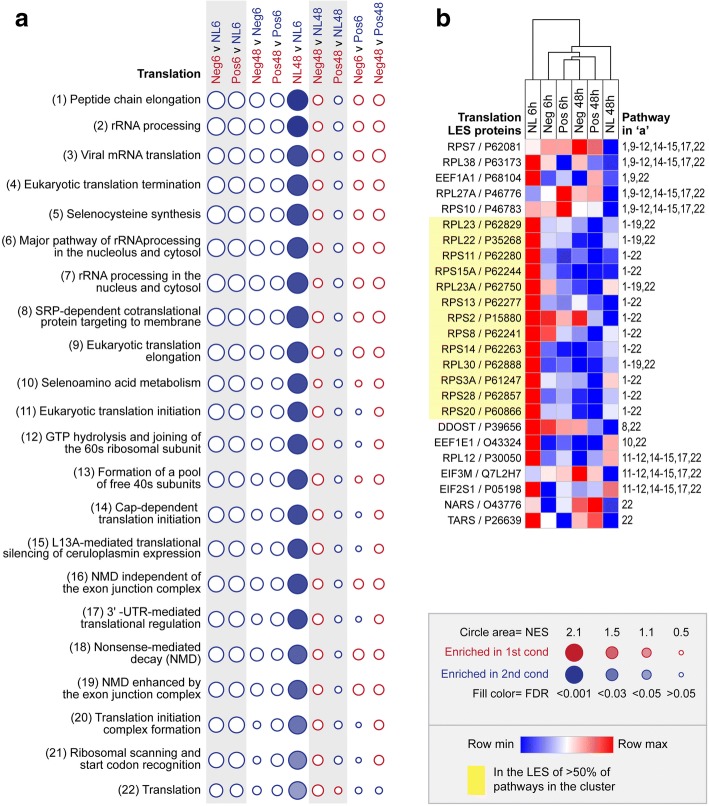
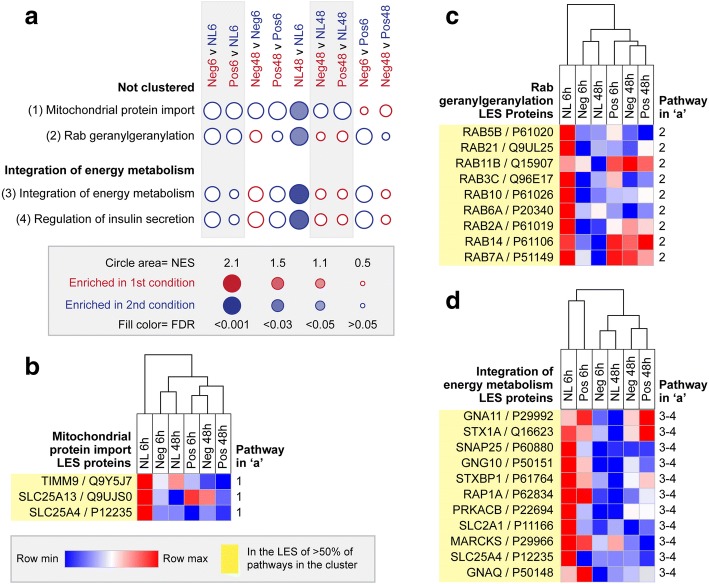
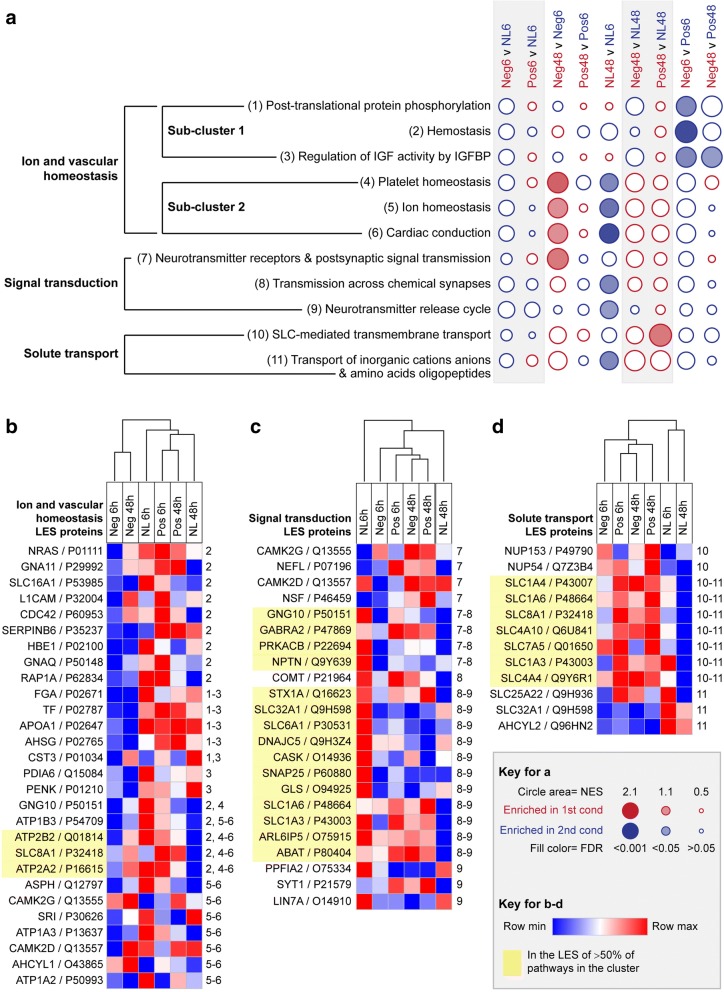
Results: Quantitative label-free proteomics and gene set enrichment analysis (GSEA) were used to examine protein pathway expression in the retina/RPE of chicks following 6 h and 48 h of myopia induction with - 10 dioptre (D) lenses, hyperopia induction with +10D lenses, or normal no lens rearing. Seventy-one pathways linked to cell development and neuronal maturation were differentially enriched between 6 and 48 h in no lens chicks. The majority of these normal developmental changes were disrupted by lens-wear (47 of 71 pathways), however, only 11 pathways displayed distinct expression profiles across the lens conditions. Most notably, negative lens-wear induced up-regulation of proteins involved in ATP-driven ion transport, calcium homeostasis, and GABA signalling between 6 and 48 h, while the same proteins were down-regulated over time in normally developing chicks. Glutamate and bicarbonate/chloride transporters were also down-regulated over time in normally developing chicks, and positive lens-wear inhibited this down-regulation.

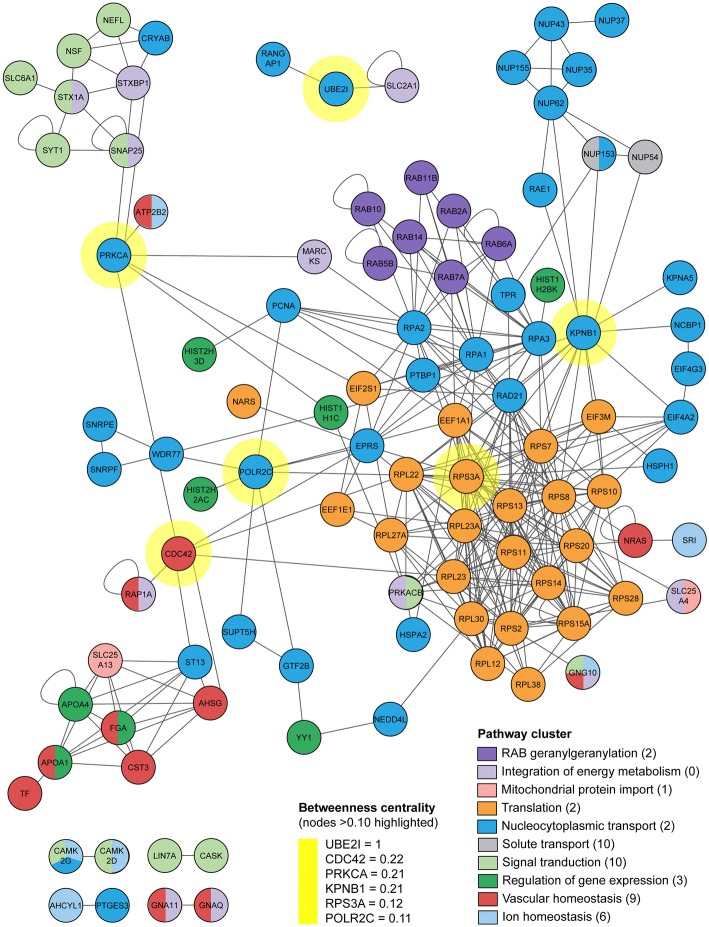
Conclusions: The chick retina/RPE proteome undergoes extensive pathway expression shifts during normal development. Most of these pathways are further disrupted by lens-wear. The identified expression patterns suggest close interactions between neurotransmission (as exemplified by increased GABA receptor and synaptic protein expression), cellular ion homeostasis, and associated energy resources during myopia induction. We have also provided novel evidence for changes to SLC-mediated transmembrane transport during hyperopia induction, with potential implications for signalling at the photoreceptor-bipolar synapse. These findings reflect a key role for perturbed neurotransmission and ionic homeostasis in optically-induced refractive errors, and are predicted by our Retinal Ion Driven Efflux (RIDE) model.

Keywords: Chick; Development; Emmetropization; Hyperopia; Mass spectrometry; Myopia; Neurotransmission; Proteomics.


Conflict of interest statement

Ethics approval

The protocols used in this study were approved by the La Trobe University Animal Ethics Committee under application number AEC14–60.

Consent for publication

Not applicable.

Competing interests

The authors declare that they have no competing interests.

Publisher’s Note

Springer Nature remains neutral with regard to jurisdictional claims in published maps and institutional affiliations.

Figures

Fig. 1
Fig. 1
Pathway enrichment in the nucleocytoplasmic transport cluster. a Bubble plot illustrating the normalized enrichment score (NES) and false discovery rate (FDR) across all pairwise comparisons for the thirty-eight enriched pathways in the ‘nucleocytoplasmic transport’ cluster. Statistically significant enrichments (FDR < 0.05) are shown as filled circles. b Heat map showing the mean label-free quantification (LFQ) intensity across lens conditions for all leading edge subset (LES) proteins contributing to the enrichment of one or more nucleocytoplasmic pathways. Note that the LES varied across pathways that were significantly enriched over time in both positive and no lens conditions. Full details of the LES for each comparison are provided in, Additional file 4 Figure S3
Fig. 2
Fig. 2
Pathway enrichment in the regulation of gene expression cluster. a Bubble plot illustrating the NES and FDR across all pairwise comparisons for the eight enriched pathways in the ‘regulation of gene expression’ cluster. Statistically significant enrichments (FDR < 0.05) are shown as filled circles. b Heat map showing the mean LFQ intensity across lens conditions for all LES proteins contributing to the enrichment of one or more pathways in the cluster. Note that, because the ‘cellular senescence’ pathway was significantly enriched across multiple pairwise comparisons, the LES varied depending on the comparison being made. Full details of the LES for each comparison are provided in, Additional file 4 Figure S4
Fig. 3
Fig. 3
Pathway enrichment in the translation cluster. a Bubble plot illustrating the NES and FDR across all pairwise comparisons for the twenty-two enriched pathways in the ‘translation’ cluster. Statistically significant enrichments (FDR < 0.05) are shown as filled circles. b Heat map showing the mean LFQ intensity across lens conditions for all LES proteins contributing to the enrichment of one or more pathways in the cluster
Fig. 4
Fig. 4
Pathway enrichment in mitochondrial protein import, rab GTPase, and integration of energy metabolism clusters. a Bubble plot illustrating the NES and FDR across all pairwise comparisons for the four enriched pathways in the ‘mitochondrial protein import’, rab GTPase and ‘integration of energy metabolism’ clusters. Statistically significant enrichments (FDR < 0.05) are shown as filled circles. Heat maps show the mean LQF intensity across lens conditions for all LES proteins contributing to the enrichment of one or more pathways in the b mitochondrial protein import, c rab GTPase and d integration of energy metabolism clusters
Fig. 5
Fig. 5
Pathway enrichment in ion and vascular homeostasis, signal transduction, and solute transport clusters. a Bubble plot illustrating the NES and FDR across all pairwise comparisons for the eight enriched pathways in the ‘ion and vascular homeostasis’, ‘signal transduction’, and ‘solute transport’ clusters. Statistically significant enrichments (FDR < 0.05) are shown as filled circles. Heat maps show the mean LFQ intensity across lens groups for all proteins that were in the LES of one or more enriched pathways in the b ion and vascular homeostasis, c signal transduction and d solute transport clusters. Note that the LES varied across pathways that were significantly enriched in multiple lens groups (i.e., several of the ion and vascular homeostasis pathways). Full details of the LES for each comparison are provided in, Additional file 4 Figure S5
Fig. 6
Fig. 6
Interactions between leading edge subset proteins. A protein-protein interaction (PPI) network for the LES proteins from all significant pathway enrichments was generated in Cytoscape. Proteins in the network are coloured according to pathway cluster from the GSEA, and connections between proteins indicate a protein-protein interaction. Topological analysis was used to identify proteins with a high degree of betweenness centrality (i.e., proteins that connect subnetworks within the interaction diagram). These key proteins are highlighted in yellow. LES proteins with no interactions are not shown in the diagram. The number of LES proteins not shown for each cluster is indicated in parenthesis after the cluster name in the ‘pathway cluster’ key

Similar articles

Cited by

References

    1. Holden BA, Fricke TR, Wilson DA, Jong M, Naidoo KS, Sankaridurg P, et al. Global prevalence of myopia and high myopia and temporal trends from 2000 through 2050. Ophthalmology. 2016;123(5):1036–1042. doi: 10.1016/j.ophtha.2016.01.006. - DOI - PubMed
    1. Flitcroft DI. The complex interactions of retinal, optical and environmental factors in myopia aetiology. Prog Retin Eye Res. 2012;31(6):622–660. doi: 10.1016/j.preteyeres.2012.06.004. - DOI - PubMed
    1. Saw SM, Gazzard G, Shih-Yen EC, Chua WH. Myopia and associated pathological complications. Ophthalmic Physiol Opt. 2005;25(5):381–391. doi: 10.1111/j.1475-1313.2005.00298.x. - DOI - PubMed
    1. Wong TY, Ferreira A, Hughes R, Carter G, Mitchell P. Epidemiology and disease burden of pathologic myopia and myopic choroidal neovascularization: an evidence-based systematic review. Am J Ophthalmol. 2014;157(1):9–25. doi: 10.1016/j.ajo.2013.08.010. - DOI - PubMed
    1. Buch H, Vinding T, La Cour M, Appleyard M, Jensen GB, Nielsen NV. Prevalence and causes of visual impairment and blindness among 9980 scandinavian adults: the Copenhagen city eye study. Ophthalmology. 2004;111(1):53–61. doi: 10.1016/j.ophtha.2003.05.010. - DOI - PubMed

Publication types

MeSH terms

LinkOut - more resources