. 2018 Aug 29;19(1):642.
doi: 10.1186/s12864-018-5012-3.

Transcriptome dynamics associated with resistance and susceptibility against fusarium head blight in four wheat genotypes

Affiliations

Transcriptome dynamics associated with resistance and susceptibility against fusarium head blight in four wheat genotypes

Youlian Pan et al. BMC Genomics. .

Abstract

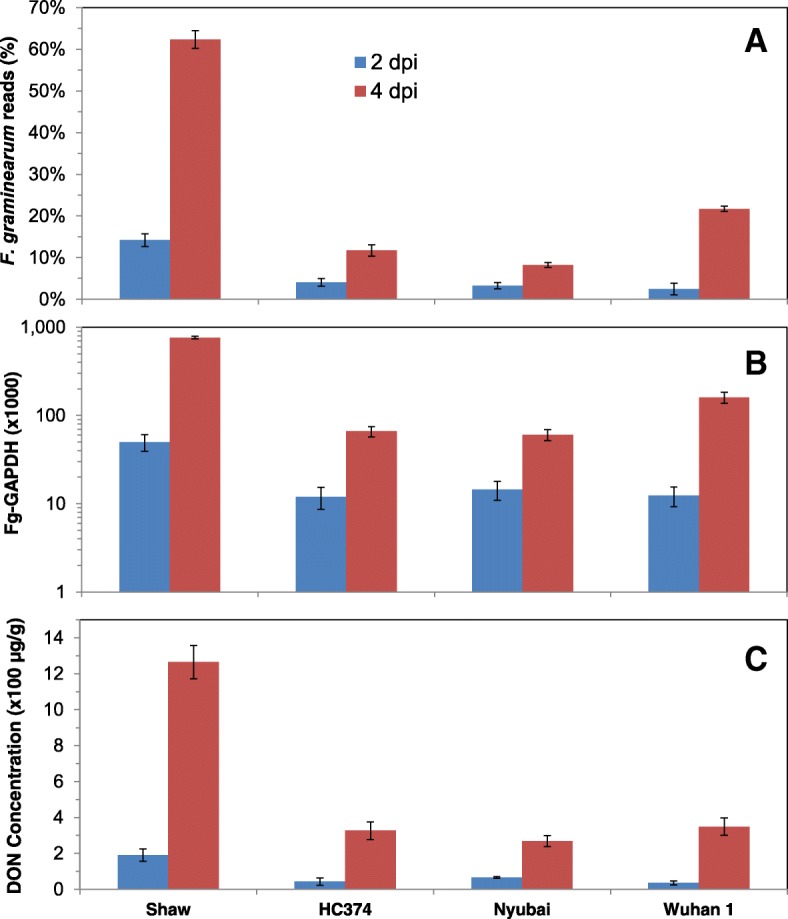
Background: Fusarium head blight (FHB) of wheat in North America is caused mostly by the fungal pathogen Fusarium graminearum (Fg). Upon exposure to Fg, wheat initiates a series of cellular responses involving massive transcriptional reprogramming. In this study, we analyzed transcriptomics data of four wheat genotypes (Nyubai, Wuhan 1, HC374, and Shaw), at 2 and 4 days post inoculation (dpi) with Fg, using RNA-seq technology.

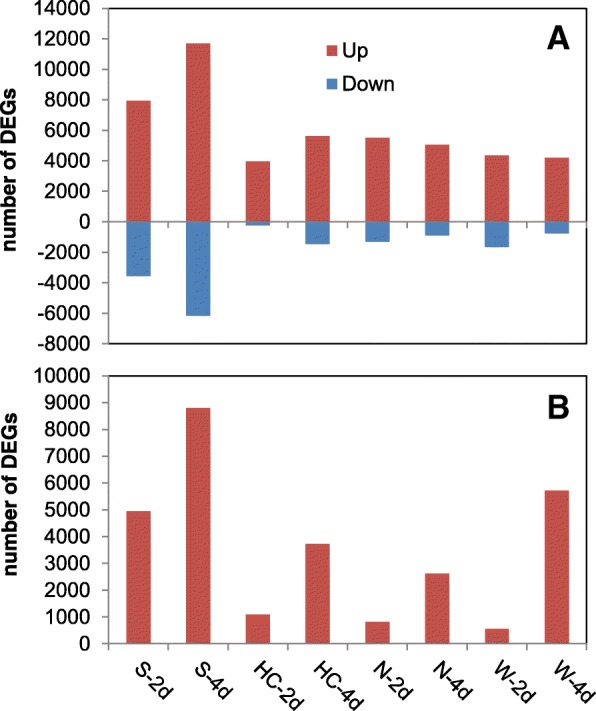
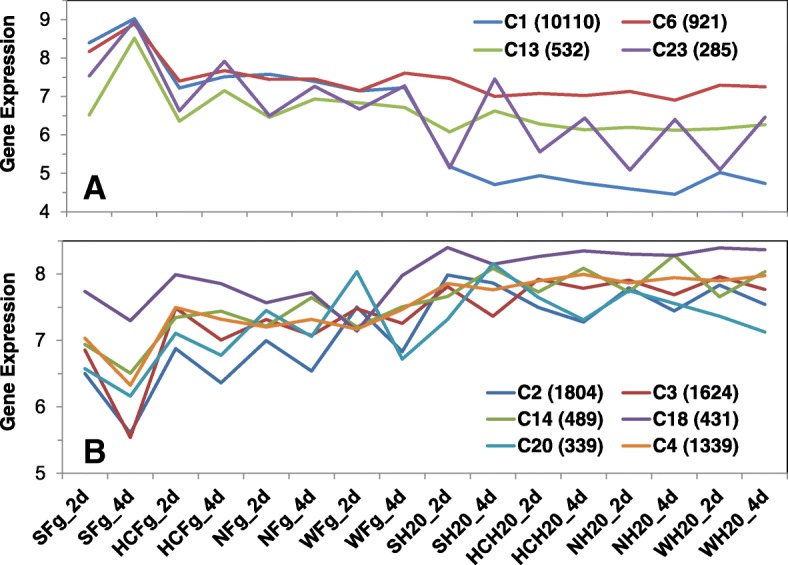
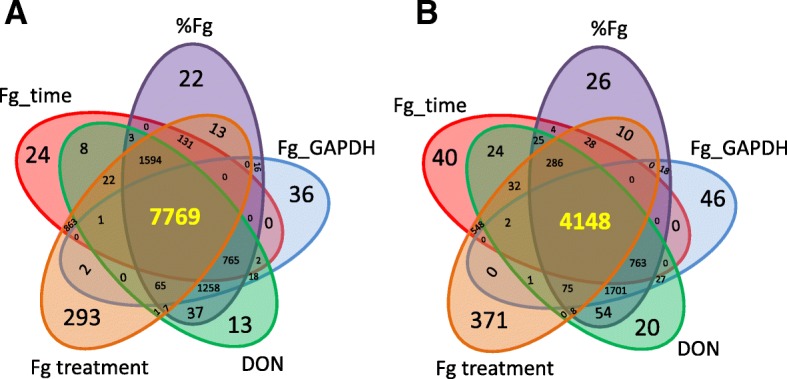
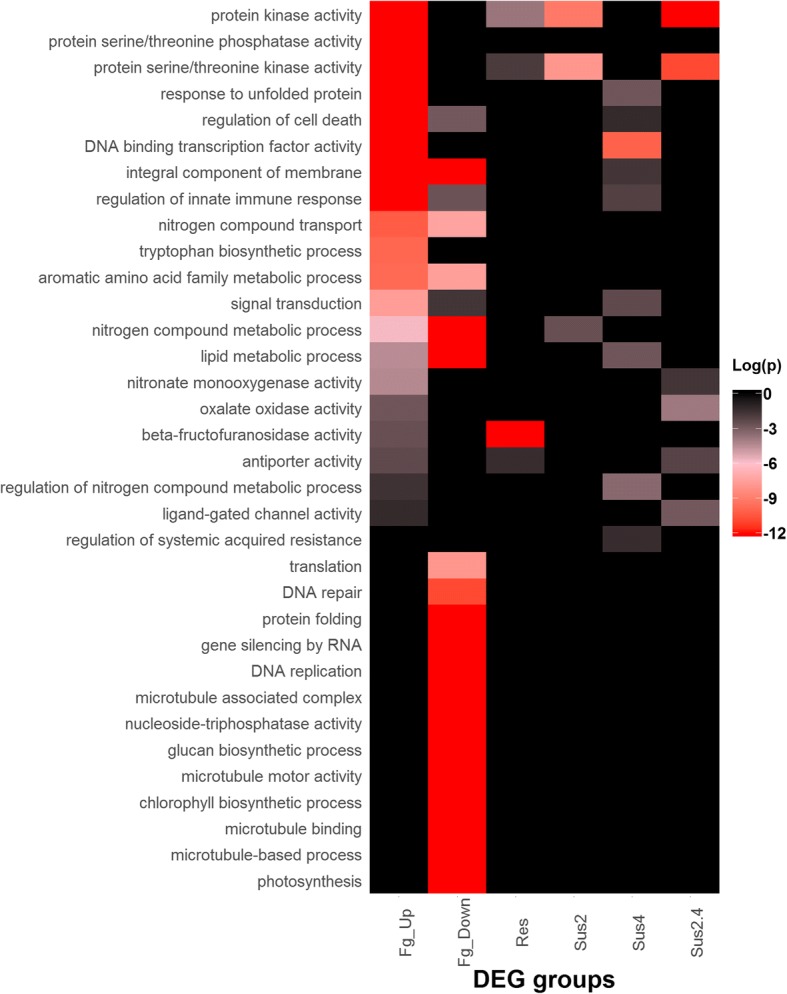
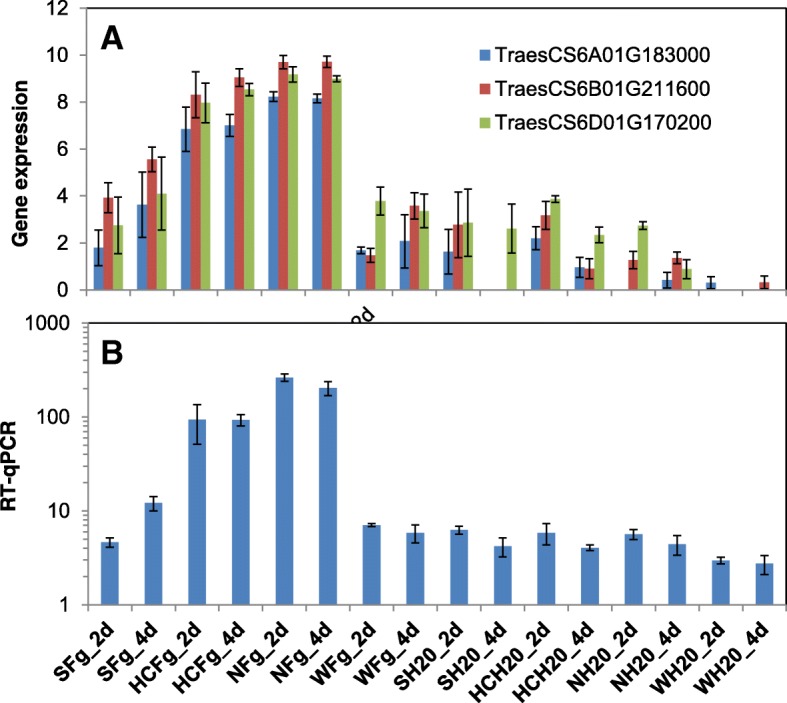
Results: A total of 37,772 differentially expressed genes (DEGs) were identified, 28,961 from wheat and 8811 from the pathogen. The susceptible genotype Shaw exhibited the highest number of host and pathogen DEGs, including 2270 DEGs associating with FHB susceptibility. Protein serine/threonine kinases and LRR-RK were associated with susceptibility at 2 dpi, while several ethylene-responsive, WRKY, Myb, bZIP and NAC-domain containing transcription factors were associated with susceptibility at 4 dpi. In the three resistant genotypes, 220 DEGs were associated with resistance. Glutathione S-transferase (GST), membrane proteins and distinct LRR-RKs were associated with FHB resistance across the three genotypes. Genes with unique, high up-regulation by Fg in Wuhan 1 were mostly transiently expressed at 2 dpi, while many defense-associated genes were up-regulated at both 2 and 4 dpi in Nyubai; the majority of unique genes up-regulated in HC374 were detected at 4 dpi only. In the pathogen, most genes showed increased expression between 2 and 4 dpi in all genotypes, with stronger levels in the susceptible host; however two pectate lyases and a hydrolase were expressed higher at 2 dpi, and acetyltransferase activity was highly enriched at 4 dpi.

Conclusions: There was an early up-regulation of LRR-RKs, different between susceptible and resistant genotypes; subsequently, distinct sets of genes associated with defense response were up-regulated. Differences in expression profiles among the resistant genotypes indicate genotype-specific defense mechanisms. This study also shows a greater resemblance in transcriptomics of HC374 to Nyubai, consistent with their sharing of two FHB resistance QTLs on 3BS and 5AS, compared to Wuhan 1 which carries one QTL on 2DL in common with HC374.

Keywords: Differentially expressed genes; Fusarium graminearum; Fusarium head blight; Pathogenesis; Plant defense; RNA-seq; Triticum aestivum.


Conflict of interest statement

Ethics approval

Ethics approval is not applicable.

Consent for publication

Not applicable.

Competing interests

The authors declare that they have no competing interests.

Publisher’s Note

Springer Nature remains neutral with regard to jurisdictional claims in published maps and institutional affiliations.

Figures

Fig. 1
Fig. 1
Level of Fg infection as estimated by proportion of Fg RNAs in RNA-seq reads (a), by accumulated level of FG-GAPDH RNA measured by RT-qPCR (b), and by DON concentration (c) across the samples. Error bar = one standard error of mean
Fig. 2
Fig. 2
Total number of differentially expressed genes (DEGs) originating from wheat (a) and the pathogen (b), combining all DEG analyses. Up: upregulated, Down: down-regulated by Fg; 2d and 4d: 2 and 4 dpi; S: Shaw; HC: HC374; N: Nyubai; W: Wuhan 1
Fig. 3
Fig. 3
Global view of the DEG expression profiles between genotypes and treatments. The top dendrogram on the left represents 28,961 wheat genes and the bottom one 8811 Fg genes. Fg and H2O: treatments with Fg and water (control); 2d and 4d: 2 and 4 dpi
Fig. 4
Fig. 4
Principal component analysis of the wheat DEGs dataset based on the top 1000 most variable DEGs. PC1 explained 89% of variance and PC2 8%. The ellipses were 90% confidence intervals highlighting treatment/time clusters. Fg and H2O: treatments with Fg and water (control); 2d and 4d: 2 and 4 dpi; S: Shaw; HC: HC374; N: Nyubai; W: Wuhan 1
Fig. 5
Fig. 5
Average values of the expression profiles for the ten DEG clusters significantly up- (a) or down- (b) regulated by Fg. The numbers in the brackets are the numbers of genes in the respective clusters. Fg and H2O: treatments with Fg and water (control); 2d and 4d: 2 and 4 dpi; S: Shaw; HC: HC374; N: Nyubai; W: Wuhan 1
Fig. 6
Fig. 6
Numbers of DEGs correlated with the five FHB related traits, specific to each trait, common between 2, 3, 4, or all five traits. Values for %Fg, Fg_GAPDH and DON are from Fig. 1. a up-regulated DEGs; b down-regulated DEGs
Fig. 7
Fig. 7
Gene ontology enrichment analysis of DEG groups up- or down-regulated by Fg (Fg_Up and Fg_Down) and genes associated with FHB resistance (Res) and susceptibility at 2 and/or 4 dpi (Sus2, Sus4, and Sus2.4)
Fig. 8
Fig. 8
Gene expression profiles of nitronate monooxygenase genes. Fg and H2O: treatments with Fg and water (control); 2d and 4d: 2 and 4 dpi; S: Shaw; HC: HC374; N: Nyubai; W: Wuhan 1
Fig. 9
Fig. 9
Genes putatively associated with FHB resistance. a 12 genes upregulated by Fg treatment across the resistant Nyubai, Wuhan 1 and HC374, but not in the susceptible Shaw were identified by the joint DEFE patterns of FW00111111∩ (FRS111111¬WRS111111) or FW10111111∩(FRS111111¬WRS111111). Refer to Table 1 for the meaning of the DEFE patterns. b expression profiles of the 12 genes putatively associated with FHB resistance. c expression profile by RT-qPCR for GST (TraesCS7A01G021900). Fg and H2O: treatments with Fg and water (control); 2d and 4d: 2 and 4 dpi; S: Shaw; HC: HC374; N: Nyubai; W: Wuhan 1
Fig. 10
Fig. 10
Expression profiles of sesquiterpene synthases. a RNA-seq data of the three homologs. b cumulative expression profile by RT-qPCR for the three sesquiterpene synthases (gene specific assays could not be designed due to high sequence similarity among the three genes). Fg and H2O: treatments with Fg and water (control); 2d and 4d: 2 and 4 dpi; S: Shaw; HC: HC374; N: Nyubai; W: Wuhan 1
Fig. 11
Fig. 11
DEGs putatively associated with FHB susceptibility. Frequency distribution at 2 dpi (a), 4 dpi (b), and both time points (c). The highlighted numbers in the Venn diagrams are considered in the text. Refer to Table 1 for the meaning of the DEFE patterns
Fig. 12
Fig. 12
Expression profiles of the five NFXL1 genes. a in the RNA-seq dataset; b cumulative expression of the four genes on chromosome 7 by RT-qPCR (gene specific assays could not be designed due to high sequence similarity among the four genes). Fg and H2O: treatments with Fg and water (control); 2d and 4d: 2 and 4 dpi; S: Shaw; HC: HC374; N: Nyubai; W: Wuhan 1
Fig. 13
Fig. 13
Enrichment of gene groups in the association networks and in key hub gene populations. a proportion in the gene populations, b enrichment index. Details are in Additional file 4. The color legend in panel b is for both panels
Fig. 14
Fig. 14
Expression profiles of five Fg pectate lyase genes. a in expression cluster C1; b in expression cluster C2. Fg: treatment with Fg; 2d and 4d: 2 and 4 dpi; S: Shaw; HC: HC374; N: Nyubai; W: Wuhan 1

Similar articles

Cited by

References

    1. Bai G, Shaner G. Management and resistance in wheat and barley to fusarium head blight. Annu Rev Phytopathol. 2004;42:135–161. doi: 10.1146/annurev.phyto.42.040803.140340. - DOI - PubMed
    1. Mesterházy Á, Bartók T, Mirocha CG, Komoróczy R. Nature of wheat resistance to fusarium head blight and the role of deoxynivalenol for breeding. Plant Breed. 1999;118:97–110. doi: 10.1046/j.1439-0523.1999.118002097.x. - DOI
    1. Buerstmayr H, Ban T, Anderson JA. QTL mapping and marker-assisted selection for fusarium head blight resistance in wheat: a review. Plant Breed. 2009;128:1–26. doi: 10.1111/j.1439-0523.2008.01550.x. - DOI
    1. Somers DJ, Fedak G, Savard M. Molecular mapping of novel genes controlling fusarium head blight resistance and deoxynivalenol accumulation in spring wheat. Genome. 2003;46:555–564. doi: 10.1139/g03-033. - DOI - PubMed
    1. Bolton MD. Primary metabolism and plant defense – fuel for the fire. Mol Plant-Microbe Interact. 2009;22:487–497. doi: 10.1094/MPMI-22-5-0487. - DOI - PubMed