

Spatio-temporal spillover risk of yellow fever in Brazil
- PMID: 30157908
- PMCID: PMC6116573
- DOI: 10.1186/s13071-018-3063-6
Spatio-temporal spillover risk of yellow fever in Brazil
Abstract
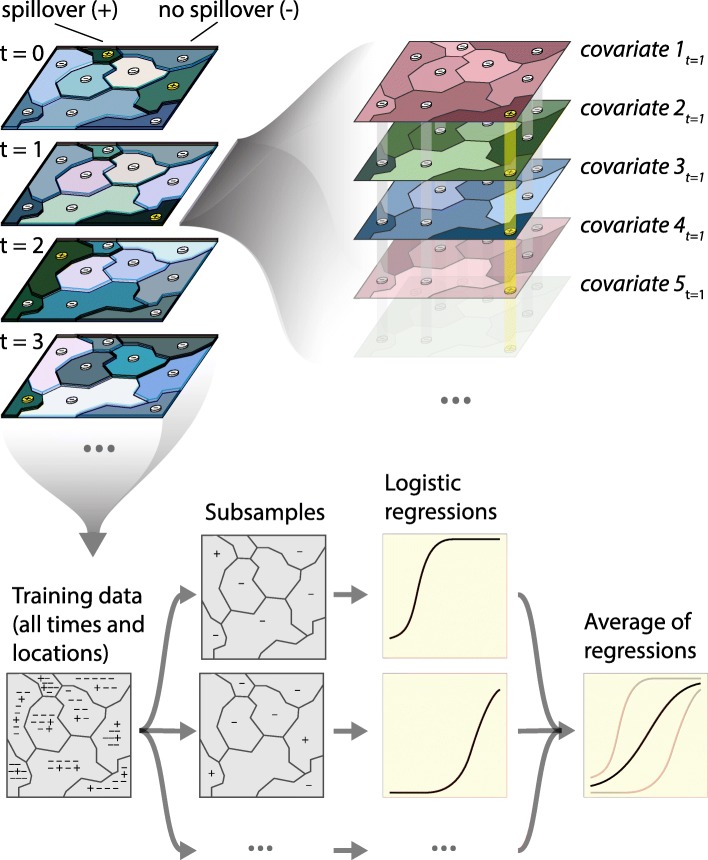
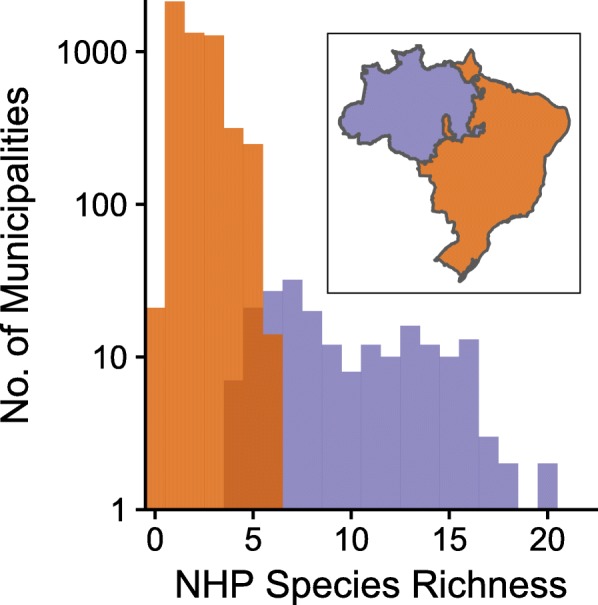
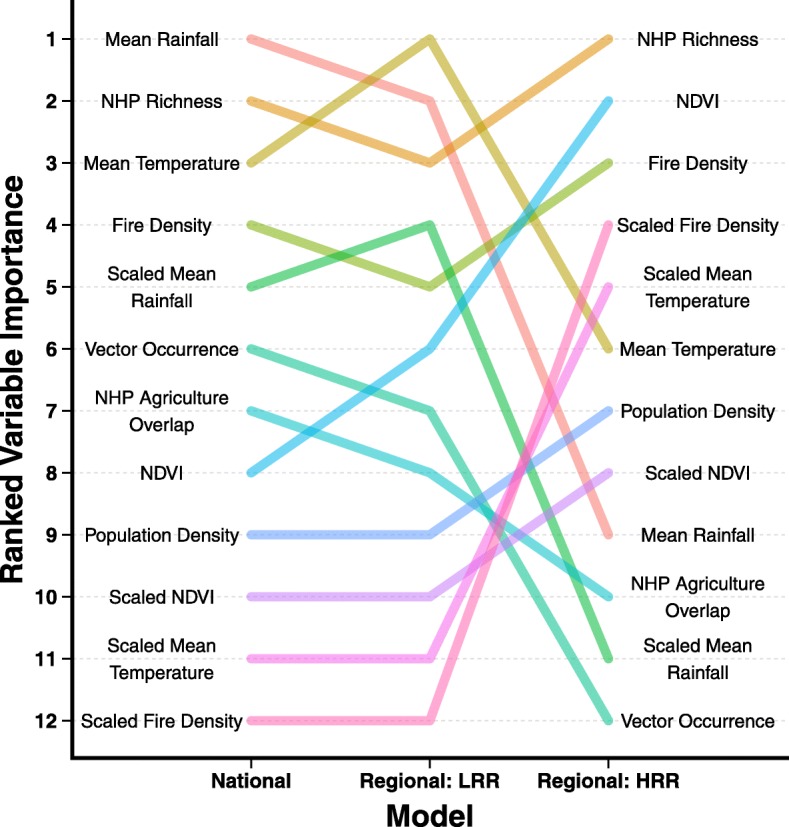
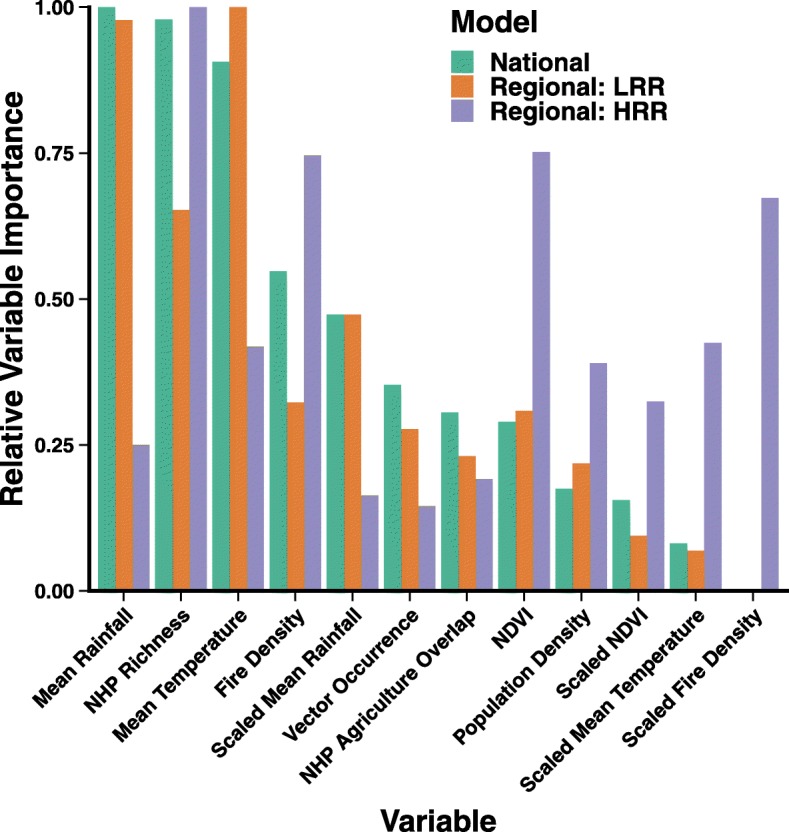
Background: Yellow fever virus is a mosquito-borne flavivirus that persists in an enzoonotic cycle in non-human primates (NHPs) in Brazil, causing disease in humans through spillover events. Yellow fever (YF) re-emerged in the early 2000s, spreading from the Amazon River basin towards the previously considered low-risk, southeastern region of the country. Previous methods mapping YF spillover risk do not incorporate the temporal dynamics and ecological context of the disease, and are therefore unable to predict seasonality in spatial risk across Brazil. We present the results of a bagged logistic regression predicting the propensity for YF spillover per municipality (administrative sub-district) in Brazil from environmental and demographic covariates aggregated by month. Ecological context was incorporated by creating National and Regional models of spillover dynamics, where the Regional model consisted of two separate models determined by the regions' NHP reservoir species richness (high vs low).
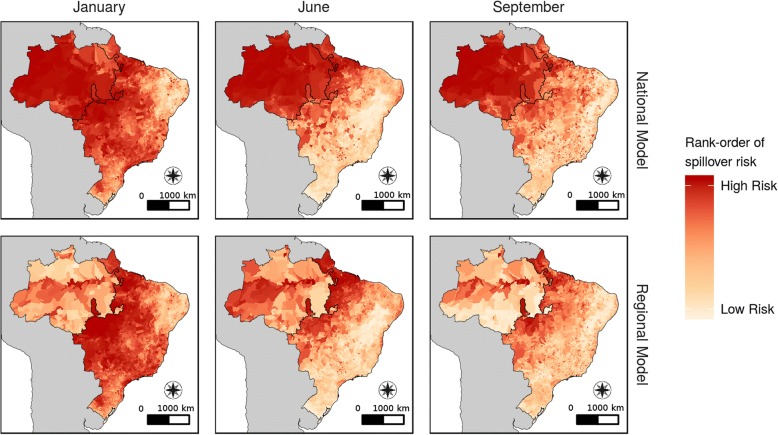
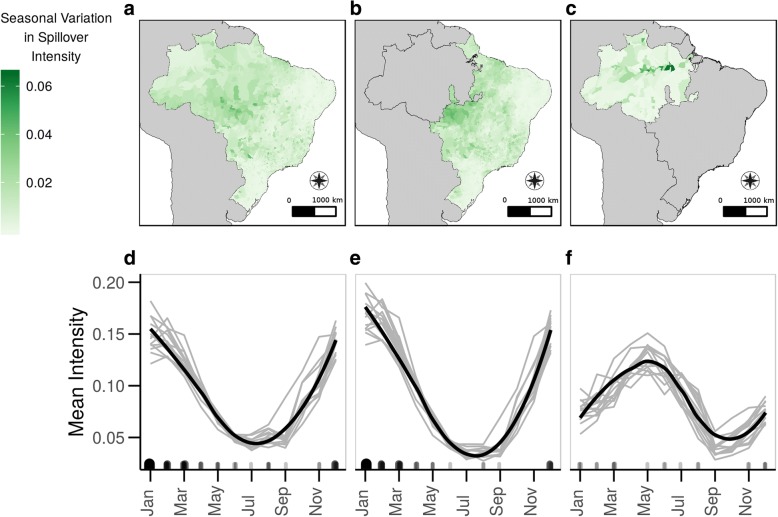
Results: Of the 5560 municipalities, 82 reported YF cases from 2001 to 2013. Model accuracy was high for the National and low reservoir richness (LRR) models (AUC = 0.80), while the high reservoir richness (HRR) model accuracy was lower (AUC = 0.63). The National model predicted consistently high spillover risk in the Amazon, while the Regional model predicted strong seasonality in spillover risk. Within the Regional model, seasonality of spillover risk in the HRR region was asynchronous to the LRR region. However, the observed seasonality of spillover risk in the LRR Regional model mirrored the national model predictions.
Conclusions: The predicted risk of YF spillover varies with space and time. Seasonal trends differ between regions indicating, at times, spillover risk can be higher in the urban coastal regions than the Amazon River basin which is counterintuitive based on current YF risk maps. Understanding the spatio-temporal patterns of YF spillover risk could better inform allocation of public health services.
Keywords: Arboviruses; Brazil; Risk mapping; Spatial epidemiology; Vectors; Yellow fever.
Conflict of interest statement
Ethics approval and consent to participate
Not applicable.
Consent for publication
Not applicable.
Competing interests
The authors declare that they have no competing interests.
Publisher’s Note
Springer Nature remains neutral with regard to jurisdictional claims in published maps and institutional affiliations.
Figures
Similar articles
-
Persistence of Yellow fever virus outside the Amazon Basin, causing epidemics in Southeast Brazil, from 2016 to 2018.PLoS Negl Trop Dis. 2018 Jun 4;12(6):e0006538. doi: 10.1371/journal.pntd.0006538. eCollection 2018 Jun. PLoS Negl Trop Dis. 2018. PMID: 29864115 Free PMC article.
-
Mosquito and primate ecology predict human risk of yellow fever virus spillover in Brazil.Philos Trans R Soc Lond B Biol Sci. 2019 Sep 30;374(1782):20180335. doi: 10.1098/rstb.2018.0335. Epub 2019 Aug 12. Philos Trans R Soc Lond B Biol Sci. 2019. PMID: 31401964 Free PMC article.
-
Recent sylvatic yellow fever virus transmission in Brazil: the news from an old disease.Virol J. 2020 Jan 23;17(1):9. doi: 10.1186/s12985-019-1277-7. Virol J. 2020. PMID: 31973727 Free PMC article. Review.
-
The seasonal influence of climate and environment on yellow fever transmission across Africa.PLoS Negl Trop Dis. 2018 Mar 15;12(3):e0006284. doi: 10.1371/journal.pntd.0006284. eCollection 2018 Mar. PLoS Negl Trop Dis. 2018. PMID: 29543798 Free PMC article.
-
Incidence, drivers and global health implications of the 2019/2020 yellow fever sporadic outbreaks in Sub-Saharan Africa.Pathog Dis. 2021 Apr 9;79(4):ftab017. doi: 10.1093/femspd/ftab017. Pathog Dis. 2021. PMID: 33739369 Review.
Cited by
-
Environmental determinants predicting population vulnerability to high yellow fever incidence.R Soc Open Sci. 2022 Mar 2;9(3):220086. doi: 10.1098/rsos.220086. eCollection 2022 Mar. R Soc Open Sci. 2022. PMID: 35316947 Free PMC article.
-
Assessment of the yellow fever outbreak in Angola from December 2015 through December 2016: A retrospective study.Health Sci Rep. 2024 Feb 15;7(2):e1924. doi: 10.1002/hsr2.1924. eCollection 2024 Feb. Health Sci Rep. 2024. PMID: 38444843 Free PMC article.
-
Increasing the resolution of malaria early warning systems for use by local health actors.Malar J. 2025 Jan 30;24(1):30. doi: 10.1186/s12936-025-05266-0. Malar J. 2025. PMID: 39885540 Free PMC article.
-
Rocio Virus: An Updated View on an Elusive Flavivirus.Viruses. 2021 Nov 16;13(11):2293. doi: 10.3390/v13112293. Viruses. 2021. PMID: 34835099 Free PMC article. Review.
-
Re-emergence of yellow fever in the neotropics - quo vadis?Emerg Top Life Sci. 2020 Dec 11;4(4):399-410. doi: 10.1042/ETLS20200187. Emerg Top Life Sci. 2020. PMID: 33258924 Free PMC article. Review.
References
-
- Bicca-Marques JC, de Freitas DS. The role of monkeys, mosquitoes, and humans in the occurrence of a yellow fever outbreak in a fragmented landscape in south Brazil: protecting Howler monkeys is a matter of public health. Trop Conserv Sci. 2010;3:78–89. doi: 10.1177/194008291000300107. - DOI
MeSH terms
LinkOut - more resources
Full Text Sources
Other Literature Sources
