. 2018 Aug 29;20(1):187.
doi: 10.1186/s13075-018-1689-6.

Immune complexes containing scleroderma-specific autoantibodies induce a profibrotic and proinflammatory phenotype in skin fibroblasts

Affiliations

Immune complexes containing scleroderma-specific autoantibodies induce a profibrotic and proinflammatory phenotype in skin fibroblasts

Elena Raschi et al. Arthritis Res Ther. .

Abstract

Background: In systemic sclerosis (SSc), autoantibodies provide the most accurate tool to predict the disease subset and pattern of organ involvement. Scleroderma autoantibodies target nucleic acids or DNA/RNA-binding proteins, thus SSc immune complexes (ICs) can embed nucleic acids. Our working hypothesis envisaged that ICs containing scleroderma-specific autoantibodies might elicit proinflammatory and profibrotic effects in skin fibroblasts.

Methods: Fibroblasts were isolated from skin biopsies obtained from healthy subjects and patients with diffuse cutaneous SSc (dcSSc). ICs were purified by polyethylene-glycol precipitation from sera of SSc patients bearing different autoantibodies. ICs from patients with systemic lupus erythematosus (SLE) and primary anti-phospholipid syndrome (PAPS) and from normal healthy subjects (NHS) were used as controls. After incubation with ICs, fibroblasts were evaluated for ICAM-1 expression, interleukin (IL)-6, IL-8, monocyte chemoattractant protein (MCP)-1, matrix metalloproteinase (MMP)-2, tumor growth factor (TGF)-β1 and Pro-CollagenIα1 secretion, collagen (col)Iα1, mmp-1, toll-like receptor (tlr)2, tlr3, tlr4, tlr7, tlr8, tlr9, interferon (ifn)-α, ifn-β and endothelin-1 mRNA, and NFκB, p38MAPK and SAPK-JNK activation rate. Experiments were also performed after pretreatment with DNase I/RNase and NFκB/p38MAPK inhibitors.

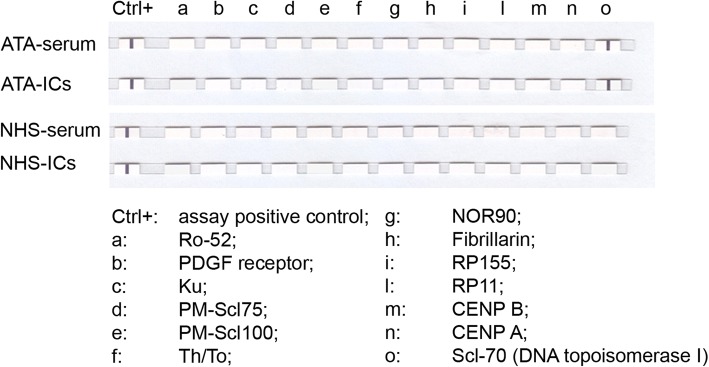
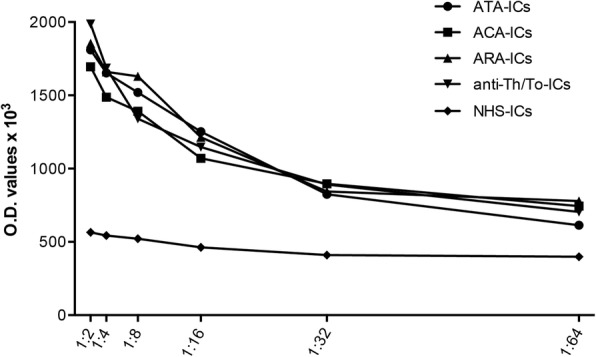
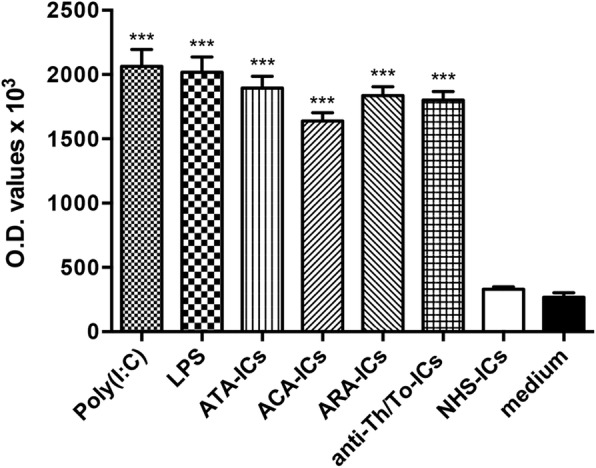
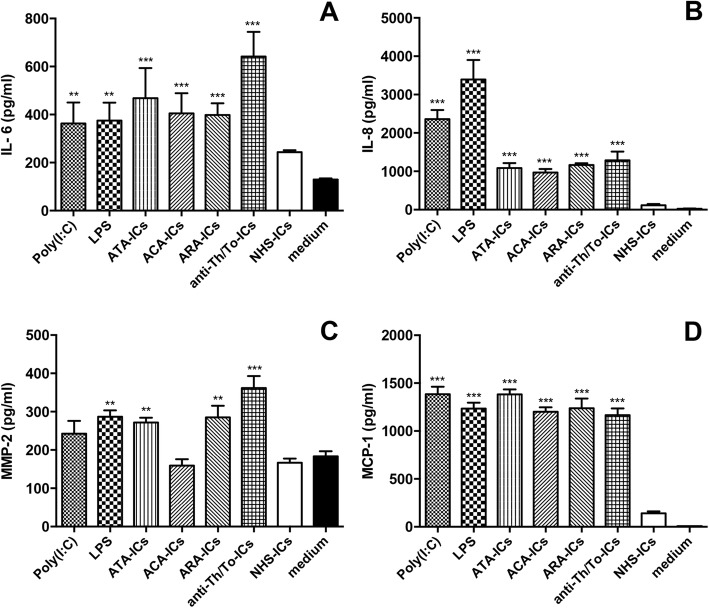
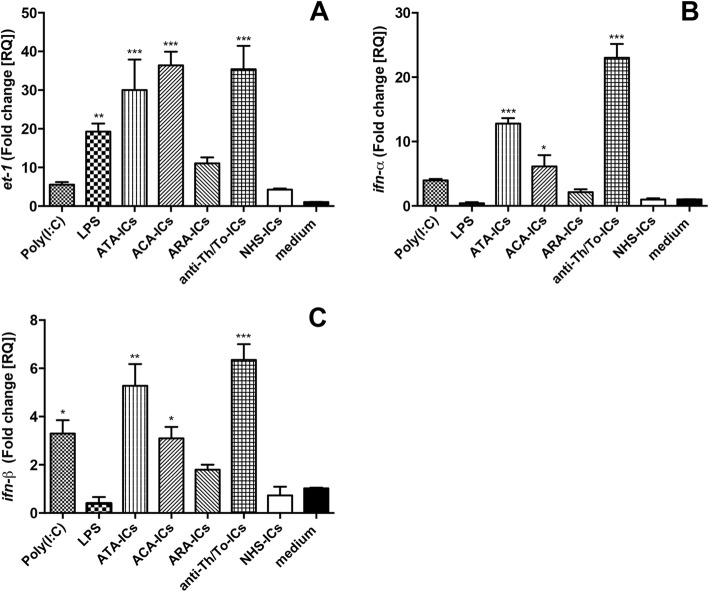
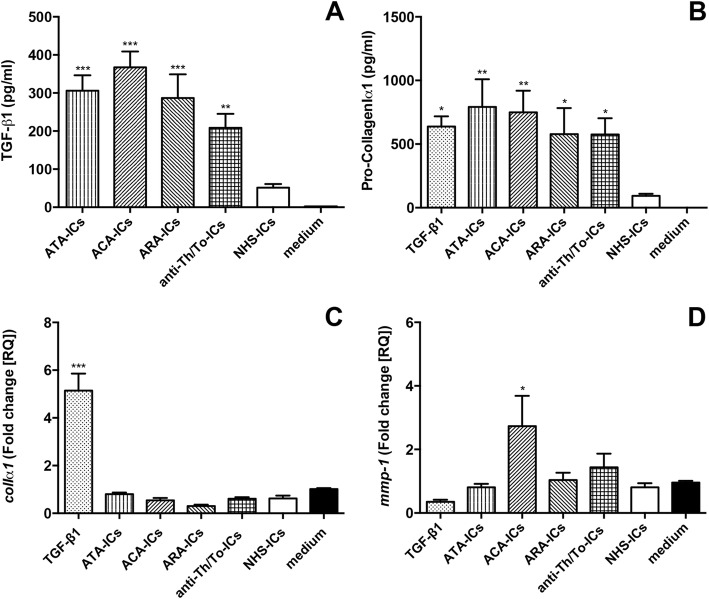
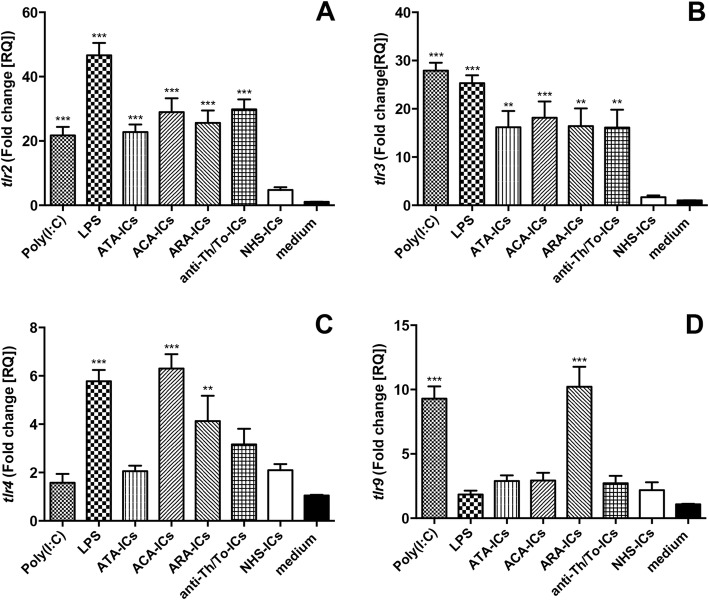
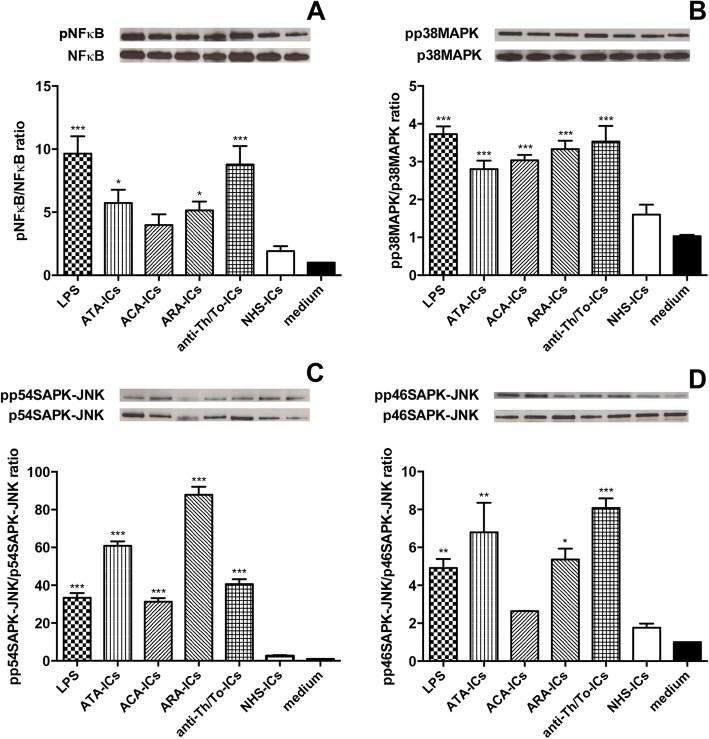
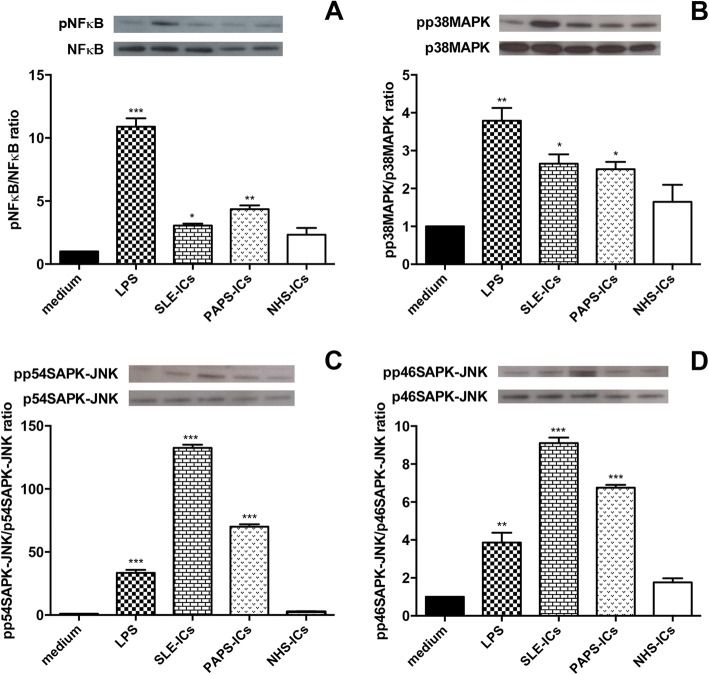
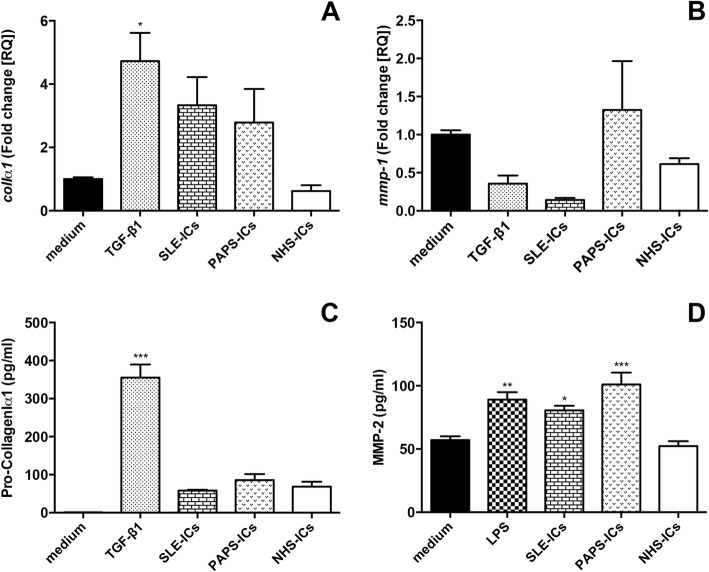
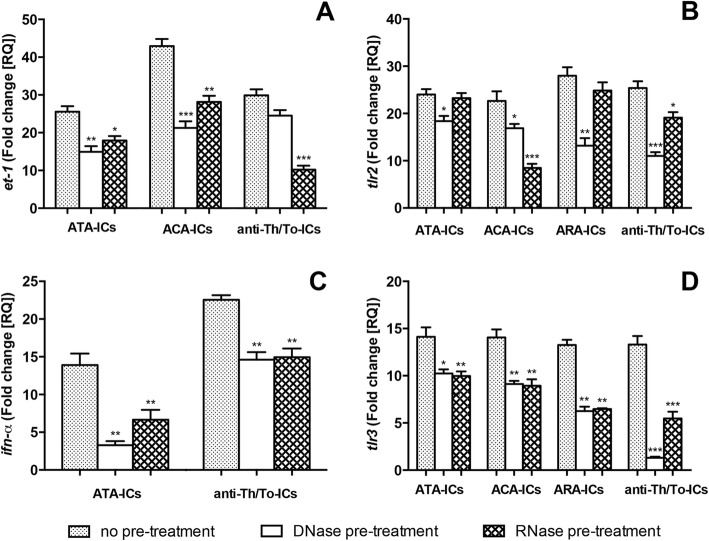
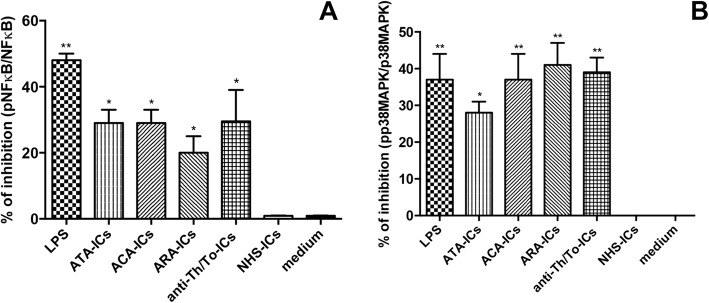
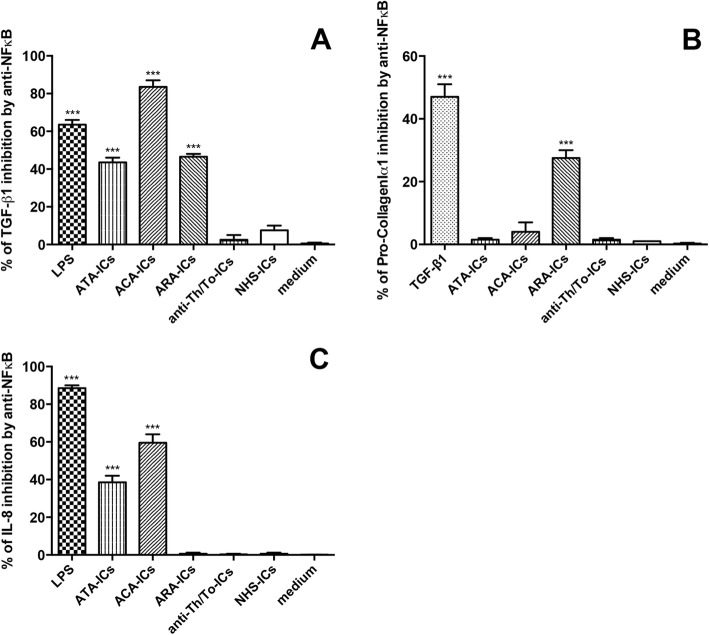
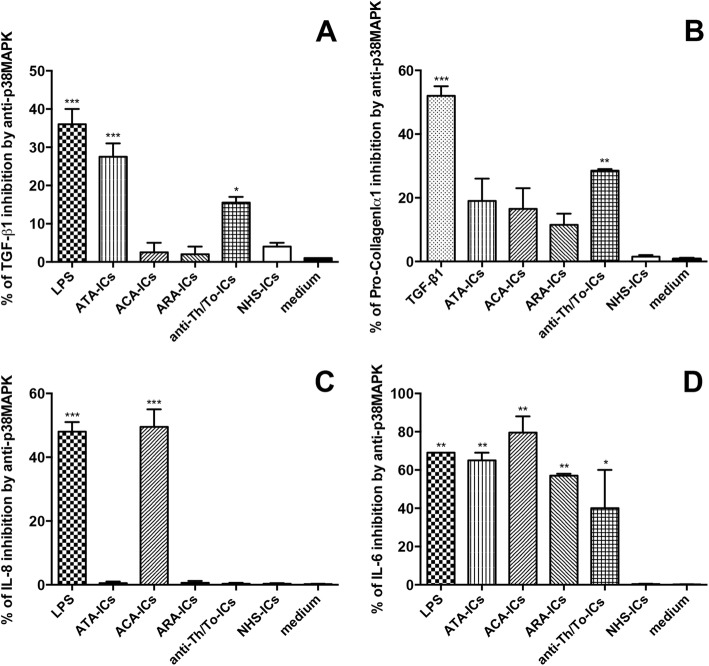
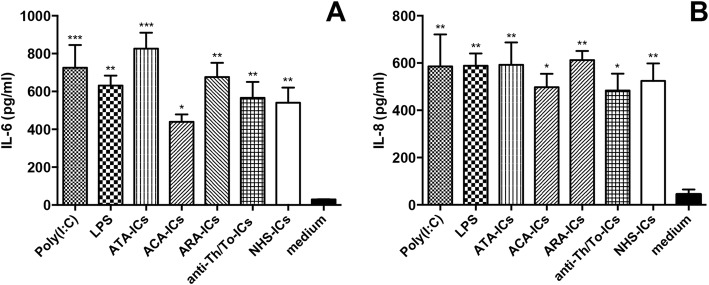
Results: The antigenic reactivity for each SSc-IC mirrored the corresponding serum autoantibody specificity, while no positivity was observed in NHS-ICs or sera. SSc-ICs but not NHS-ICs increased ICAM-1 expression, stimulated IL-6, IL-8, MMP-2, MCP-1, TGF-β1 and Pro-CollagenIα1 secretion, upregulated et-1, ifn-α, ifn-β, tlr2, tlr3 and tlr4, and activated NFκB, p38MAPK and SAPK-JNK. tlr9 was significantly upregulated by ARA-ICs, mmp-1 was significantly induced by ACA-ICs whereas colIα1 was not modulated by any SSc-ICs. SLE-ICs and PAPS-ICs significantly upregulated MMP-2 and activated NFκB, p38MAPK and SAPK-JNK. SLE-ICs and PAPS-ICs did not affect colIα1, mmp-1 and Pro-CollagenIα1. DNase I and RNase treatment significantly reduced the upregulation of study mediators induced by SSc-ICs. Pretreatment with NFκB/p38MAPK inhibitors suggested that response to anti-Th/To-ICs was preferentially mediated by p38MAPK whereas ATA-ICs, ACA-ICs and ARA-ICs engaged both mediators. In dcSSc fibroblasts, stimulation with SSc-ICs and NHS-ICs upregulated IL-6 and IL-8.

Conclusions: These data provide the first demonstration of the proinflammatory and profibrotic effects of SSc-ICs on fibroblasts, suggesting the potential pathogenicity of SSc autoantibodies. These effects might be mediated by Toll-like receptors via the interaction with nucleic acid fragments embedded in SSc-ICs.

Keywords: Autoantibodies; Fibroblasts; Fibrosis; Immune complexes; Inflammation; Systemic sclerosis; Toll-like receptors.


Conflict of interest statement

Ethics approval and consent to participate

This study was approved by the ethical Committee “Milano Area B”, opinion number 426, July 8, 2014. All patients provided written informed consent to participate.

Consent for publication

All authors consent to the publication of the manuscript.

Competing interests

The authors declare that they have no competing interests.

Publisher’s Note

Springer Nature remains neutral with regard to jurisdictional claims in published maps and institutional affiliations.

Figures

Fig. 1
Fig. 1
TaqMan® Gene Expression assays against SSc-specific antigens of PEG-precipitated ICs and corresponding sera evaluated by EUROLINE-SSc profile kit. One ATA-IC and one NHS-IC presented as representative assay. CTR+, assay-positive control. a, Ro-52; b, PDGF receptor; c, Ku; d, PM-Scl75; e, PM-Scl100; f, Th/To; g, NOR90; h, Fibrillarin; i, RP155; l, RP11; m, CENP B; n, CENP A; o, Scl-70 (DNA topoisomerase I). ATA anti-DNA topoisomerase I antibodies, IC immune complex, NHS normal healthy subjects
Fig. 2
Fig. 2
Dose–response dilution curve for ICAM-1 expression on fibroblast cell surface. Fibroblasts exposed to serial two-fold dilutions (from 1:2 to 1:64) of SSc-ICs and NHS-ICs, and ICAM-1 evaluated by cell ELISA. anti-Th/To anti-Th/To antibodies, ATA anti-DNA topoisomerase I antibodies, IC immune complex, NHS normal healthy subjects, OD optical density
Fig. 3
Fig. 3
ICAM-1 expression on fibroblasts stimulated with SSc-ICs or NHS-ICs. Fibroblasts exposed to SSc-ICs or NHS-ICs (1:2 dilution). Poly(I:C) and LPS, at concentration of 1 μg/ml, used as positive controls. ***p < 0.0001 versus medium. ACA anti-centromeric protein antibodies, anti-Th/To anti-Th/To antibodies, ARA anti-RNA polymerase III antibodies, ATA anti-DNA topoisomerase I antibodies, IC immune complex, LPS lipopolysaccharide, NHS normal healthy subjects, OD optical density, poly(I:C) polyinosinic-polycytidylic acid
Fig. 4
Fig. 4
IL-6, IL-8, MMP-2 and MCP-1 levels in culture supernatants from fibroblasts incubated with SSc-ICs or NHS-ICs. Fibroblasts exposed to SSc-ICs or NHS-ICs (1:2 dilution). Poly(I:C) and LPS, at concentration of 1 μg/ml, used as positive controls. a IL-6; b IL-8; c MMP-2; d MCP-1. **p < 0.001, ***p < 0.0001 versus medium. ACA anti-centromeric protein antibodies, anti-Th/To anti-Th/To antibodies, ARA anti-RNA polymerase III antibodies, ATA anti-DNA topoisomerase I antibodies, IC immune complex, IL interleukin, LPS lipopolysaccharide, MCP monocyte chemoattractant protein, MMP matrix metalloproteinase, NHS normal healthy subjects, poly(I:C) polyinosinic-polycytidylic acid
Fig. 5
Fig. 5
et-1, ifn-α and ifn-β mRNA expression levels in fibroblasts stimulated with SSc-ICs or NHS-ICs. Fibroblasts exposed to SSc-ICs or NHS-ICs (1:2 dilution). Poly(I:C) and LPS, at concentration of 1 μg/ml, used as controls. a et-1; b ifn-α; c ifn-β. *p < 0.01, **p < 0.001, ***p < 0.0001 versus medium. ACA anti-centromeric protein antibodies, anti-Th/To anti-Th/To antibodies, ARA anti-RNA polymerase III antibodies, ATA anti-DNA topoisomerase I antibodies, et-1 endothelin-1, IFN interferon, IC immune complex, LPS lipopolysaccharide, NHS normal healthy subjects, poly(I:C) polyinosinic-polycytidylic acid
Fig. 6
Fig. 6
TGF-β1 and Pro-CollagenIα1 secretion and colIα1 and mmp-1 mRNA expression in fibroblasts stimulated with SSc-ICs or NHS-ICs. Fibroblasts exposed to SSc-ICs or NHS-ICs (1:2 dilution). TGF-β1 (10 ng/ml) used as positive control for collagen synthesis and secretion. a TGF-β1; b Pro-CollagenIα1; c colIα1; d mmp-1. *p < 0.01, **p < 0.001, ***p < 0.0001 versus medium. ACA anti-centromeric protein antibodies, anti-Th/To anti-Th/To antibodies, ARA anti-RNA polymerase III antibodies, ATA anti-DNA topoisomerase I antibodies, colIα1 collagenIα1, IC immune complex, MMP matrix metalloproteinase, NHS normal healthy subjects, TGF tumor growth factor
Fig. 7
Fig. 7
tlr mRNA expression levels in fibroblasts stimulated with SSc-ICs or control NHS-ICs. Fibroblasts exposed to SSc-ICs or NHS-ICs (1:2 dilution). Poly(I:C) and LPS, at concentration of 1 μg/ml, used as controls. a tlr2; b tlr3; c tlr4; d tlr9. **p < 0.001, ***p < 0.0001 versus medium. ACA anti-centromeric protein antibodies, anti-Th/To anti-Th/To antibodies, ARA anti-RNA polymerase III antibodies, ATA anti-DNA topoisomerase I antibodies, IC immune complex, LPS lipopolysaccharide, NHS normal healthy subjects, poly(I:C) polyinosinic-polycytidylic acid, TLR Toll-like receptor
Fig. 8
Fig. 8
Intracellular signaling pathways in fibroblasts stimulated with SSc-ICs or NHS-ICs. Fibroblasts exposed to SSc-ICs or NHS-ICs (1:2 dilution). LPS (1 μg/ml) used as control. a pNFκB/NFκB; b pp38MAPK/p38MAPK; c pp54SAPK-JNK/p54SAPK-JNK; d pp46SAPK-JNK/p46SAPK-JNK. Results expressed as ratio of phosphorylated to nonphosphorylated forms, evaluated using ImageJ software. Western blot images representative of single experiment. *p < 0.01, **p < 0.001, ***p < 0.0001 versus medium. ACA anti-centromeric protein antibodies, anti-Th/To anti-Th/To antibodies, ARA anti-RNA polymerase III antibodies, ATA anti-DNA topoisomerase I antibodies, IC immune complex, LPS lipopolysaccharide, MAPK mitogen activated kinase, NHS normal healthy subjects, NFκB nuclear factor kappa B, pNFκB phosphorylated NFκB, pp38MAPK phosphorylated p38MAPK, pp54SAPK-JNK phosphorylated p54SAPK-JNK, pp46SAPK-JNK phosphorylated p46SAPK-JNK
Fig. 9
Fig. 9
Intracellular signaling pathways in fibroblasts stimulated with SLE-ICs, PAPS-ICs or NHS-ICs. Fibroblasts exposed to SLE-ICs, PAPS-ICs or NHS-ICs (1:2 dilution). LPS (1 μg/ml) used as control. a pNFκB/NFκB; b pp38MAPK/p38MAPK; c pp54SAPK-JNK/p54SAPK-JNK; d pp46SAPK-JNK/p46SAPK-JNK. Results expressed as ratio of phosphorylated to nonphosphorylated forms, evaluated using ImageJ software. Western blot images representative of single experiment. *p < 0.01, **p < 0.001, ***p < 0.0001 versus medium. IC immune complex, LPS lipopolysaccharide, MAPK mitogen activated kinase, NHS normal healthy subjects, NFκB nuclear factor kappa B, pNFκB phosphorylated NFκB, pp38MAPK phosphorylated p38MAPK, pp54SAPK-JNK phosphorylated p54SAPK-JNK, pp46SAPK-JNK phosphorylated p46SAPK-JNK, PAPS primary anti-phospholipid syndrome, SLE systemic lupus erythematosus
Fig. 10
Fig. 10
colIα1 and mmp-1 mRNA expression and Pro-CollagenIα1 and MMP-2 secretion in fibroblasts stimulated with SLE-ICs, PAPS-ICs or NHS-ICs. Fibroblasts exposed to PAPS-ICs, SLE-ICs or NHS-ICs (1:2 dilution). TGF-β1 (10 ng/ml) and LPS (1 μg/ml) used as positive control for collagen synthesis and secretion. a colIα1; b mmp-1; c Pro-CollagenIα1; d MMP-2. *p < 0.01, **p < 0.001, ***p < 0.0001 versus medium. colIα1 collagenIα1, IC immune complex, LPS lipopolysaccharide, MMP matrix metalloproteinase, NHS normal healthy subjects, PAPS primary anti-phospholipid syndrome, SLE systemic lupus erythematosus, TGF tumor growth factor
Fig. 11
Fig. 11
et-1, tlr2 and tlr3 expression levels in fibroblasts stimulated with SSc-ICs or NHS-ICs pretreated with DNase/RNase. SSc-ICs treated with DNase I (20 KU/ml) or RNase (8 μg/ml) and then added to fibroblast cultures. a ATA-ICs, ACA-ICs and anti-Th/To-ICs on et-1; b ATA-ICs, ACA-ICs, ARA-ICs and anti-Th/To-ICs on tlr2; c ATA-ICs and anti-Th/To-ICs on ifn-α; d ATA-ICs, ACA-ICs, ARA-ICs and anti-Th/To-ICs on tlr3. *p < 0.01, **p < 0.001, ***p < 0.0001 versus medium. ACA anti-centromeric protein antibodies, anti-Th/To anti-Th/To antibodies, ARA anti-RNA polymerase III antibodies, ATA anti-DNA topoisomerase I antibodies, et-1 endothelin-1, IC immune complex, IFN interferon, TLR Toll-like receptor
Fig. 12
Fig. 12
Confirmation of efficacy of NFκB and p38MAPK inhibitors by western blot analysis. Cells preincubated for 1 h at 37 °C with inhibitors of NFκB and p38MAPK. Fibroblasts exposed to SSc-ICs or NHS-ICs (1:2 dilution). LPS (1 μg/ml) used as control. Results expressed as percentage of inhibition of activated (a) NFκB and (b) p38MAPK (expressed as ratio of phosphorylated to nonphosphorylated forms). *p < 0.01, **p < 0.001 versus medium. ACA anti-centromeric protein antibodies, anti-Th/To anti-Th/To antibodies, ARA anti-RNA polymerase III antibodies, ATA anti-DNA topoisomerase I antibodies, IC immune complex, LPS lipopolysaccharide, NFκB nuclear factor kappa B, NHS normal healthy subjects, MAPK mitogen activated kinase, pp38MAPK phosphorylated p38MAPK
Fig. 13
Fig. 13
TGF-β1, Pro-collagenIα1 and IL-8 in fibroblasts pretreated with NFκB inhibitor and incubated with SSc-ICs or NHS-ICs. Fibroblasts pretreated with MG-132 (20 μmol), an NFκB inhibitor, and then exposed to SSc-ICs or NHS-ICs (1:2 dilution). LPS (1 μg/ml) and TGF-β1 (10 ng/ml) used as positive controls. Results expressed as percentage of inhibition of a TGF-β1, b Pro-CollagenIα1 and c IL-8 in untreated versus MG-132-treated cells. ***p < 0.0001 versus medium. ACA anti-centromeric protein antibodies, anti-Th/To anti-Th/To antibodies, ARA anti-RNA polymerase III antibodies, ATA anti-DNA topoisomerase I antibodies, IC immune complex, IL interleukin, LPS lipopolysaccharide, NFκB nuclear factor kappa B, NHS normal healthy subjects, TGF tumor growth factor
Fig. 14
Fig. 14
TGF-β1, Pro-collagenIα1, IL-8 and IL-6 in fibroblasts pretreated with p38MAPK inhibitor and incubated with SSc-ICs or NHS-ICs. Fibroblasts pretreated with SB202190 (20 μmol), a p38MAPK inhibitor, and then exposed to SSc-ICs or NHS-ICs (1:2 dilution). LPS (1 μg/ml) and TGF-β1 (10 ng/ml) used as positive controls. Results expressed as percentage of inhibition of a TGF-β1, b Pro-CollagenIα1, c IL-8 and d IL-6 in untreated versus SB202190-treated cells. *p < 0.01, **p < 0.001, ***p < 0.0001 versus medium. ACA anti-centromeric protein antibodies, anti-Th/To anti-Th/To antibodies, ARA anti-RNA polymerase III antibodies, ATA anti-DNA topoisomerase I antibodies, IC immune complex, IL interleukin, LPS lipopolysaccharide, NHS normal healthy subjects, MAPK p38 mitogen activated kinase, TGF tumor growth factor
Fig. 15
Fig. 15
IL-6 and IL-8 in culture supernatants from dcSSc fibroblasts incubated with SSc-ICs or NHS-ICs. dcSSc fibroblasts exposed to SSc-ICs or NHS-ICs (1:2 dilution). Poly(I:C) and LPS, at concentration of 1 μg/ml, used as positive controls. a IL-6; b IL-8. *p < 0.01, **p < 0.001, ***p < 0.0001 versus medium. ACA anti-centromeric protein antibodies, anti-Th/To anti-Th/To antibodies, ARA anti-RNA polymerase III antibodies, ATA anti-DNA topoisomerase I antibodies, IC immune complex, IL interleukin, LPS lipopolysaccharide, NHS normal healthy subjects, poly(I:C) polyinosinic-polycytidylic acid

References

    1. Denton CP, Khanna D. Systemic sclerosis. Lancet. 2017;390:1685–1699. doi: 10.1016/S0140-6736(17)30933-9. - DOI - PubMed
    1. Mehra S, Walker J, Patterson K, Fritzler MJ. Autoantibodies in systemic sclerosis. Autoimmun Rev. 2013;12:350–354. doi: 10.1016/j.autrev.2012.05.011. - DOI - PubMed
    1. Kayser C, Fritzler MJ. Autoantibodies in systemic sclerosis: unanswered questions. Front Immunol. 2015;6:167. doi: 10.3389/fimmu.2015.00167. - DOI - PMC - PubMed
    1. Nihtyanova SI, Denton CP. Autoantibodies as predictive tools in systemic sclerosis. Nat Rev Rheumatol. 2010;6:112–116. doi: 10.1038/nrrheum.2009.238. - DOI - PubMed
    1. Valentini G, Marcoccia A, Cuomo G, Vettori S, Iudici M, Bondanini F, et al. Early systemic sclerosis: analysis of the disease course in patients with marker autoantibody and/or capillaroscopic positivity. Arthritis Care Res. 2014;66:1520–1527. doi: 10.1002/acr.22304. - DOI - PubMed

Publication types

MeSH terms