. 2018 Oct 22;11(10):dmm035220.
doi: 10.1242/dmm.035220.

One month of hyperglycemia alters spectral responses of the zebrafish photopic electroretinogram

Affiliations

One month of hyperglycemia alters spectral responses of the zebrafish photopic electroretinogram

Zaid Tanvir et al. Dis Model Mech. .

Abstract

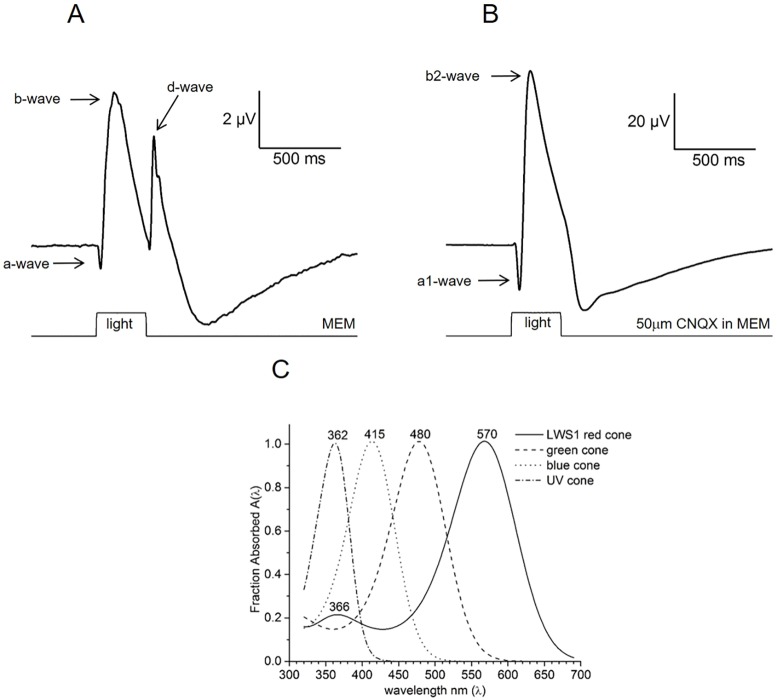
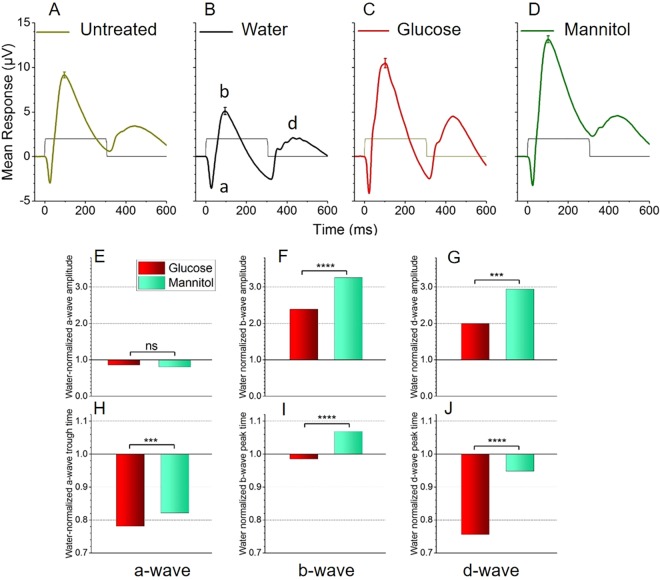
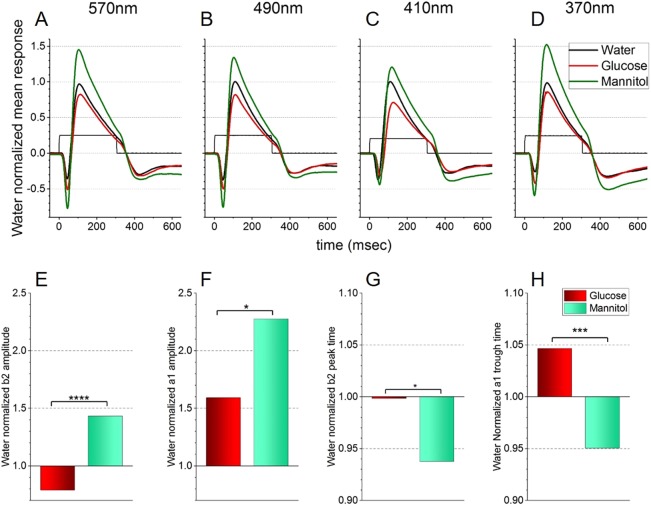
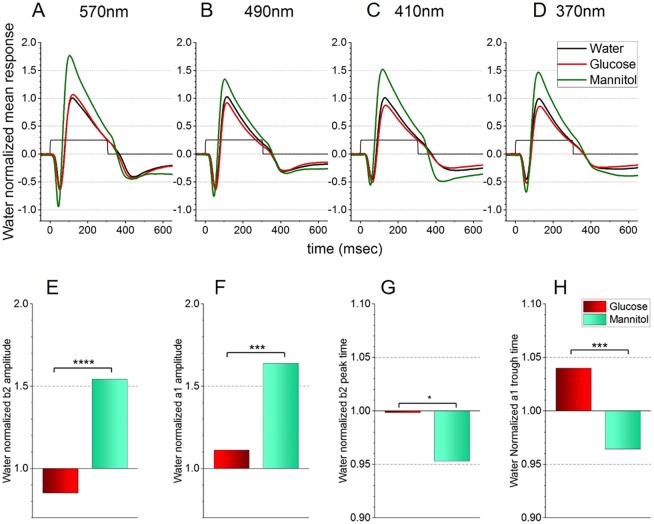
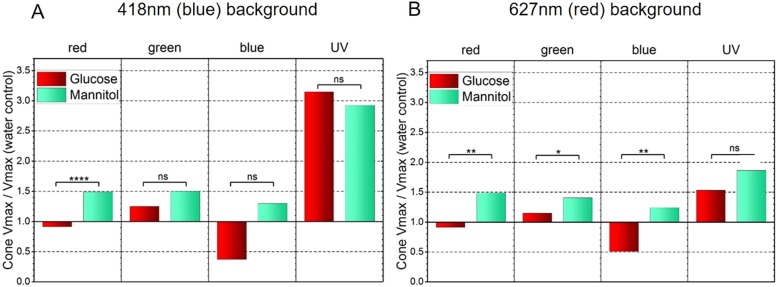
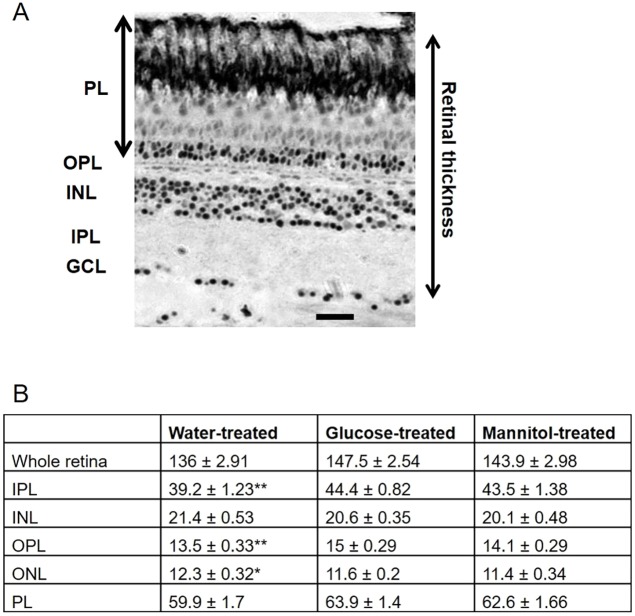
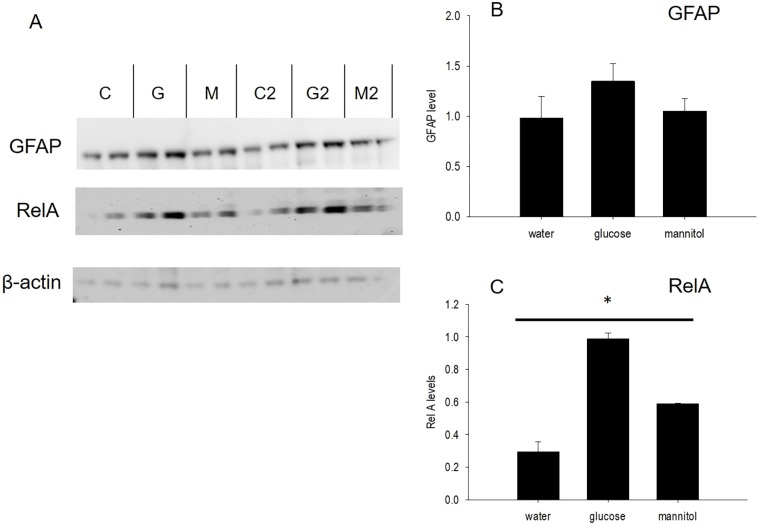
Prolonged hyperglycemia can alter retinal function, ultimately resulting in blindness. Adult zebrafish adults exposed to alternating conditions of 2% glucose/0% glucose display a 3× increase in blood sugar levels. After 4 weeks of treatment, electroretinograms (ERGs) were recorded from isolated, perfused, in vitro eyecups. Control animals were exposed to alternating 2% mannitol/0% mannitol (osmotic control) or to alternating water (0% glucose/0% glucose; handling control). Two types of ERGs were recorded: (1) native ERGs measured using white-light stimuli and medium without synaptic blockers; and (2) spectral ERGs measured with an AMPA/kainate receptor antagonist, isolating photoreceptor-to-ON-bipolar-cell synapses, and a spectral protocol that separated red (R), green (G), blue (B) and UV cone signals. Retinas were evaluated for changes in layer thickness and for the inflammatory markers GFAP and Nf-κB (RelA or p65). In native ERGs, hyperglycemic b- and d-waves were lower in amplitude than the b- and d-waves of mannitol controls. Alteration of waveshape became severe, with b-waves becoming more transient and ERG responses showing more PIII-like (a-wave) characteristics. For spectral ERGs, waveshape appeared similar in all treatment groups. However, a1- and b2-wave implicit times were significantly longer, and amplitudes were significantly reduced, in response to hyperglycemic treatment, owing to the functional reduction in signals from R, G and B cones. Nf-κB increased significantly in hyperglycemic retinas, but the increase in GFAP was not significant and retinal layer thickness was unaffected. Thus, prolonged hyperglycemia triggers an inflammatory response and functional deficits localized to specific cone types, indicating the rapid onset of neural complications in the zebrafish model of diabetic retinopathy.

Keywords: A-wave; B-wave; Diabetes; Glucose; ON bipolar; Outer retina.


Conflict of interest statement

Competing interestsThe authors declare no competing or financial interests.

Figures

Fig. 1.
Fig. 1.
Mean ERG waveforms in native and spectral datasets. (A) Native ERG is the mean response to 70 white-light stimuli (Xenon) covering a 3.5 log unit range in brightness in a water-treated control eyecup. The eyecup perfusate does not contain CNQX. In the absence of blocker, native a-, b- and d-waves are evident. (B) Mean spectral ERG trace in the presence of 50 µM CNQX from a water-treated control retina (blue background) showing the a1-wave and b2-wave components. This mean is from 70 stimuli of wavelengths between 330 nm and 650 nm, covering a 3.5 log unit range in brightness at each wavelength. The AMPA/KA receptor blocker limits the ERG components to those arising from cones and ON-type bipolar cells. CNQX induces an increase in a- and b-wave amplitudes. In A and B, the stimulus ranges were adjusted to evoke responses from threshold to near saturation. The examples are from individual treated eyes. (C) Opsin absorbance spectra of UV (362 nm), blue (415 nm), green (480 nm) and red (570 nm) zebrafish cone types. The 366 nm secondary peak is the R cone beta band. These absorbance spectra are integrated into the spectral model used to extract individual cone component responses from the massed signal of the ERG across wavelengths. R, G and B cone spectra are from Hughes et al. (1998); the UV spectrum is from Palacios et al. (1996).
Fig. 2.
Fig. 2.
Changes in glucose versus mannitol native ERG parameters with white-light stimulus. Under ‘native ERG’ conditions, white-light stimuli evoked a-, b- and d-waves in all treatments (a-, b- and d-waves are labeled in B). (A-D) Mean ERG response from untreated fish removed directly from stock tanks (A), and water-treated (B), glucose-treated (C) and mannitol-treated (D) fish. Mean waveforms differ among treatment groups and a handling stress – identified by the reduced values in water-treated controls – was observed. Glucose- and mannitol-treated responses were subsequently normalized to water control values to account for this handling stress. All stimuli are white light (Xenon) attenuated by 3 log units on an IR background, and evoked near-saturated amplitudes. Untreated (A), glucose (C) and mannitol (D) waveforms reflect the mean of 300 responses from 10 eyes; the water (B) waveform is a mean of 210 responses from 7 eyes. The error bars at the b-wave peaks are s.e.m. The rectangular trace shows the 300 ms light stimulus. (E-J) Mean ERG parameters from the response traces in A-D normalized to water control values and compared. Glucose treatment increased the a-wave amplitude, but not significantly (E). In contrast, b-wave and d-wave amplitudes were significantly reduced in glucose-treated retinas compared with mannitol-treated retinas (F,G). Glucose treatment also quickened a-wave (H), b-wave (I) and d-wave (J) implicit times (time-to-peak). The water-treated mean control values were as follows: (E) −2.95±0.20 µV, n=211; (F) 3.19±0.40 µV, n=211; (G) 1.27±0.23 µV, n=211; (H) 28.9±0.46 ms, n=189; (I) 98.9±1.21 ms, n=188; (J) 150.8±5.15 ms, n=210. Asterisks use GraphPad significance convention for Student's t-tests (ns, P>0.05; ***P≤0.001; ****P≤0.0001).
Fig. 3.
Fig. 3.
Treatment effects on spectral ERG signals from outer retina (blue background). Responses are recorded on a blue (418 nm) background that selectively suppressed B and G cones. Distal retina b2-wave and a1-wave amplitudes are isolated with an AMPA/KA receptor antagonist (CNQX, 50 µM), which isolates signals from cones and from ON bipolar cell synapses. (A-D) Mean waveforms to saturating monochromatic stimulation near the absorbance peaks for R cones (A), G cones (B), B cones (C) and UV cones (D). For each wavelength the irradiance is a 2 log unit attenuation of the beam, with energies ranging from 5.4 log(hν µm−2 s−1) at 370 nm to 6.0 log(hν µm−2 s−1) at 490 nm. (E-H) Mean normalized response amplitudes for b2-wave (E) and a1-wave (F) and mean time-to-peak for b2-wave (G) and a1-wave (H). Glucose, n=104 responses from 13 eyes; mannitol, n=100 responses from 15 eyes; water, n=84 responses from 13 eyes. With these stimuli, glucose-treated fish show reduction in overall mean a1 and b2 amplitudes and longer implicit times. Data from all intensities are shown in Fig. S3A-D. Asterisks denote significant differences (Student's t-tests, GraphPad asterisk convention; *P≤0.05; ***P≤0.001; ****P≤0.0001). The water control values (from 84 responses, 13 eyes) used for normalization were as follows: a1 amplitude, 4.5±0.4 µV; b2 amplitude, 22.0±2.2 µV; a1 peak time, 52.7±1.3 ms; b2 peak time, 118.5±1.8 ms.
Fig. 4.
Fig. 4.
Treatment effects on spectral ERG signals from the outer retina (red background). Responses are recorded on a red (627 nm) background. b2-wave and a1-waves are isolated with an AMPA/KA receptor antagonist (CNQX, 50 µM), which blocks horizontal cell, OFF bipolar cell and inner retina responses. (A-D) Responses to saturating monochromatic stimulation near the absorbance peaks for R cones (A), G cones (B), B cones (C) and UV cones (D). For each wavelength, the irradiance is a 2 log unit attenuation of the beam, with energies ranging from 5.4 log(hν µm−2 s−1) at 370 nm to 6.0 log(hν µm−2 s−1) at 490 nm. (E-H) Mean normalized response amplitudes for b2-wave (E) and a1-wave (F), and mean time-to-peak for b2-wave (G) and a1-wave (H). Glucose, n=112 responses (14 eyes); mannitol, n=108 responses (14 eyes); water, n=104 responses (14 eyes). At these stimulating wavelengths, glucose-treated fish show reduced a1 and b2 amplitudes compared with those of mannitol-treated fish, and longer implicit times. Data from all intensities are shown in Fig. S3E-H. The water control values used (from 104 responses, 14 eyes) were as follows: a1 amplitude, 7.5±0.5 µV; b2 amplitude, 18.3±1.6 µV; a1 peak time, 57.8±0.7 ms; b2 peak time, 125.9±1.8 ms (Student's t-test, GraphPad asterisk convention; *P≤0.05; ***P≤0.001; ****P≤0.0001).
Fig. 5.
Fig. 5.
Spectral ERG model identifies changes in peak signals of cone types. R, G, B and UV cone signal amplitudes in the ERG b2-wave for glucose and mannitol groups are extracted using the spectral analysis model (Eqn 1) and normalized to values in the water control. (A) On a blue (418 nm) background, glucose treatments reduce R cone saturation amplitude compared with mannitol treatments. (B) A red 627 nm background identified reduced R cone peak amplitudes in glucose-treated tissue. Additionally, peak amplitude reduction was seen in G and B cones, with respect to mannitol. These ERG b2 signals are b-waves measured under AMPA/KA receptor blockade (50 µM CNQX) and contain only cone and ON bipolar cell signals from the outer retina (Student's t-test, GraphPad asterisk convention; *P≤0.05, **P≤0.01, ****P≤0.0001; ns, nonsignificant). Data points fit to Eqn 1: (A) glucose, 1120; mannitol, 1469; water, 630; (B) glucose, 1190; mannitol, 1750; water, 910. Cone amplitudes (µV) in water treatments were as follows: (A) R, 34.0±0.8; G, 25.6±1.7; B, 6.4±1.2; U, 2.2±0.1; (B) R, 26.5±1.2; G, 33.4±1.4; B, 11.0±1.3; U, 4.3±1.0.
Fig. 6.
Fig. 6.
Mean thickness measurements (±s.e.m.) of retinal layers from tissue exposed to alternating water, glucose or mannitol for 4 weeks. (A) Representative retinal thick section with retinal layers labeled on the left. Measurements were made of each layer from the ganglion cell layer (GCL) to the distal edge of the photoreceptor layer (PL). INL, inner nuclear layer; IPL, inner plexiform layer; OPL, outer plexiform layer. Scale bar: 20 μm. (B) Significant differences were observed for the IPL (P=0.008), OPL (P=0.005) and outer nuclear layer (ONL) (P=0.048) measurements only. In these cases, changes in layer thickness were observed in water-treated, compared with glucose- and mannitol-treated, tissue; however, no differences were observed between glucose- and mannitol-treated animals (*P≤0.05, **P≤0.01). Units are μm. n=7 eyes (water), n=10 eyes (glucose), and n=7 eyes (mannitol).
Fig. 7.
Fig. 7.
GFAP and Nf-κB levels increase in glucose-treated retinas. (A) Western blot probed with antibodies against GFAP (top) and RelA (Nf-κB, middle). β-actin (bottom) served as the loading control. (B,C) Densitometric analysis identified increases in mean GFAP (B) and Nf-κB (C) content in glucose-treated retinal homogenates compared with water-treated or mannitol-treated preparations. C, water-treated control; G, glucose treated; M, mannitol treated. C2, G2 and M2 represent replicates for the C, G and M groups. Error bars represent s.e.m. The asterisk in C indicates that differences in RelA levels were significant across all 3 treatment groups (P≤0.003).

Similar articles

Cited by

References

    1. Acerete L., Balasch J. C., Espinosa E., Josa A. and Tort L. (2004). Physiological responses in Eurasian perch (Perca fluviatilis, L.) subjected to stress by transport and handling. Aquaculture 237, 167-178. 10.1016/j.aquaculture.2004.03.018 - DOI
    1. Adamis A. P. and Berman A. J. (2008). Immunological mechanisms in the pathogenesis of diabetic retinopathy. Semin. Immunopathol. 30, 65-84. 10.1007/s00281-008-0111-x - DOI - PubMed
    1. Agardh E., Bruun A. and Agardh C.-D. (2001). Retinal glial cell immunoreactivity and neuronal cell change sin rats with STZ-induced diabetes. Curr. Eye Res. 23, 276-284. 10.1076/ceyr.23.4.276.5459 - DOI - PubMed
    1. Alvarez Y., Cederlund M. L., Cottell D. C., Bill B. R., Ekker S. C., Torres-Vazquez J., Weinstein B. M., Hyde D. R., Vihtelic T. S. and Kennedy B. N. (2007). Genetic determinants of hyaloid and retinal vasculature in zebrafish. BMC Dev. Biol. 7, 114-130. 10.1186/1471-213X-7-114 - DOI - PMC - PubMed
    1. Alvarez Y., Chen K., Reynolds A., Waghorne N., O'Connor J. and Kennedy B. (2010). Predominant cone photoreceptor dysfunction in a hyperglycaemic model of non-proliferative diabetic retinopathy. Dis. Model. Mech. 3, 236-245. 10.1242/dmm.003772 - DOI - PubMed

Publication types

LinkOut - more resources