. 2018 Oct 1;215(10):2586-2599.
doi: 10.1084/jem.20180778. Epub 2018 Aug 29.

Cell circuits between B cell progenitors and IL-7+ mesenchymal progenitor cells control B cell development

Affiliations

Cell circuits between B cell progenitors and IL-7+ mesenchymal progenitor cells control B cell development

Chris Fistonich et al. J Exp Med. .

Abstract

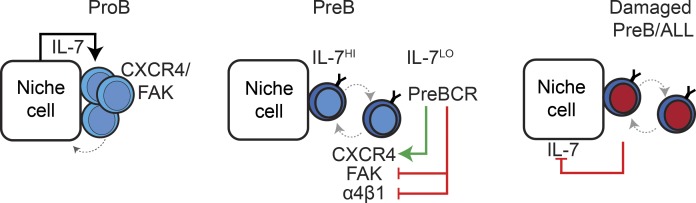
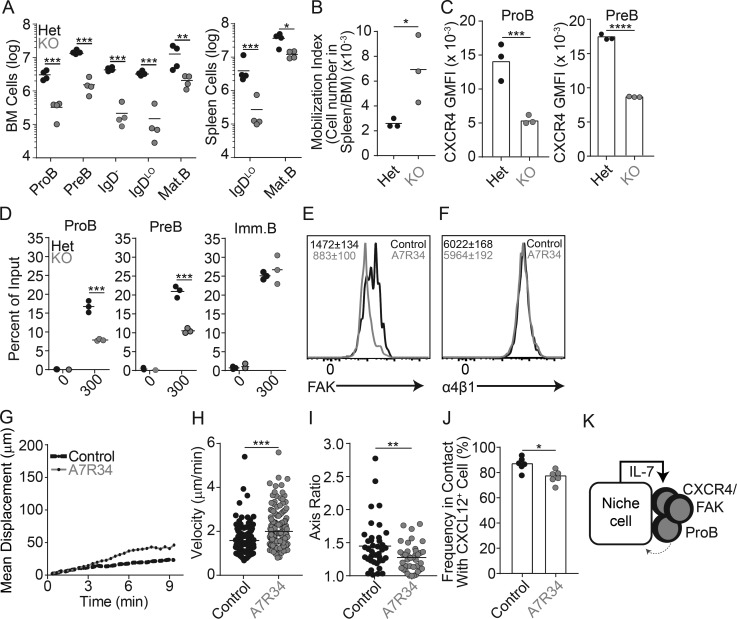
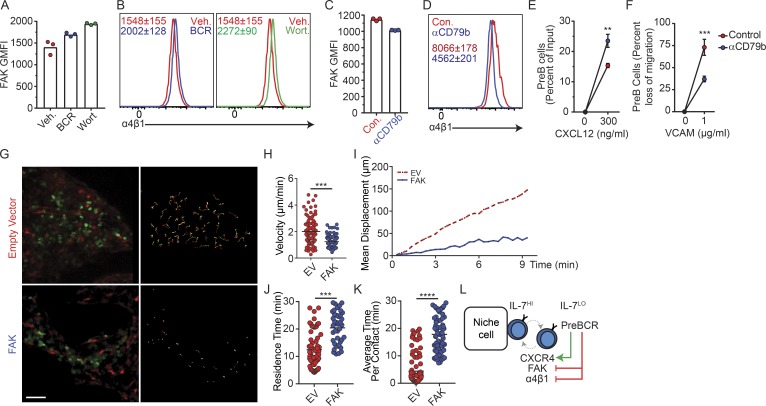
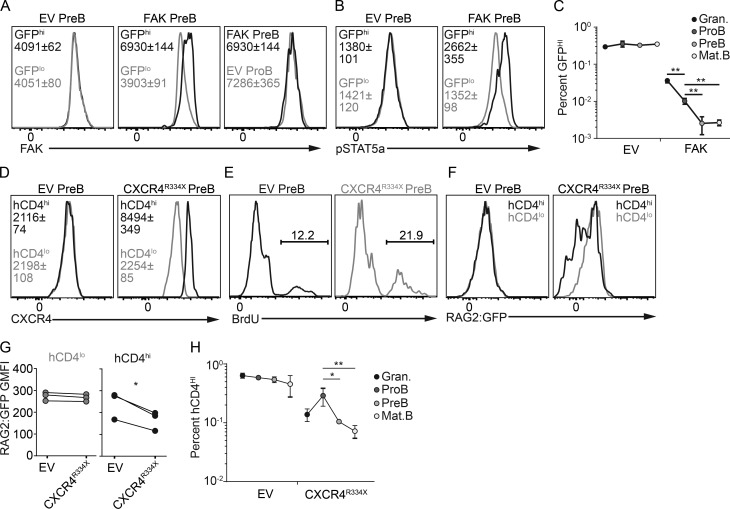
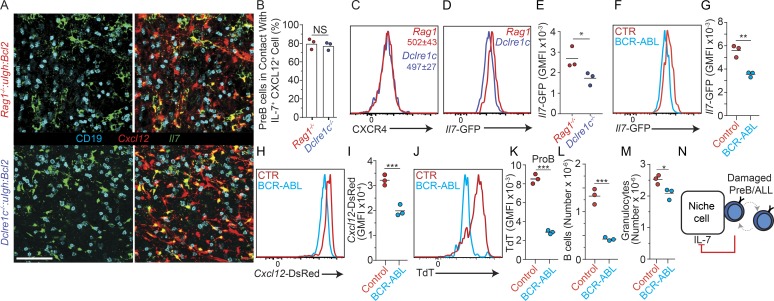
B cell progenitors require paracrine signals such as interleukin-7 (IL-7) provided by bone marrow stromal cells for proliferation and survival. Yet, how B cells regulate access to these signals in vivo remains unclear. Here we show that proB and IL-7+ cells form a cell circuit wired by IL-7R signaling, which controls CXCR4 and focal adhesion kinase (FAK) expression and restricts proB cell movement due to increased adhesion to IL-7+CXCL12Hi cells. PreBCR signaling breaks this circuit by switching the preB cell behavior into a fast-moving and lower-adhesion state via increased CXCR4 and reduced FAK/α4β1 expression. This behavioral change reduces preB cell exposure to IL-7, thereby attenuating IL-7R signaling in vivo. Remarkably, IL-7 production is downregulated by signals provided by preB cells with unrepaired double-stranded DNA breaks and by preB acute lymphoblastic leukemic cells. Combined, these studies revealed that distinct cell circuits control the quality and homeostasis of B cell progenitors.


Figures

None
Graphical abstract
Figure 1.
Figure 1.
Localization of proB and preB cells in relationship to IL-7– and CXCL12-producing cells. (A) Gating strategy for proB and preB cells. Left, BM cells gated on live CD19+ cells. Right, cKit expression distinguishes proB from preB cells. (B) Left, RAG2:GFP fusion protein expression in proB (red) and preB (blue) cells isolated from RAG2:GFP mice. Filled histograms show background fluorescence in wild-type preB cells. RAG2:GFP expression in proB (middle panel) and preB (right panel) in S phase (BrdU+) and in non–S phase (BrdU). (C) Longitudinal 30-µm-thick femur section from lethally irradiated Il7GFP/+ Cxcl12dsRed/+ mouse reconstituted with RAG2:GFP BM cells stained to detect GFP (green), CD19 (cyan), and nuclei (DAPI, not shown). Cxcl12-dsRed fluorescent protein (red) was directly visualized. Data were pooled from two independent experiments (n = 2). (D) Quantification of proB (RAG2:GFPHi) and preB (RAG2:GFPLo) cells in contact with IL-7– and CXCL12-producing cells (see Materials and methods for details). Bars indicate average; circles indicate individual mice. (E) Quantification of colocalized RAG2:GFPHi (proB) and RAG2:GFPLo (preB) in contact with individual IL-7+ CXCL12+ cells (bottom right). Example of a RAG2:GFPHi (arrowheads) and a RAG2:GFPLo (arrows) cell in contact with the same IL-7+ cell. The same datasets were analyzed as in D. Error bars indicate SD. (F) Longitudinal 30-µm-thick section of a femur from a lethally irradiated Il7GFP/+ Cxcl12dsRed/+ mouse reconstituted with Rag1−/− (top panels) or Rag1−/− IghB1-8/+ (bottom panels) BM cells, stained to detect GFP (green) and CD19 (cyan). Cxcl12-dsRed was directly visualized (red). An entire femur/mouse was acquired; data were pooled from three independent experiments (n = 3). (G) Frequency of proB (Rag1−/−) and preB (Rag1−/− IghB1-8/+) cells in contact with IL-7+ CXCL12+ cells. Bars indicate average; circles depict individual mice. *, P < 0.05 by unpaired Student’s t test. Scale bars, 50 µm. Data in all panels are representative of two to five independent experiments.
Figure 2.
Figure 2.
ProB and preB cell migratory behavior in vivo. (A) Distribution of GFP+ proB cells (green, top left) and of preB cells (green, bottom left) in BM calvaria of lethally irradiated Cxcl12dsRed/+ mice reconstituted with Rag1GFP/GFP (top panels) or with Rag1GFP/GFP Igh3-83/+ (bottom panels) BM cells. Movement of GFP+ B cells tracked for 30 min in vivo by IVM. Colored lines (right panels) represent cell trajectories. Scale bar, 50 µm. (B) Median velocity (micrometers per minute). Each circle represents a single cell analyzed. (C) Mean motility coefficient of proB and preB cells. Cell displacement from starting coordinates is plotted against time (minutes). Lines represent the mean motility coefficient from three separate videos per mouse. (D) Time (minutes) spent in direct contact with CXCL12+ cells over 30 min. (E) Average time (minutes) proB and preB cells spent in contact with individual CXCL12+ cells. Data are from Video 1. Circles represent single cells analyzed. ****, P < 0.00005 by unpaired Student’s t test. Data in all panels are representative of three independent experiments.
Figure 3.
Figure 3.
CXCR4-mediated migration and VLA4/FAK-mediated adhesion to VCAM-1 in proB and preB cells. (A) CXCR4 expression in proB and preB cells. (B) In vitro transwell (5-µm pore) migration assay of C57BL/6 BM cells toward CXCL12 gradients. Y axis indicates frequency of migrated cells; x axis shows CXCL12 concentration (nanograms per milliliter). (C) α4 integrin expression in proB and preB cells. (D) FAK expression (encoded by Ptk2) in proB and preB cells. (E) Ikaros (encoded by Ikzf1) expression in proB and preB cells. (F) ProB and preB cell migration across VCAM-1–coated transwells (5 µm) toward CXCL12 gradient (300 ng/ml). Y axis indicates percent reduction in migratory cells; x axis shows VCAM-1 concentration (micrograms per milliliter) used for coating transwells. (B and F) Error bars indicate SD of three individual experiments. Numbers inside all histograms indicate geometric mean fluorescence intensity ± SD (n = 3 mice in each group). *, P < 0.05 by unpaired Student’s t test. Data in all panels are representative of three to five independent experiments.
Figure 4.
Figure 4.
Relationship between IL-7R signaling and CXCR4-mediated proB cell motility. (A) Total number of developing B cell subsets from femur and tibia (left) and from spleen (right) of mice conditionally deficient in IL-7Ra in B-lineage cells: Mb1Cre/+ Il7raFl/+ (black) and Mb1Cre/+ Il7raFl/Fl (gray) mice. (B) Mobilization index: ratio of proB and preB cell number in the spleen to that in the BM of Mb1Cre/+ Il7raFl/+ (Het, black) and Mb1Cre/+ Il7raFl/Fl (KO, gray) mice. Circles depict individual mice. (C) CXCR4 geometric mean fluorescence intensity (GMFI) in proB cells (left) and preB cells (right) gated as in A in Mb1Cre/+ Il7raFl/+ (Het, black) and Mb1Cre/+ Il7raFl/Fl (KO, gray) mice. (D) In vitro transwell (5 µm) migration assay of Mb1Cre/+ Il7raFl/+ (Het, black) and Mb1Cre/+ Il7raFl/Fl (KO, gray) BM cells toward CXCL12 gradients. Y axis indicates frequency of migrated cells; x axis shows CXCL12 concentration (nanograms per milliliter). (A–D) Lines indicate mean; circles depict individual mice (n = 3). (E) FAK expression in proB cells isolated from C57BL/6 mice untreated (littermate controls, black) or treated with anti–IL-7Ra blocking antibodies (gray) for 36 h. (F) α4 integrin expression in proB cells isolated from C57BL/6 mice treated with isotype control (black) or anti–IL-7Ra blocking antibody (gray) for 36 h. (E and F) Numbers inside histograms indicate geometric mean fluorescence intensity ± SD (n = 3 mice in each group). (G) Mean motility coefficient of proB cells in mice untreated (black) or treated with IL-7Ra blocking antibodies (gray) for 36 h. GFP+ proB cells were visualized in calvaria of lethally irradiated Cxcl12dsRed/+ mice reconstituted with BM cells from Rag1GFP/GFP mice. ProB cell movement was tracked for 30 min in vivo by IVM. Lines represent the mean motility coefficient from three separate videos per mouse. (H) Median velocity. Circles, individual cells. (I) Measurement of cell axis ratio of GFP+ proB cells before (black) and after (gray) treatment with anti–IL-7Ra blocking antibody. Each point represents an individual cell analyzed. (J) Frequency of GFP+ proB cells found in contact with Cxcl12-dsRed cells in mice treated with IL-7Ra blocking antibody (gray) or untreated (black). Circles, average from individual fields of view. (K) Model of the proB/IL-7+ cell circuit. *, P < 0.05; **, P < 0.005; ***, P < 0.0005; ****, P < 0.00005 by unpaired Student’s t test. Data in all panels are representative of two to four independent experiments.
Figure 5.
Figure 5.
Relationship between preBCR signaling and CXCR4- and integrin-mediated preB cell motility. (A) FAK geometric mean fluorescence intensity (GMFI) in preB cells from C57BL/6 mice treated with BCR signaling inhibitors (blue, fostamatinib and ibrutinib) or vehicle (red), or with PI3K inhibitor wortmannin (green) or vehicle (red) for 6 h in vitro. (B) α4 integrin expression in preB cells of C57BL/6 mice treated as in A. Numbers indicate geometric mean fluorescence intensity ± SD (n = 3 mice per condition). (C and D) FAK geometric mean fluorescence intensity (C) and α4 integrin expression (D) in preB cells treated with stimulatory CD79b antibody for 6 h in vitro. Con., control. (A and C) Bars indicate mean; circles depict individual mice/assays. (D) Numbers inside histogram indicate geometric mean fluorescence intensity ± SD (n = 3 individual mice/assays). (E) Transwell migration toward CXCL12 of preB cells treated with stimulatory CD79b antibody for 6 h in vitro. Y axis indicates frequency of migrated cells; x axis indicates CXCL12 concentration (nanograms per milliliter). (F) PreB cell migration across VCAM-1–coated transwells (5 µm) toward CXCL12 gradient (300 ng/ml). Y axis indicates percent reduction in migrated cells; x axis indicates VCAM-1 concentration (micrograms per milliliter) used for coating transwells. (E and F) Circles represent average of three independent experiments. Error bars indicate SD. (G) Distribution of EV-transduced GFP+ preB-ALL cells (green, top left) and of FAK-transduced GFP+ preB-ALL cells (green, bottom left) in BM calvaria of Cxcl12dsRed/+ mice at day 14 after transplantation. Movement of GFP+ B cells tracked for 30 min by IVM. Colored lines represent cell trajectories (right panels). Scale bar, 50 µm. (H) PreB-ALL cell velocity (micrometers per minute). Each circle represents a single cell analyzed. (I) Mean motility coefficient of EV- and FAK-transduced preB-ALL cells. Cell displacement from starting coordinates is plotted against time (minutes). Lines depict the mean motility coefficient from three videos imaged/mouse. (J) Time (minutes) spent in direct contact with CXCL12+ cells over a 30-min period. (K) Average time (minutes) that EV- and FAK-transduced preB-ALL cells spent in direct contact with individual CXCL12+ cells. (J and K) Circles represent single cells. Data in panels G–K are from Video 3. (L) Model of the preB/IL-7+ cell circuit. **, P < 0.005; ***, P< 0.0005; ****, P < 0.00005 by unpaired Student’s t test. Data in all panels are representative of two to four independent experiments.
Figure 6.
Figure 6.
Relationship between enforced positioning within IL-7+ niches, RAG2 protein stability, and preB cell developmental progression. (A) Overexpression of FAK (Ptk2) or EV reported by GFP in retrovirally transduced BM cells isolated from C57BL/6 mice. FAK expression in preB cells transduced with EV (left) or FAK (middle). Representative histogram of preB cells transduced with FAK compared with proB cells transduced with EV (right). (B) pSTAT5a in EV- or FAK-transduced preB cells. (C) Frequency of EV- (left) or FAK-transduced (right) GFPHi BM B-lineage cells and granulocytes from femur and tibia. (D) Overexpression of CXCR4 R334X (WHIM mutation) in retrovirally transduced BM cells isolated from RAG2:GFP knock-in mice. Transduced cell subsets reported by human CD4. CXCR4 expression in EV- (left) or CXCR4R334X-transduced (right) preB cells gated on hCD4Lo and hCD4Hi cells. (E) BrdU incorporation in EV- (left) or CXCR4R334X-transduced preB cells. Numbers indicate the frequency of BrdU+ cells. (F) RAG2:GFP expression in gated hCD4Hi and hCD4Lo preB cells (EV, left; CXCR4R334X, right). (G) Quantification of RAG2:GFP fusion protein geometric mean fluorescence intensity (GMFI). Circles depict individual mice. (H) Frequency of hCD4Hi B-lineage cells and granulocytes in femur and tibia BM. Circles indicate mean ± SD (n = 3). (C and H) Error bars indicate SD of three independent experiments. Numbers inside histograms (A, B, and D) indicate geometric mean fluorescence intensity ± SD (n = 3 mice in each group). Data in all panels were pooled from three independent experiments. *, P < 0.05; **, P < 0.01 by unpaired Student’s t test (C and H). *, P < 0.05 by paired Student’s t test (G).
Figure 7.
Figure 7.
DNA repair deficiency in preB cells and control of IL-7 expression in vivo. (A) Longitudinal 30-µm-thick femur section of lethally irradiated Il7GFP/+ Cxcl12dsRed/+ mice reconstituted with Rag1−/− VH147Igh Eμ-Bcl2 (top panels) or Dclrec1−/− VH147Igh Eμ-Bcl2 BM stained to detect GFP (green), CD19 (cyan), and cell nuclei (DAPI, not shown). Cxcl12-dsRed fluorescent protein (red) was directly visualized. Scale bar, 50 µm. Images are representative of three individual mice. (B) Quantification of Artemis-deficient (blue) and -sufficient (red) preB cells in contact with IL-7– and CXCL12-producing cells. Bars indicate mean; circles depict individual mice (n = 3). (C) CXCR4 expression in Artemis-deficient (blue) and -sufficient (red) preB cells in vivo. Numbers indicate geometric mean fluorescence intensity (GMFI) ± SD (n = 3). (D) Il7-GFP expression in nonhematopoietic Lepr+ BM cells of lethally irradiated Il7GFP/+ mice reconstituted with Rag1−/− VH147Igh Eμ-Bcl2 or Dclrec1−/− VH147Igh Eμ-Bcl2 BM cells. (E) Quantification of Il7-GFP expression from D. (F) Geometric mean fluorescence intensity of Il7-GFP expression in nonhematopoietic Lepr+ BM cells of Il7GFP/+ mice 2 wk after transfer of 105 BCR-ABL transduced preB cells. (G) Quantification of Il7-GFP expression from F. (H) Geometric mean fluorescence intensity of Cxcl12-dsRed expression in nonhematopoietic Lepr+ BM cells of Cxcl12dsred/+ Il7GFP/+ mice 2 wk after transfer of 105 BCR-ABL preB cells. (I) Quantification of Cxcl12-dsRed expression from H. Lines indicate mean; circles depict individual mice analyzed (n = 3). (J) Terminal deoxynucleotidyl transferase (Tdt) expression in nonleukemic proB cells isolated from mice described in H. (K) Quantification of terminal deoxynucleotidyl transferase expression from J. (L and M) Total CD19+ host B lymphocytes (L) and granulocytes (M) 2 wk after transfer of 105 BCR-ABL transduced preB cells. (E, G, and K–M) Lines indicate mean; circles depict individual mice analyzed (n = 3). (N) Model of damaged preB or preB-ALL cell/IL-7+ cell circuit. Data in all panels are representative of two to four independent experiments. *, P < 0.05; **, P < 0.01; ***, P < 0.001.

Comment in

  • PreB cells are moving on.
    Dixit D, Schwab SR. Dixit D, et al. J Exp Med. 2018 Oct 1;215(10):2483-2484. doi: 10.1084/jem.20181503. Epub 2018 Sep 18. J Exp Med. 2018. PMID: 30228157 Free PMC article.

References

    1. Balabanian K., Lagane B., Pablos J.L., Laurent L., Planchenault T., Verola O., Lebbe C., Kerob D., Dupuy A., Hermine O., et al. 2005. WHIM syndromes with different genetic anomalies are accounted for by impaired CXCR4 desensitization to CXCL12. Blood. 105:2449–2457. 10.1182/blood-2004-06-2289 - DOI - PubMed
    1. Beck T.C., Gomes A.C., Cyster J.G., and Pereira J.P.. 2014. CXCR4 and a cell-extrinsic mechanism control immature B lymphocyte egress from bone marrow. J. Exp. Med. 211:2567–2581. 10.1084/jem.20140457 - DOI - PMC - PubMed
    1. Bednarski J.J., Pandey R., Schulte E., White L.S., Chen B.R., Sandoval G.J., Kohyama M., Haldar M., Nickless A., Trott A., et al. 2016. RAG-mediated DNA double-strand breaks activate a cell type-specific checkpoint to inhibit pre-B cell receptor signals. J. Exp. Med. 213:209–223. 10.1084/jem.20151048 - DOI - PMC - PubMed
    1. Bredemeyer A.L., Helmink B.A., Innes C.L., Calderon B., McGinnis L.M., Mahowald G.K., Gapud E.J., Walker L.M., Collins J.B., Weaver B.K., et al. 2008. DNA double-strand breaks activate a multi-functional genetic program in developing lymphocytes. Nature. 456:819–823. 10.1038/nature07392 - DOI - PMC - PubMed
    1. Carvalho T.L., Mota-Santos T., Cumano A., Demengeot J., and Vieira P.. 2001. Arrested B lymphopoiesis and persistence of activated B cells in adult interleukin 7(-/)- mice. J. Exp. Med. 194:1141–1150. 10.1084/jem.194.8.1141 - DOI - PMC - PubMed

Publication types

MeSH terms