

Fibroblast state switching orchestrates dermal maturation and wound healing
- PMID: 30158243
- PMCID: PMC6113774
- DOI: 10.15252/msb.20178174
Fibroblast state switching orchestrates dermal maturation and wound healing
Abstract
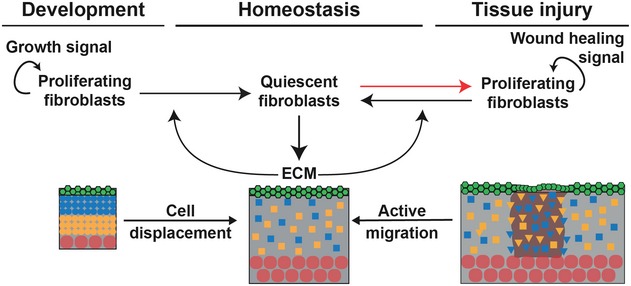
Murine dermis contains functionally and spatially distinct fibroblast lineages that cease to proliferate in early postnatal life. Here, we propose a model in which a negative feedback loop between extracellular matrix (ECM) deposition and fibroblast proliferation determines dermal architecture. Virtual-tissue simulations of our model faithfully recapitulate dermal maturation, predicting a loss of spatial segregation of fibroblast lineages and dictating that fibroblast migration is only required for wound healing. To test this, we performed in vivo live imaging of dermal fibroblasts, which revealed that homeostatic tissue architecture is achieved without active cell migration. In contrast, both fibroblast proliferation and migration are key determinants of tissue repair following wounding. The results show that tissue-scale coordination is driven by the interdependence of cell proliferation and ECM deposition, paving the way for identifying new therapeutic strategies to enhance skin regeneration.
Keywords: dermis development; fibroblast states; mathematical modelling; tissue architecture; wound healing.
© 2018 The Authors. Published under the terms of the CC BY 4.0 license.
Figures
- A
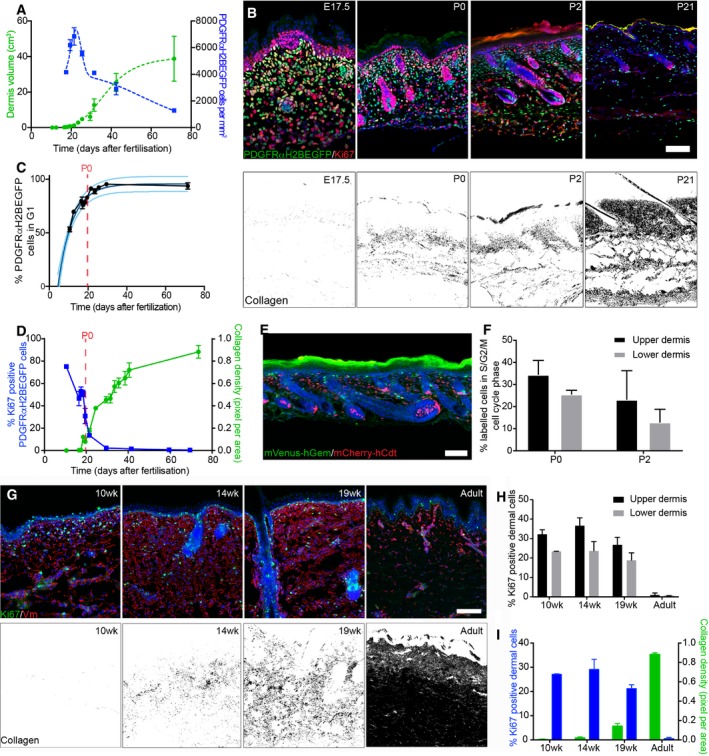
Quantification of fibroblast density (number of PDGFRαH2BEGFP+ cells, right; n = 3 biological replicates per time point) and dermis volume (left) with age (n = 7 for 12.5; n = 8 for 19.5, 25.5; n = 9 for 16.5, 17.5, 23.5; n = 10 for 29.5, 69.5; n = 11 for 10.5; n = 12 for 18.5, 21.5, 40.5; n = 20 for 31.5; biological replicates).
- B
Changes in fibroblast proliferation and collagen deposition during dermal development in mice. Immunofluorescence staining for Ki67 (red) of PDGFRαH2BEGFP (green) back skin at indicated developmental time points (upper panel). Polarised light images of Picrosirius red stained back skin sections shown in binary images at indicated time points (lower panel).
- C
Percentage of PDGFRαH2BEGFP+ cells in G1 cell cycle phase with age (n = 1 for 12.5; n = 2 for 21.5, 29.5; n = 3 for 16.5, 17, 19.5; n = 4 for 10.5; n = 5 for 17.5, 18.5, 69.5; n = 7 for 23.5; biological replicates) fitted using an exponential model.
- D
Quantification of fibroblast proliferation (left; n = 4 for 16.5, 29.5; n = 3 for 10.5, 18.5, 21.5, 41.5, 59.5, 69.5; n = 2 for 17.5, 19.5; biological replicates) and collagen density (right; n = 4 for 16.5, 21.5, 24.5, 29.5, 33.5, 35.5, 41.5, 73.5; n = 3 for 10.5, 17.5, 18.5, 19.5, 31.5, 38.5; biological replicates) with age. Error bars represent standard deviation of the biological replicates.
- E
Immunofluorescence image of R26Fucci2a x Dermo1Cre back skin at P2 where mVenus‐hGem (green) expressing cells are in S/G2/M phase, and mCherry‐hCdt1 (red)‐positive cells are in G1 phase.
- F
Percentage of labelled cells in S/G2/M cell cycle phase in the upper and lower dermis at P0 (n = 3 biological replicates) and P2 (n = 4 biological replicates).
- G–I
Changes in dermal cell proliferation and collagen deposition in human skin. (G) Immunofluorescence staining for vimentin (red) and Ki67 (green) of back skin at indicated time points (upper panel). Polarised light images of Picrosirius red stained back skin section shown as binary image at indicated time points (lower panel). (H) Quantification of proliferating cells in the upper and lower dermis (n = 3 biological replicates per time point). (I) Quantification of dermal cell proliferation (Ki67+) (left) and collagen density (right) with age (n = 3 biological replicates per time point). Note that cells in upper human dermis were more proliferative than cells in the lower dermis at all developmental time points analysed and that fibroblasts entered a quiescent, non‐proliferative state before collagen was efficiently deposited.
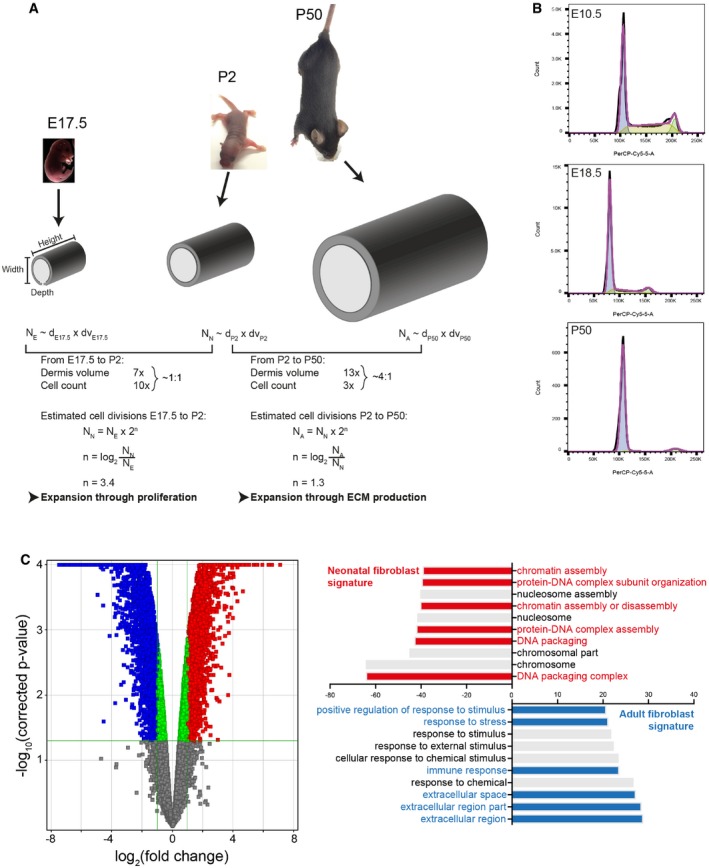
Modelling dermal fibroblast cell divisions during development (adapted from Rognoni et al, 2016). Predicted number of dermal fibroblast divisions during the transition from embryonic (E17.5) to neonatal (P2) and neonatal (P2) to adult (P50) mouse. Height, length and dermis diameter were measured (n = 3 mice per time point and gender), and the dermis volume was estimated by representing the mouse trunk as a cylinder. Cell densities were obtained from Fig 1A, and cell number at E17.5 (NE), P2 (NN) and P50 (NA) was estimated by multiplying cell density and dermis volume. The predicted cell division rate is calculated by the log2 of the Nolder/Nyounger ratio. Calculated values are shown in Table EV1.
Representative cell cycle flow cytometry profiles for indicated time points. Note the sharp decrease in S‐phase with age and the arrest in G1.
Comparative analysis of the transcriptomics of neonatal and adult mouse fibroblasts (GSE32966). The volcano plot (left panel) illustrates the differences in fibroblast gene expression at different ages. Colour code indicates entities not statistically significantly changed (grey), statistically significant but not enriched (green) or significantly changed with fold change > 2 and P‐value smaller than 0.05. Red corresponds to enriched in neonatal and blue to enriched in adult. Gene ontology (GO) analysis (right panel) of neonatal and adult fibroblasts. GO terms are highlighted in neonates (red) and adults (blue).
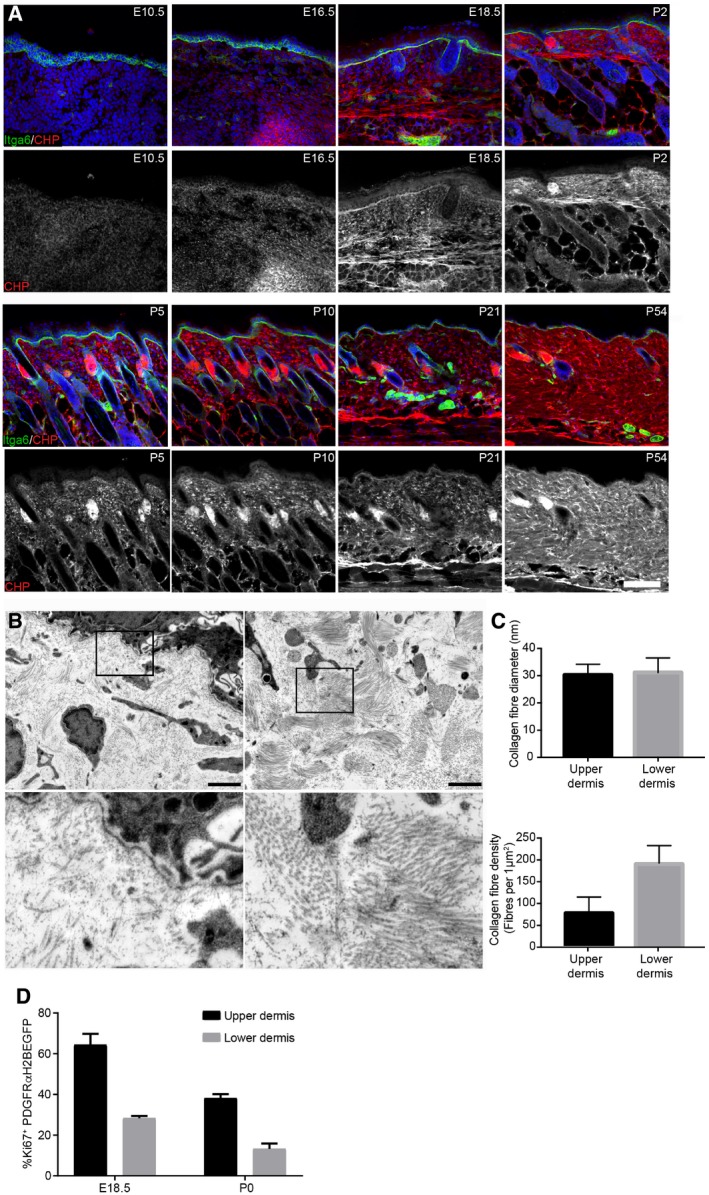
Immunofluorescence staining of back skin sections at indicated developmental time points for Itga6 (green) and collagen (red, white) using the CHP‐biotin probe. Nuclei were labelled with DAPI (blue). Note the appearance of collagen fibres after E18.5.
TEM image of upper (papillary layer, left) and lower (reticular layer, right) dermis at P2. Boxed area is magnified below.
Quantification of collagen fibre diameter (upper panel; n = 42 fibres) and density (lower panel) in upper and lower dermis at P2 (n = 10 areas).
Quantification of proliferating fibroblasts (Ki67+ cells) in the upper and lower dermis at indicated time points (n = 3 E18.5; n = 2 P0 biological replicates).

- A
Two independent primary mouse fibroblast isolations FB1 (black) and FB2 (grey) were cultured in (triangles) and outside (circles) collagen gels for up to 5 days. Cell number was measured by the CellTiter‐Glo assay at indicated time points (n = 3 technical replicates of one representative experiment repeated three times).
- B
Two independent primary mouse fibroblast isolations FB1 (black) and FB2 (grey) were cultured in collagen gels for 3 days before being released by collagenase treatment and plated on TCP for 4 days (triangles). Controls were kept on TCP for 3 days before plating (circles). Fold increase in confluency 24 h after plating of collagen gel released cells and cells kept on TCP is shown (n = 3 technical replicates).
- C
Experimental design of decellularised dermal (DED) organotypic cultures for reconstitution (left panel) and ECM degradation (right panel).
- D, E
Repopulation of DED organotypic cultures recapitulates adult dermal homeostasis. (D) Immunofluorescence staining for Krt14 (green), Ki67 (red) and vimentin (white) of DED organotypic cultures with and without fibroblasts at indicated time points after seeding. (E) Quantification of Ki67‐positive fibroblasts at indicated time point after seeding (n = 8 sections per condition of one representative experiment repeated twice).
- F, G
ECM degradation in DED organotypic cultures by collagenase treatment. (F) Immunofluorescence staining for Krt14 (green), Ki67 (red) and vimentin (white) of DED organotypic cultures at indicated time points after collagenase treatment. (G) Quantification of Ki67‐positive fibroblasts at indicated time points after collagenase treatment (n = 8 sections per condition of one representative experiment repeated twice). Note that fibroblasts around the injection site start to proliferate after 48 h.
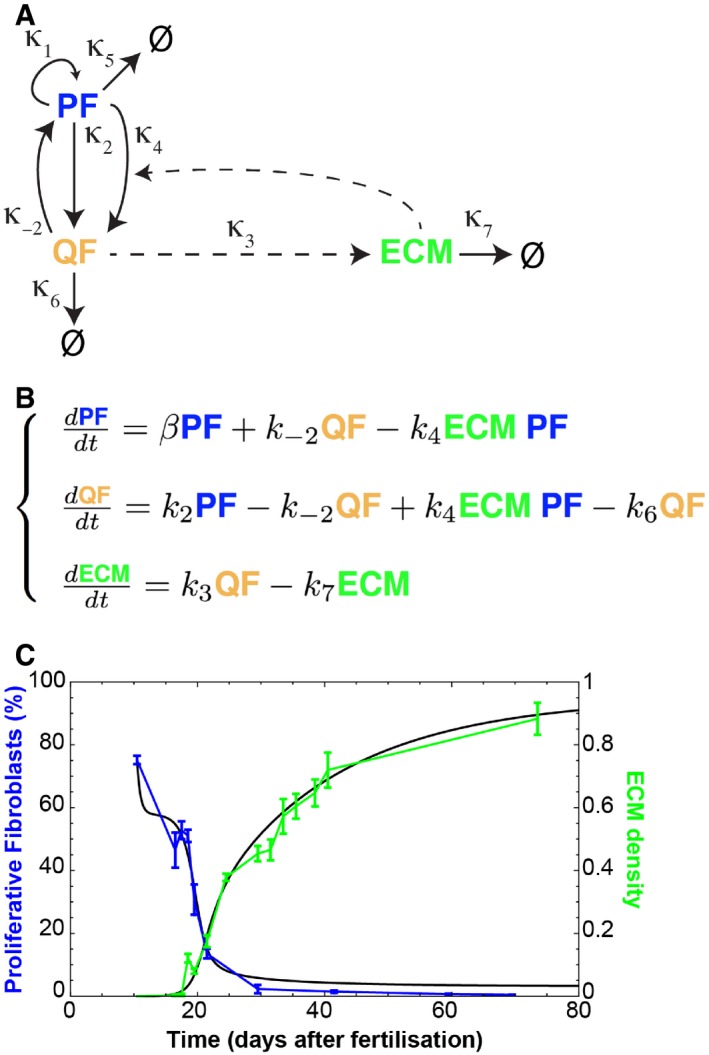
Schematic representation of the assumed relationships between proliferating fibroblasts (PF), quiescent fibroblasts (QF) and extracellular matrix (ECM) during dermal maturation. PF self‐replicate with rate κ1. PF and QF can interconvert with rates κ2 and κ−2, respectively. QF deposit ECM at rate κ3. ECM promotes the switch from PF to QF at rate κ4.
System of ordinary differential equations (ODE) describing the process of dermal maturation. Because the system is dynamic, all entities can decay over time (κ6 is the degradation rate of QF, κ7 is the degradation rate of ECM, κ5 is the degradation rates of PF and is incorporated into β as β = κ1GF – κ2 – κ5 where GF stands for the growth factors we assume exist).
Resulting simulation (black lines) of the system of equations in (B) and experimental data in Fig 1D. Error bars represent standard deviation of the biological replicates.
- A
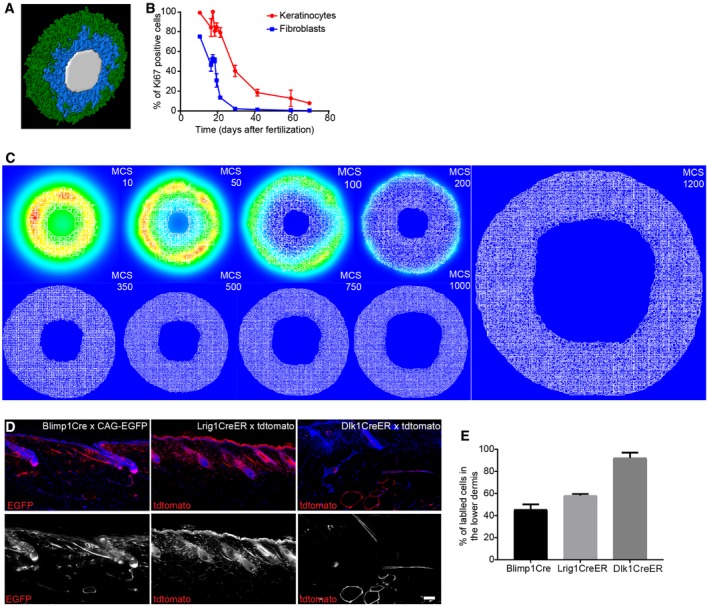
3D visualisation of the simulated mouse body segment. Colour code indicates epidermis in green, proliferating fibroblasts in blue and lumen in white.
- B
Quantification of proliferating (Ki67‐positive) keratinocytes and fibroblasts in skin over time (n = 4 for 16.5, 29.5; n = 3 for 10.5, 18.5, 21.5, 30.5, 63.5, 69.5; n = 2 for 17.5, 19.5; biological replicates). Note that the decrease in proliferation of keratinocytes and fibroblasts follows similar kinetics over time.
- C
Representative simulation images of the epidermal gradients at indicated MCS. Note that the signal concentrates in the immediate surroundings of the epidermal cells and decays over time.
- D, E
In vivo lineage tracing of upper (Blimp1+ and Lrig1+ cells) and lower dermis (Dlk1+ cells) fibroblasts. (D) Immunofluorescence image of tdtomato or CAG‐EGFP‐labelled fibroblasts (red) with the indicated Cre lines. Nuclei were labelled with DAPI (blue). (E) Quantification of the percentage of labelled fibroblasts in the lower dermis of adult mice (> P50) (n = 2 biological replicates). Note the increased abundance of Blimp1Cre‐ and Lrig1CreER‐labelled dermal fibroblasts in the lower dermal layer with age.
- A
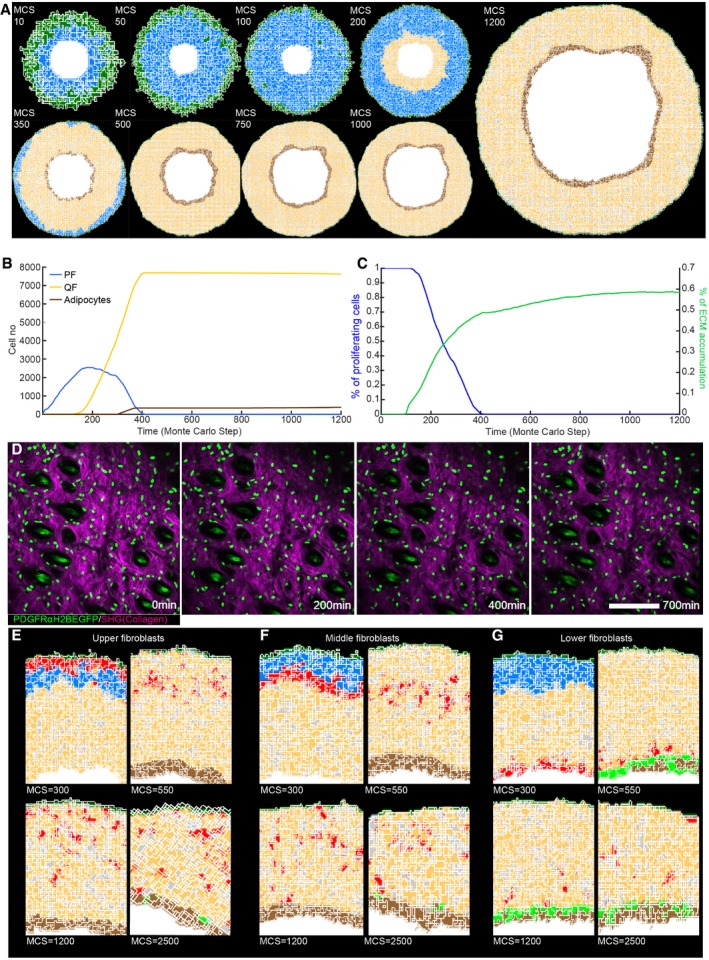
(x,y) Cross‐section of the computational model simulation of the dermal maturation process at the indicated Monte Carlo step (MCS). Colour code indicates epidermis (green), proliferating fibroblasts (blue), quiescent fibroblasts (yellow), ECM (grey) and adipocytes (brown) (see accompanying Movie EV1).
- B
Abundance of the cell populations during the course of the simulation.
- C
Quantification of fibroblast proliferation and ECM density in the simulation.
- D
Live imaging of adult PDGFRαH2BEGFP mouse back skin. Representative time‐lapse images of adult PDGFRαH2BEGFP (green) dermis with collagen shown as second harmonic generation (SHG) in purple at indicated imaging time points. Scale bar, 100 μm (see accompanying Movie EV2).
- E–G
In silico lineage tracing of fibroblasts. (E) Labelling of fibroblasts close to the epidermis at indicated MCS. (F) Labelling of fibroblasts in the middle of the dermis at indicated MCS. (G) Labelling of fibroblasts close to the inside of the body at indicated MCS.
- A, B
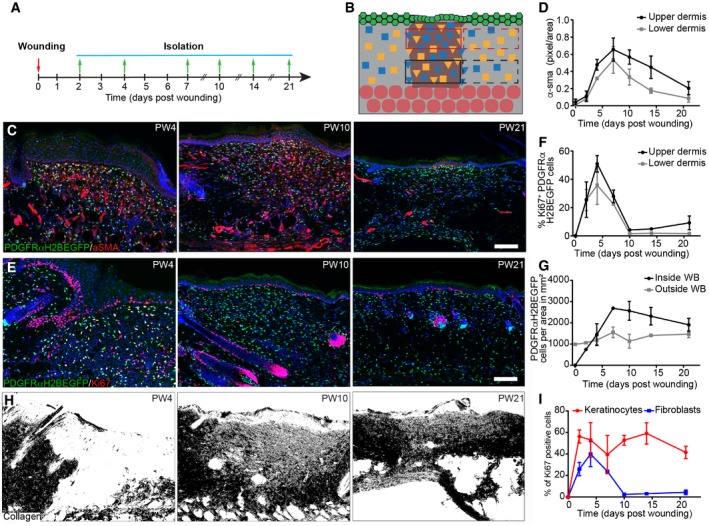
Experimental design of wound healing time course analysis. (A) Wound healing time course. Skin was collected at the indicated time points. (B) Quantification strategy is schematically illustrated. Red boxes upper dermis; black boxes lower dermis; solid lines inside and dashed lines outside the wound site.
- C, D
Fibroblast activation during wound repair. Immunofluorescence staining for α‐sma (red) of PDGFRαH2BEGFP (green) wound sites at indicated postwounding (PW) times (C) and quantification of α‐sma fluorescence intensity in pixels per area inside the upper and lower wound bed (n = 4 PW0, PW2, PW7, PW21; n = 3 PW10, PW14; n = 2 PW4 biological replicates) (D).
- E–H
Changes in fibroblast density, proliferation and collagen deposition during wound repair. (E) Immunostaining for Ki67 (red) of PDGFRαH2BEGFP (green) back skin sections at indicated wound healing time points. (F) Quantification of fibroblast proliferation in the upper and lower dermis inside the wound bed over time (n = 4 PW0, PW2, PW21; n = 3 PW4, PW10; n = 2 PW7, PW14 biological replicates). (G) Quantification of fibroblast density during wound repair inside and outside the wound bed (n = 4 PW0, PW2, PW21; n = 3 PW4, PW10; n = 2 PW7, PW14 biological replicates). (H) Polarised light images of Picrosirius red stained back skin section shown as binary image at indicated time points after wounding.
- I
Quantification of proliferating (Ki67‐positive) keratinocytes and fibroblasts during wound repair over time (n = 4 PW0, PW2, PW21; n = 3 PW4, PW10; n = 2 PW7, PW14 biological replicates).
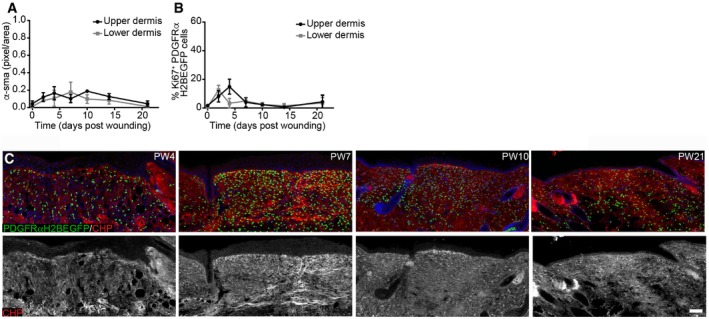
Quantification of α‐sma fluorescence intensity in pixels per unit area in the upper and lower dermis outside the wound bed (n = 4 PW0, PW2, PW7, PW21; n = 3 PW10, PW14; n = 2 PW4 biological replicates).
Quantification of fibroblast proliferation in the upper and lower dermis outside the wound bed over time (n = 4 PW0, PW2, PW21; n = 3 PW4, PW10; n = 2 PW7, PW14 biological replicates).
Immunofluorescence staining of adult PDGFRαH2BEGFP (green) wounds at indicated time points for collagen (red, white) using the CHP‐biotin probe. Note that collagen fibres are appearing at PW7 in the upper and lower wound bed. Nuclei were labelled with DAPI (blue).
- A, B
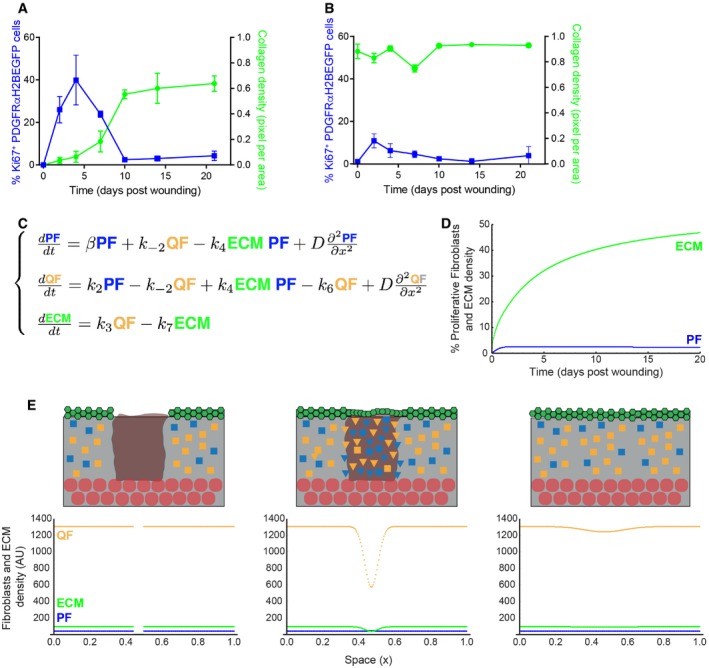
Quantification of fibroblast proliferation (left; n = 4 PW0, PW2, PW21; n = 3 PW4, PW10; n = 2 PW7, PW14 biological replicates) and collagen density (right; n = 4 PW0, PW2; n = 3 PW4, PW7, PW10, PW14; n = 2 PW21 biological replicates) inside (A) and outside (B) the wound bed over time. Error bars represent standard deviation of the biological replicates.
- C
System of partial differential equations describing the process of dermal wound healing. The system in Fig 3B was expanded to incorporate the diffusion coefficient D with the associated spatial term.
- D
Temporal evolution of proliferating fibroblasts (PF) and dermal ECM density over time. The model is able to describe the qualitative behaviour observed in panel (A).
- E
Simulation of dermal wound closure showing the distribution of PF (blue), QF (yellow) and ECM (green) at the time of wounding and at two subsequent time points. From left to right, we performed a wound by imposing that both proliferating cells and ECM are zero in a specific region and simulate the wound healing process during time with the model equations in panel (C). Note that the system re‐establishes the original densities, corroborating the experimental evidence that only the region directly associated with the wound was affected. Please refer to associated Movie EV3. In the schemes above: ECM, grey; wound bed, brown; epidermis, green; adipocytes, round red circles; QF, yellow squares; PF, blue squares; activated fibroblasts, triangles.
- A
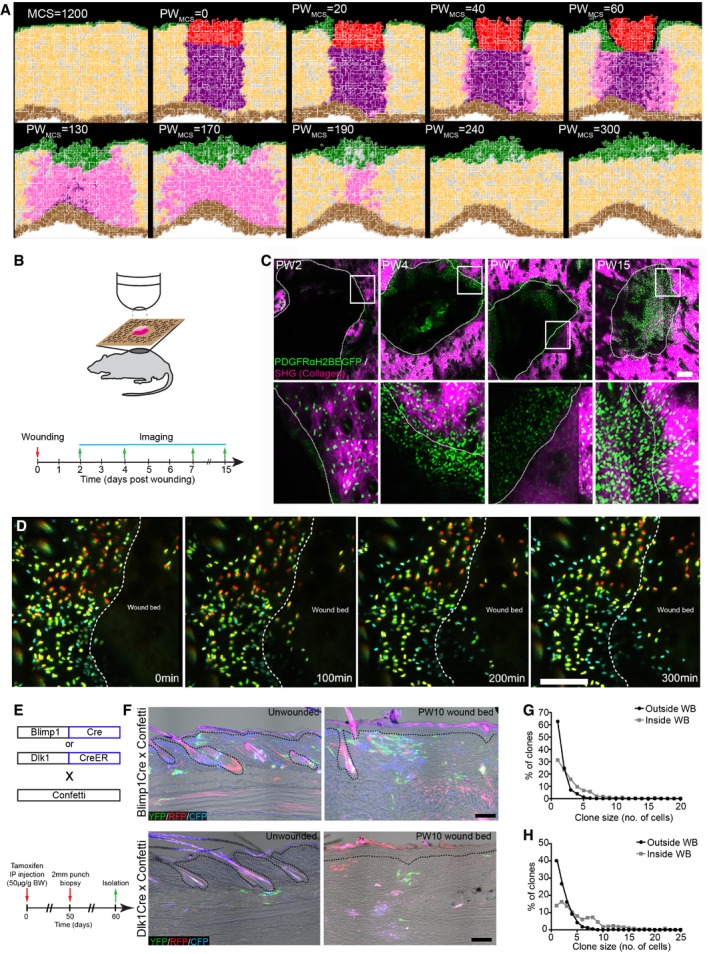
(x,y) Cross‐section of the computational simulation of wound healing in adult dermis. Please refer to associated Movie EV4.
- B–D
Live imaging of adult PDGFRαH2BEGFP back skin during wound healing. (B) Experimental design of in vivo imaging of wound healing. (C) Representative wound bed Z‐stack stitched maximum projections of the entire wound bed (upper panel) showing fibroblasts (green) and collagen with second harmonic generation (SHG) in purple at indicated time points after wounding and before live imaging. Dotted line indicates wound edge, and boxed area indicates the position of the magnified area below. (D) Representative time‐lapse images of adult wound bed at PW4, where Z‐directional movement is visualised by pseudo‐colouring the fibroblast nuclei (red, movement towards the basement membrane; blue, movement away from the basement membrane). Dotted line indicates wound edge. Please refer to associated Movie EV6 which shows fibroblasts actively migrating into the wound bed.
- E–H
In vivo lineage tracing of upper (Blimp1Cre) and lower (Dlk1CreER) dermal fibroblasts during wound healing. (E) Experimental strategy for in vivo lineage tracing. (F) Immunofluorescence image of Blimp1Cre × Confetti (upper panels) and Dlk1CreER × Confetti (lower panel) back skin inside and outside the wound bed at 10 days postwounding. Colours show YFP (green), RFP (red) and CFP (blue) with bright field image overlaid. (G) Clone size quantification of Blimp1Cre‐labelled fibroblasts inside and outside the wound bed at 10 days postwounding (n = 400 clones of four biological replicates). (H) Clone size quantification of Dlk1CreER‐labelled fibroblasts inside and outside the wound bed at 10 days postwounding (n = 300 clones of two biological replicates).
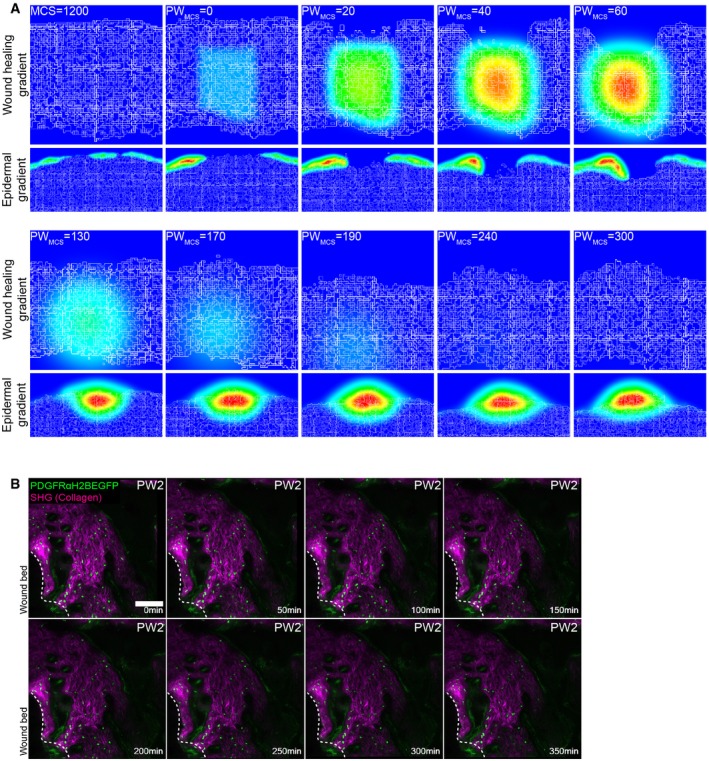
Gradients used in the computational model. Top panel represents the wound healing gradient during the course of the simulation. Bottom panel represents the epidermal gradient in the vicinity of the wound during the course of the simulation.
Representative time‐lapse images of adult PDGFRαH2BEGFP dermal fibroblasts (green) and collagenous extracellular matrix shown with second harmonic generation (SHG) in purple 2 days after wounding. Dotted line indicates wound edge. Note that fibroblasts are not actively migrating at 2 days postwounding. Please refer to associated Movie EV5. Scale bar, 100 μm.
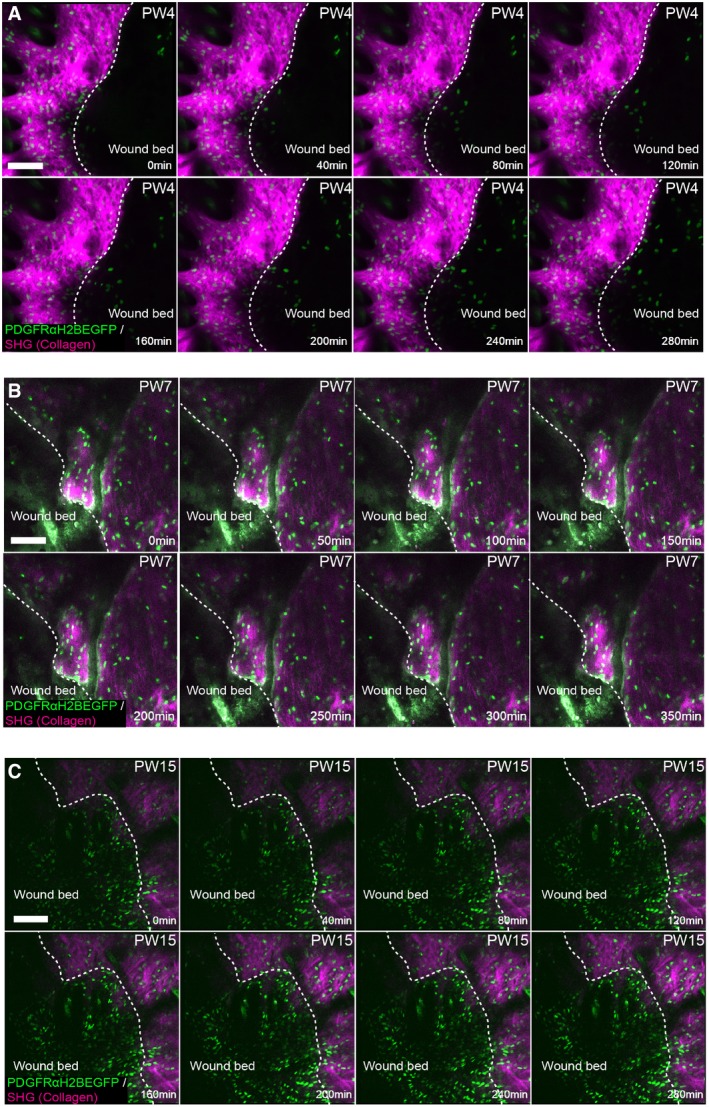
- A–C
Representative time‐lapse images of adult PDGFRαH2BEGFP dermal fibroblasts (green) with collagenous extracellular matrix shown with second harmonic generation (SHG) in purple 4 days (A), 7 days (B) and 15 days (C) after wounding. Dotted line indicates wound edge. Note that fibroblasts are actively migrating at 4 but not at 7 or 15 days postwounding. Please refer to associated Movies EV6 and EV7. Scale bars, 100 μm.
References
-
- Basak O, Beumer J, Wiebrands K, Seno H, van Oudenaarden A, Clevers H (2017) Induced quiescence of Lgr5 + stem cells in intestinal organoids enables differentiation of hormone‐producing enteroendocrine cells. Cell Stem Cell 20: 177–190.e4 - PubMed
Publication types
MeSH terms
Grants and funding
LinkOut - more resources
Full Text Sources
Other Literature Sources
