. 2018 Aug 29;9(1):3498.
doi: 10.1038/s41467-018-05873-3.

Reconciling persistent and dynamic hypotheses of working memory coding in prefrontal cortex

Affiliations

Reconciling persistent and dynamic hypotheses of working memory coding in prefrontal cortex

Sean E Cavanagh et al. Nat Commun. .

Abstract

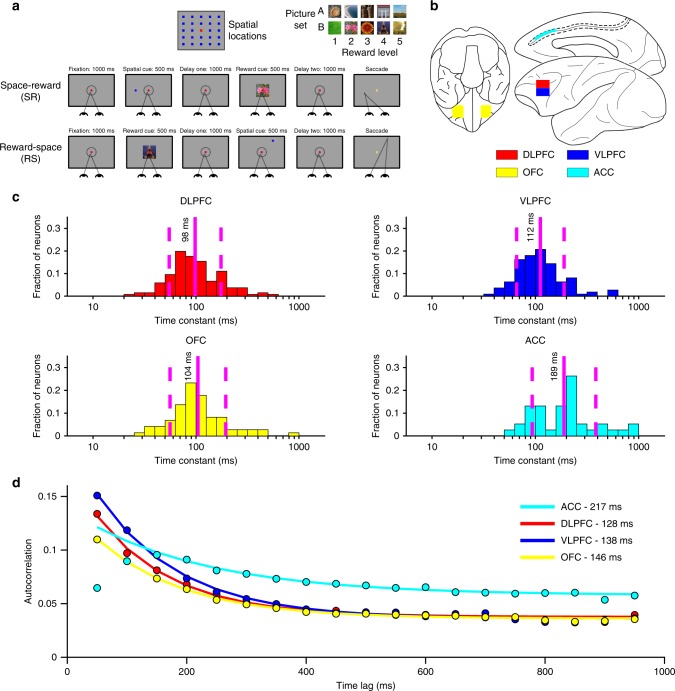
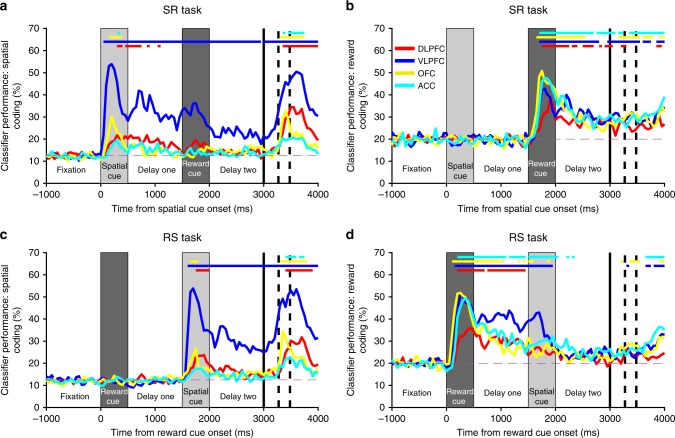
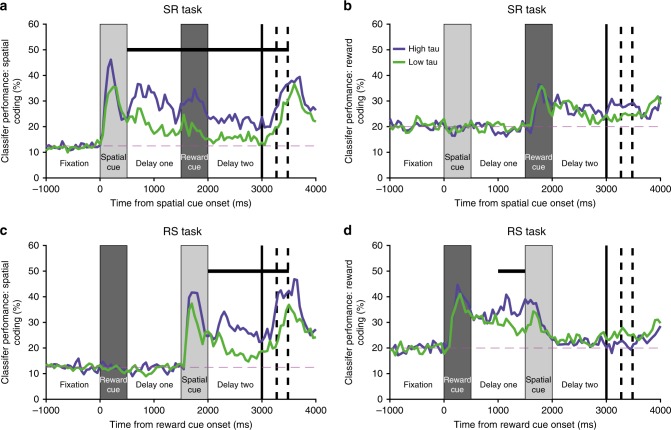
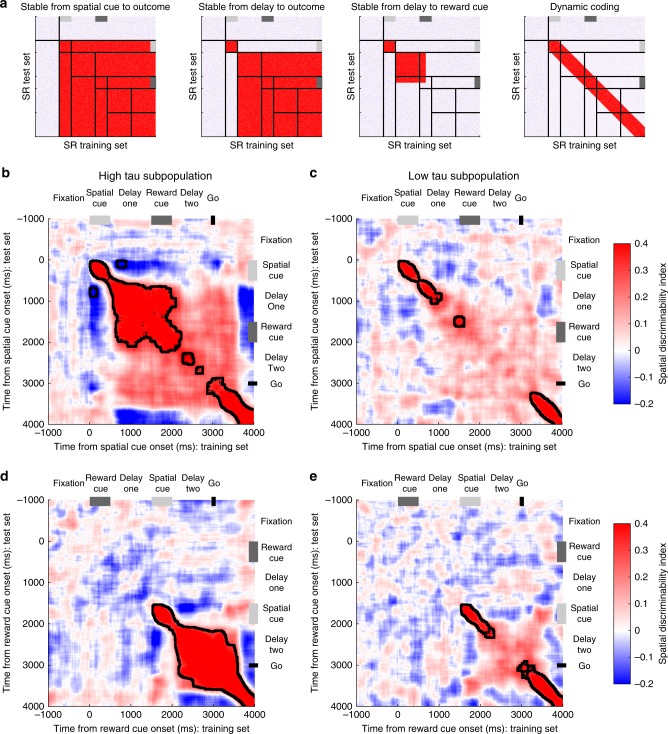
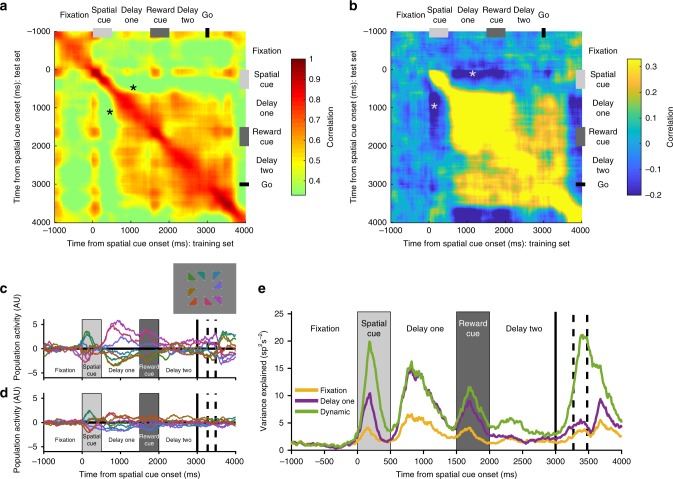
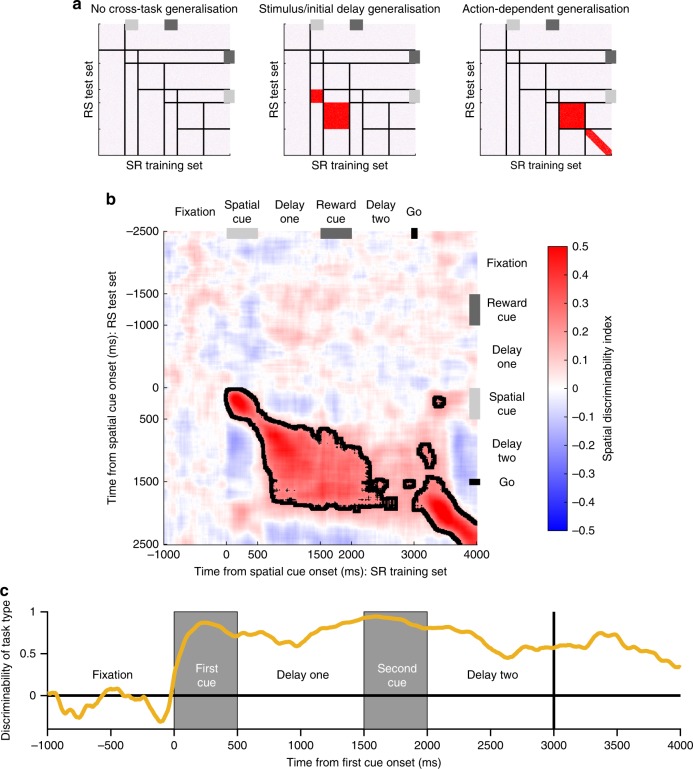
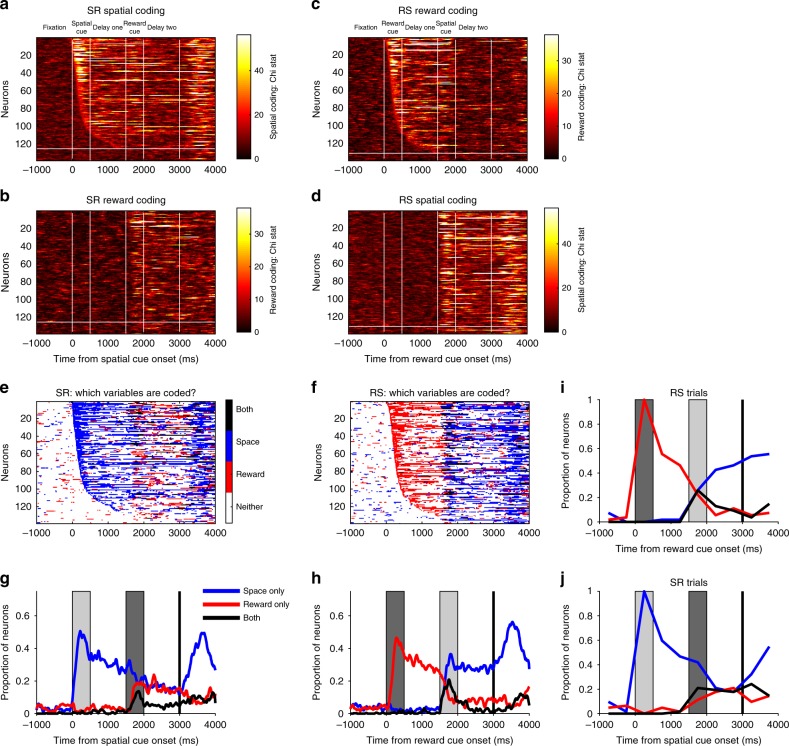
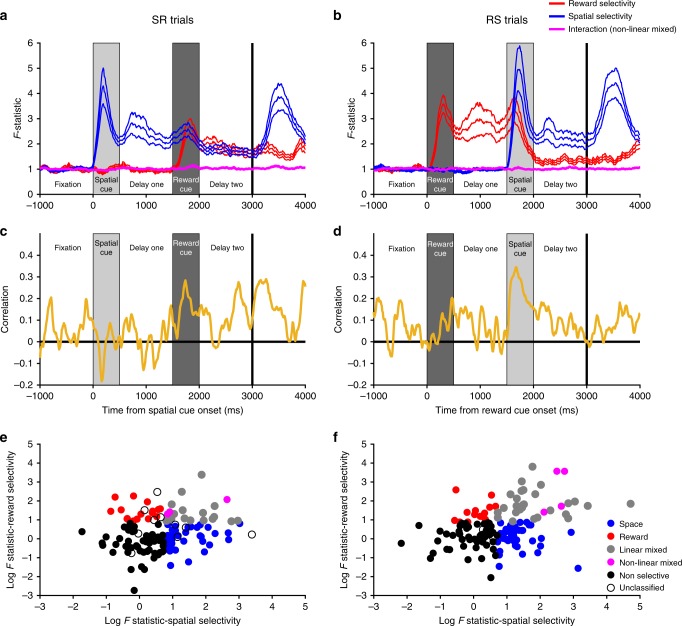
Competing accounts propose that working memory (WM) is subserved either by persistent activity in single neurons or by dynamic (time-varying) activity across a neural population. Here, we compare these hypotheses across four regions of prefrontal cortex (PFC) in an oculomotor-delayed-response task, where an intervening cue indicated the reward available for a correct saccade. WM representations were strongest in ventrolateral PFC neurons with higher intrinsic temporal stability (time-constant). At the population-level, although a stable mnemonic state was reached during the delay, this tuning geometry was reversed relative to cue-period selectivity, and was disrupted by the reward cue. Single-neuron analysis revealed many neurons switched to coding reward, rather than maintaining task-relevant spatial selectivity until saccade. These results imply WM is fulfilled by dynamic, population-level activity within high time-constant neurons. Rather than persistent activity supporting stable mnemonic representations that bridge subsequent salient stimuli, PFC neurons may stabilise a dynamic population-level process supporting WM.


Conflict of interest statement

The authors declare no competing interests.

Figures

Fig. 1
Fig. 1
Overview of reward-varying oculomotor-delayed-response task, recording locations and time-constant analysis. a Reward-varying oculomotor-delayed-response task. Monkeys were trained to remember a spatial position in working memory. They were also presented with a cue indicating the reward size they would receive for successfully completing the trial with a saccade to the remembered location. On SR (Space-Reward) trials, the spatial cue was presented first; whereas on the RS (Reward-Space) trials, the cues were presented in the reverse order. On SR-trials the reward cue, therefore, acted as an intervening behaviourally relevant cue whilst subjects maintained the task-relevant spatial information in working memory. The reward cue images shown are similar, but not identical to those used in the study. b Approximate location of neural recordings drawn onto diagrams based upon the Paxinos brain atlas in F99 space viewed using the scalable brain atlas. Neurons were recorded from anterior cingulate cortex (ACC), dorsolateral prefrontal cortex (DLPFC), ventrolateral prefrontal cortex (VLPFC) and orbitofrontal cortex (OFC). c Histograms of the single-neuron time-constants within the four PFC brain regions. Time-constants are highly variable across neurons. Time-constants differed significantly across areas (Kruskal–Wallis test, p = 2.94 × 10−6), where the longest taus were within ACC (Mann–Whitney U tests; ACC vs. DLPFC, p = 5.13 × 10−7; ACC vs. OFC, p = 2.48 × 10−5; ACC vs. VLPFC, p = 2.72 × 10−5). Solid and dashed vertical lines represent mean (Log(τ)) and mean (Log(τ)) ± SD (Log(τ)), respectively. d Population-level time-constants of firing rate autocorrelation in DLPFC, VLPFC, OFC and ACC during pre-stimulus fixation epoch. Time-constant captures the rate of decay of autocorrelation over time. ACC had the highest and most distinct time-constant of all PFC regions studied
Fig. 2
Fig. 2
Ventrolateral prefrontal neurons maintain information for both spatial and reward stimuli during delay epochs. The mean performance of classifiers (1000 permutations, Methods) trained to decode each task feature (spatial location, a, c; reward level, b, d) are plotted for each brain area and trial type (SR-task, a, b; RS-task, c, d). Ventrolateral prefrontal cortex (VLPFC) is the only region to strongly code information about space and reward across the trial. Notably, the VLPFC activity primarily encodes the factor most recently presented. When the reward cue is shown first (RS-task, c, d), a representation of reward size is maintained throughout delay-one, but falls away when the spatial cue is presented. More surprisingly, a similar weakening of spatial coding is also observed on the SR-task (a), even though this analysis is restricted to trials where the subject remembered the correct spatial location. The VLPFC population strongly encodes and maintains a representation of the remembered spatial location, but this is substantially weakened by the offset of the reward cue. The first solid vertical line signifies when subjects were cued to respond. The first and second dashed vertical lines represent the average timing of the subjects’ saccade and the onset of reward, respectively. Solid coloured horizontal lines represent significant encoding for the corresponding brain region (2.5th percentile of distribution > chance level, p < 0.05, Methods). The dashed magenta line represents chance level classifier performance
Fig. 3
Fig. 3
Ventrolateral prefrontal neurons with higher resting time-constants maintain reward and spatial information across delays. The mean performance of classifiers (1000 permutations, Methods) trained to decode space (a, c) and reward size (b, d) is calculated for two subpopulations of ventrolateral prefrontal cortex (VLPFC) neurons subdivided by resting time-constant. For spatial coding on the SR-task (a), the subpopulation with higher time-constants has a stronger representation during the first delay (first 500 ms p = 0.00313, second 500 ms p = 0.00041, Bonferroni-corrected bootstrap tests; Methods), whilst the reward cue is on screen (p = 7 × 10−5), during delay-two (first 500 ms p = 0.00824, second 500 ms p = 0.01736), and during the early response period (p = 0.0355). The high time-constant population also has stronger spatial coding in delay-two of the RS-task (first 500 ms p = 0.03237, second 500 ms p = 0.0003, c) and in the early response period (p = 0.00461). Ventrolateral PFC high time-constant neurons also code reward more strongly during delay-one of the RS-task (Second 500 ms p = 0.0330, d). Horizontal black bars represent a significant difference between the high and low time-constant subpopulations (Bonferroni-corrected bootstrap test for 10 non-overlapping 500 ms epochs; Methods, p < 0.05). The dashed magenta line represents chance level classifier performance. The first solid vertical line signifies when subjects were cued to respond. The first and second dashed vertical lines represent the average timing of the subjects’ saccade and the onset of reward, respectively
Fig. 4
Fig. 4
Cross-temporal dynamics of spatial selectivity by high and low time-constant populations. a Schematic representing cross-temporal dynamics of different working-memory codes on SR-trials. Each pixel represents how well spatial location can be discriminated when using half of the trials at one timepoint as a training set (X-axis), and the other half of trials at a separate timepoint as a test-set (Y-axis). Off diagonal, the plot indicates the stability of any spatial coding across time. In the first exemplar, stable spatial coding is evident across the trial, as data from any timepoint after cue presentation can be used to decode the remembered spatial location at any other timepoint. The second exemplar is similar, but this stable state is only established following a transient dynamic phase where the cue is initially encoded. The third exemplar shows that this stable state is established during the initial delay—but collapses after the reward cue is presented. The final exemplar shows that spatial location is coded throughout the trial (heat on the diagonal), but that this code is not stable across time. be Cross-temporal decodability of spatial location is plotted for high (b, d) and low (c, e) time-constant VLPFC populations on SR (b, c) and RS (d, e) trials. The high time-constant subpopulation has greater stability of spatial coding: the off-diagonal elements are warm, meaning that the same population code persists throughout the delay epoch following the spatial cue. Despite this stability, there is a negative correlation between the cue period and the delay indicating a reversal of spatial tuning between these epochs. In SR-trials, a stable state is reached during delay-one, but this is disrupted by the presentation of the reward cue, and there is only a weak non-significant cross-temporal generalisation between delay-one and delay-two. A dynamic, rather than stable, representation of space returns around the time of the go cue. In the low time-constant population, coding is always dynamic, so no stable state is established. Black lines encircling areas of strong coding indicate significant cross-temporal stability (p < 0.05, cluster-based permutation test, Methods)
Fig. 5
Fig. 5
VLPFC high time-constant population reverses its spatial coding between cue presentation and the subsequent delay. a Within-condition correlation of neural firing across time for SR-trials (Methods). All bins are positively correlated with each other, suggesting neural firing is stable across time. Note positive correlation between cue period and delay (asterisk). b Within-condition correlation analysis where activity for each neuron was demeaned across each of the spatial locations (Methods). There now exists a negative correlation between the time of the spatial cue presentation and delay-one (asterisk). cd Reversal of VLPFC high time-constant spatial tuning between cue and delay. A mnemonic subspace was defined with time-averaged delay-one activity. The across-trial firing for each condition was projected back onto the first (c) and second (d) principal axes of this subspace. While the conditions remain well-separated on both principal axes during delay-one, the subspace does not generalise well into delay-two as activity from the different conditions converges. At the time of the spatial cue, the conditions appear separable, but in the reverse configuration from that during the delay. The inset shows the geometric location of each spatial location that appeared on the screen. e The stimulus variance captured by three different subspaces is displayed. The fixation subspace is defined by time-averaged activity in the 1000 ms before cue presentation. This should represent a chance level amount of variance explained. The delay-one subspace is defined by time-averaged activity from 500 to 1500 ms after cue presentation. The dynamic subspace is defined separately at each individual time point. The dynamic subspace explains a much greater amount of variance during the cue period, illustrating that there is little consistency in the activity patterns between spatial cue and the delay epochs. However, the delay-one subspace captures as much variance as the dynamic subspace during delay-one, suggesting the VLPFC high-tau population activity has settled to a stable state by this point
Fig. 6
Fig. 6
Cross-generalisation of working memory activity across-trial types. By using data from SR-trials as a training set for a classifier, and data from RS-trials as a test set, the generalisability of spatial coding across task types can be studied. a Exemplars of how population activity may generalise across-trial types. If there is no cross-task generalisation, spatial position cannot be decoded from neural activity on the other trial type. As VLPFC has spatial coding on both trial types (Fig. 2), if there is no cross-task generalisation this would mean there are multiple network patterns of spatial selectivity capable of supporting correct performance. If there is stimulus-locked generalisation, spatial position can be decoded by activity from the other trial type; however, it is relative to cue presentation so the decoding is displaced off the diagonal. In this scenario, spatial location could be readout identically across-trial types using activity post-stimulus presentation (red colour on heatmap), but because spatial selectivity on SR-trials is disrupted by the reward cue (Fig. 4), distinct readout weights would be required at the time of response. If there is action-dependent generalisation, neural activity generalises in delay-two and response epochs as subjects prepare and execute their saccade. This may occur if a different route through neural state space is taken on the two trial types, but the routes converge and the same common trajectory is reached by delay-two. b Cross-generalisability in VLPFC is primarily locked to the presentation of the stimulus. Spatial position cannot be decoded from activity during delay-two, implying distinct population codes on the two trial types in the delay immediately prior to response. Only once the action is initiated (at the go cue), does a cross-trial generalisation appear on the diagonal. Dashed lines encircling areas of strong coding indicate a significant cross-generalisable stability (p < 0.05, cluster-based permutation test, Methods). c Decoding task type. The task the subjects are performing can be accurately decoded from VLPFC neural activity, throughout the trial. This is particularly important during delay-two, as at this point the subject has been exposed to the same visual stimuli, just in reverse order
Fig. 7
Fig. 7
Flexibility of single-neuron selectivity. ab SR-trials: Single neuron coding. a The heatmap shows the spatial coding of individual ventrolateral PFC neurons; each row of the matrix represents single-neuron selectivity. Neurons are sorted by their latency for spatial encoding; all neurons above the horizontal white line were selective for space either during cue presentation or delay-one. For many of these cells, selectivity is transient; few code space across extended periods of the trial. b Reward coding of individual ventrolateral PFC neurons. A large proportion of the neurons which were selective for space subsequently become selective for reward at cue two/delay-two (neurons are sorted in the same order as in a). cd RS-trials: Single neuron coding. Neurons are now sorted by their latency for reward encoding (c), with all neurons above the white line selective during cue presentation or delay-one. Reward encoding is primarily transitory in nature. d This heatmap shows that many of the neurons initially coding reward go on to code the spatial location when this cue is presented. ef The task variables significantly (Methods) encoded by each neuron at each timepoint are plotted for SR (e) and RS-trials (f). gh Fraction of neurons selective for either or both task factors across SR (g) or RS-trials (h). Presentation of the second stimulus reduces the number of neurons selective for the initially presented cue. ij Switching of selectivity across a trial. Neurons are included in this analysis if they were selective during the presentation of the first cue. The selectivity pattern of these neurons is profiled across time. On SR-trials (j), only a minority of cue selective neurons retain an exclusive representation of space across the entire trial; many neurons gain reward coding, some at the expense of spatial selectivity, and others in addition to this. On RS-trials (i), a similar dynamics are observed
Fig. 8
Fig. 8
Absence of non-linear interactions between reward and spatial selectivity. ab The mean population F-statistics from a sliding two-way ANOVA with an interaction term are plotted (±standard error of the mean) for SR (a) and RS (b) trials. The interaction term between both factors does not change from that during pre-trial fixation. cd Sliding spearman correlation between reward and spatial selectivity F-statistics for SR (c) and RS (d) trials. On both trial types, there is a positive correlation at the time of cue two, indicating linear mixed selectivity. ef Spearman correlation of spatial and reward coding F-statistics during cue two for (e) SR-trials; (f) RS-trials. To complement the above analysis, we performed a single spearman correlation between the raw F-statistics from a 2-way ANOVA of spike-counts during the entire cue two period. There was a significant positive correlation on SR-trials (r = 0.175, p = 0.0394) and RS-trials (r = 0.311, p = 2.08 × 10−4). Each dot represents a neuron appropriately coloured. Space and reward neurons were required to have only one significant main effect (p < 0.05) and a non-significant interaction (p > 0.05). Linear mixed neurons were required to have two significant main effects (p < 0.05) and a non-significant interaction (p > 0.05). Non-linear mixed neurons were required to have two significant main effects (p < 0.05) and a significant interaction (p < 0.05). Non-selective neurons had no significant effects (p > 0.05). A very small number of neurons did not meet these criteria so were unclassified. F-statistics have been log-transformed for illustrative purposes

References

    1. Funahashi S, Bruce CJ, Goldman-Rakic PS. Mnemonic coding of visual space in the monkey’s dorsolateral prefrontal cortex. J. Neurophysiol. 1989;61:331–349. doi: 10.1152/jn.1989.61.2.331. - DOI - PubMed
    1. Goldman-Rakic PS. Cellular basis of working memory. Neuron. 1995;14:477–485. doi: 10.1016/0896-6273(95)90304-6. - DOI - PubMed
    1. Fuster JM, Alexander GE. Neuron activity related to short-term memory. Science. 1971;173:652–654. doi: 10.1126/science.173.3997.652. - DOI - PubMed
    1. Bauer RH, Fuster JM. Delayed-matching and delayed-response deficit from cooling dorsolateral prefrontal cortex in monkeys. J. Comp. Physiol. Psychol. 1976;90:293–302. doi: 10.1037/h0087996. - DOI - PubMed
    1. Funahashi S, Bruce CJ, Goldman-Rakic PS. Dorsolateral prefrontal lesions and oculomotor-delayed-response performance: evidence for mnemonic “scotomas”. J. Neurosci. 1993;13:1479–1497. doi: 10.1523/JNEUROSCI.13-04-01479.1993. - DOI - PMC - PubMed

Publication types