Clinical Trial
. 2018 Aug 29;9(1):3511.
doi: 10.1038/s41467-018-05918-7.

Revisiting the functional significance of binocular cues for perceiving motion-in-depth

Affiliations
Clinical Trial

Revisiting the functional significance of binocular cues for perceiving motion-in-depth

Peter J Kohler et al. Nat Commun. .

Abstract

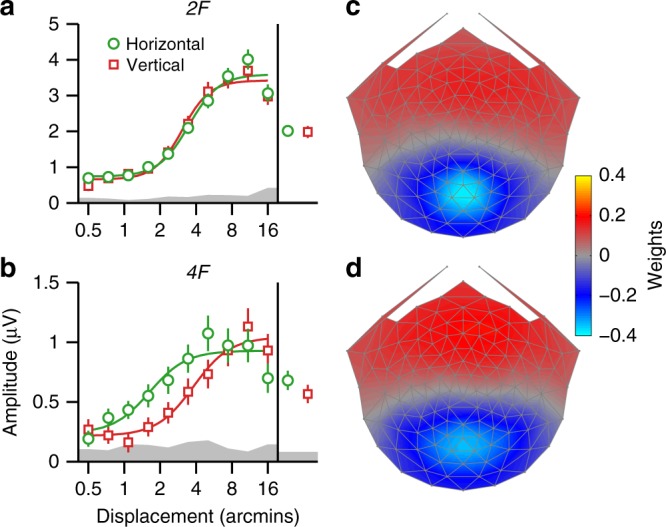
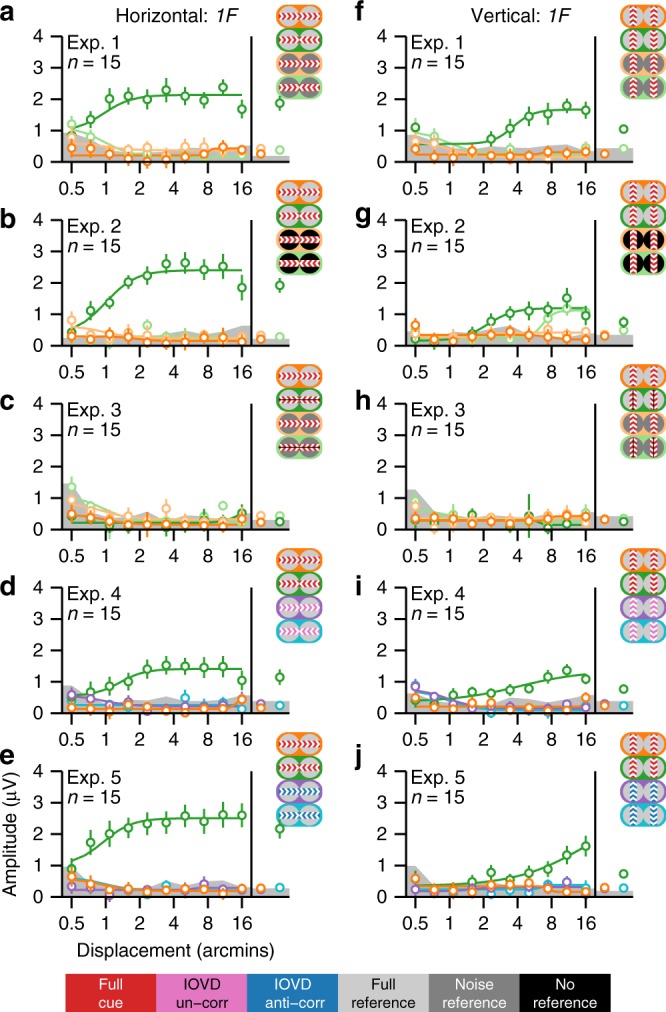
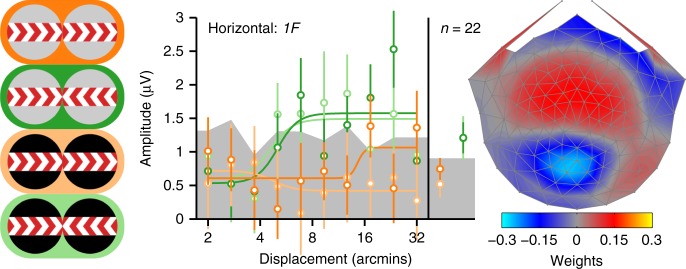
Binocular differencing of spatial cues required for perceiving depth relationships is associated with decreased sensitivity to the corresponding retinal image displacements. However, binocular summation of contrast signals increases sensitivity. Here, we investigated this divergence in sensitivity by making direct neural measurements of responses to suprathreshold motion in human adults and 5-month-old infants using steady-state visually evoked potentials. Interocular differences in retinal image motion generated suppressed response functions and correspondingly elevated perceptual thresholds compared to motion matched between the two eyes. This suppression was of equal strength for horizontal and vertical motion and therefore not specific to the perception of motion-in-depth. Suppression is strongly dependent on the presence of spatial references in the image and highly immature in infants. Suppression appears to be the manifestation of a succession of spatial and interocular opponency operations that occur at an intermediate processing stage either before or in parallel with the extraction of motion-in-depth.


Conflict of interest statement

The authors declare no competing interests.

Figures

Fig. 1
Fig. 1
Schematic of the stimulus configurations. The displays were random-dot kinematograms with alternating test and reference bands (20 of each in the actual display, 5 shown here). Dots in test bands moved coherently either in-phase between the two eyes (a, b) or in anti-phase (c, d). In the reference bands, dots were either static, uncorrelated between the eyes, or removed completely, depending on the experiment and condition (see Fig. 2). Here we show FOUR conditions, each with static reference dots and each represented with an icon depicting the moving test bands as a central band with flanking reference bands. An illustration of the corresponding percept is shown next to each icon: Both horizontal (a) and vertical (b) in-phase motion gives rise to movement in the plane, while horizontal anti-phase motion means that the display will alternate between 0 and crossed horizontal disparity, giving rise to movement in depth (c). Vertical anti-phase motion alternates between 0 and left-hypo disparity, and does not give rise to movement in depth. The endpoints of the monocular apparent motion trajectories can be manipulated such that the horizontal motion will generate a display that alternates between equal and opposite values of crossed and uncrossed disparity, still giving rise to movement in depth (d). The vertical equivalent of this display alternated between left-hyper and left-hypo disparity, not giving rise to movement in depth. In addition to these schematics, videos of the actual displays are included as Supplementary Movies 1–4
Fig. 2
Fig. 2
Adult second harmonic SSVEP response functions. ae Displacement response functions for the horizontal direction of motion and fj the vertical direction of motion. Averages across all displacements are shown on the right side of the response functions. Data are from the first reliable component from an RC analysis derived from 2F data from all conditions, separately for each experiment. Scalp topographies for this component were quite similar across experiments (see Supplementary Fig. 2). Each experiment had eight conditions, of which half were horizontal and the rest were vertical. The conditions are represented with icons, consistent with those used in Fig. 1. The central colors indicate the interocular correlation of the test bands, which could be either 100% (full-cue; red), 0% (IOVD-uncorrelated; magenta), or −100% (IOVD anti-correlated; blue). The flanking colors indicate the state of the reference bands, which either contained static dots that were 100% correlated between eyes (full-reference; light gray), temporally and interocularly uncorrelated dots (noise-reference; dark gray), or no dots (no-reference; black). The meaning of each color is shown in the legend in the bottom of the figure. Smooth curves are Naka–Rushton function fits to the data. The gray bands at the bottom of the plots indicate the background EEG noise level, with the top of the band indicating the average noise level across two neighboring side bands, averaged across conditions. Error bars plot ±1 standard error of the mean (SEM)
Fig. 3
Fig. 3
Adult second harmonic SSVEP response functions and psychophysical detection thresholds. a, b SSVEP data from horizontal and vertical full-cue/full-reference (n = 15). In-phase conditions are plotted in orange and anti-phase conditions in green. We ran both descending and ascending displacement sweeps; response functions are averages over ascending and flipped versions of descending trials. As in Fig. 2, averages across all displacements are shown on the right side of the response functions, gray bands represent the average background EEG noise, and smooth curves are Naka–Rushton fits to the data. Responses were weaker for anti-phase compared to in-phase for both horizontal and vertical motion. c Psychophysical thresholds for in-phase (orange) and anti-phase (green) conditions for horizontal and vertical directions of motion, plotted on a log scale, and again averaged over ascending and descending sweeps. Individual participant thresholds are plotted as circles overlaid on the bars. Thresholds were higher for anti-phase compared to in-phase motion. d, e SSVEP data for no-reference conditions (n = 15). Note that a larger range of displacements was used for the no-reference conditions and that the response functions depart from the noise level at higher displacements than in the full-reference conditions. Unlike the referenced conditions, responses are weaker for in-phase compared to anti-phase. f Psychophysical thresholds for the no-reference condition. Overall psychophysical thresholds are higher by a factor of ~4.7 than for the full-reference conditions and thresholds are higher for anti-phase than in-phase motion for both orientations. Error bars are on the SSVEP data are ±1 SEM
Fig. 4
Fig. 4
Infant second harmonic SSVEP response functions. Averages across all displacements are shown on the right side of the response functions. As for the adult analyses, data are from the first reliable component from an RC analysis derived from 2F data from all conditions. The scalp topography for this component is shown on the right, with the color scale indicating the component weights. The conditions are represented with the icons on the left, with the same color convention as in Fig. 2. Smooth curves are fits from a Naka–Rushton function. Error bars are ±1 SEM, and the gray band indicates the average EEG noise level
Fig. 5
Fig. 5
Candidate MID signal from IOVD. Response functions for horizontal (green) and vertical (red) full-cue/full-reference anti-phase motion conditions, averaged across Experiments 1, 2, 3, and 4. Averages across all displacements are shown on the right side of the response functions. The response functions are from the first reliable component of RCA done separately on 2F (a) and 4F (b) data, with the topographies shown on the right (c, d). The color scale indicates the component weights. Responses do not differ for the two directions of motion at 2F, but are different at 4F at the smaller displacements. An analogous analysis done on the uncorrelated and anti-correlated anti-phase conditions from Experiments 4 and 5 produced a similar pattern of results (see Supplementary Fig. 3). Error bars are ±1 SEM, smooth curves are Naka–Rushton fits and the gray band indicates the average EEG noise level
Fig. 6
Fig. 6
Adult first harmonic SSVEP response functions. ae Displacement response functions for the horizontal direction of motion and fj the vertical direction of motion. Averages across all displacements are shown on the right side of the response functions. Data are from the first reliable component from an RC analysis derived from 1F data from all conditions, separately for each experiment. Scalp topographies for this component are shown in Supplementary Fig. 2. Each experiment had eight conditions, of which half were horizontal and the rest were vertical. The conditions are represented with icons, with the same color convention as in Fig. 2 and the color meanings shown in the legend in the bottom of the figure. Smooth curves are Naka–Rushton function fits to the data and gray bands at the bottom of the plots indicate the average background EEG noise level. Error bars plot ±1 standard error of the mean (SEM). As expected, Experiment 3 produced no reliable 1F response for any condition, see text for additional details
Fig. 7
Fig. 7
Infant first harmonic SSVEP response functions. Averages across all displacements are shown on the right side of the response functions. Unlike previous plots, data are plotted for the fifth reliable component because its topography was most similar to the topography of the adults. The scalp topography for this component is shown on the right, with the color scale indicating the component weights. The conditions are represented with the icons on the left, with the same color convention as in previous figures. Smooth curves are fits from a Naka–Rushton function. Error bars are ±1 SEM, and the gray band indicates the average EEG noise level

Similar articles

Cited by

References

    1. Hubel DH, Wiesel TN. Receptive fields and functional architecture of monkey striate cortex. J. Physiol. 1968;195:215–243. doi: 10.1113/jphysiol.1968.sp008455. - DOI - PMC - PubMed
    1. Schiller PH, Finlay BL, Volman SF. Quantitative studies of single-cell properties in monkey striate cortex. I. Spatiotemporal organization of receptive fields. J. Neurophysiol. 1976;39:1288–1319. doi: 10.1152/jn.1976.39.6.1288. - DOI - PubMed
    1. Mikami A, Newsome WT, Wurtz RH. Motion selectivity in macaque visual cortex. II. Spatiotemporal range of directional interactions in MT and V1. J. Neurophysiol. 1986;55:1328–1339. doi: 10.1152/jn.1986.55.6.1328. - DOI - PubMed
    1. Maunsell JH, Essen DCV. Functional properties of neurons in middle temporal visual area of the macaque monkey. I. Selectivity for stimulus direction, speed, and orientation. J. Neurophysiol. 1983;49:1127–1147. doi: 10.1152/jn.1983.49.5.1127. - DOI - PubMed
    1. Allman J, Miezin F, McGuinness E. Direction- and velocity-specific responses from beyond the classical receptive field in the middle temporal visual area (MT) Perception. 1985;14:105–126. doi: 10.1068/p140105. - DOI - PubMed

Publication types

LinkOut - more resources