Multicenter Study
. 2018 Aug 29;8(1):13047.
doi: 10.1038/s41598-018-31509-z.

Comprehensive Investigation on Controlling for CT Imaging Variabilities in Radiomics Studies

Affiliations
Multicenter Study

Comprehensive Investigation on Controlling for CT Imaging Variabilities in Radiomics Studies

Rachel B Ger et al. Sci Rep. .

Abstract

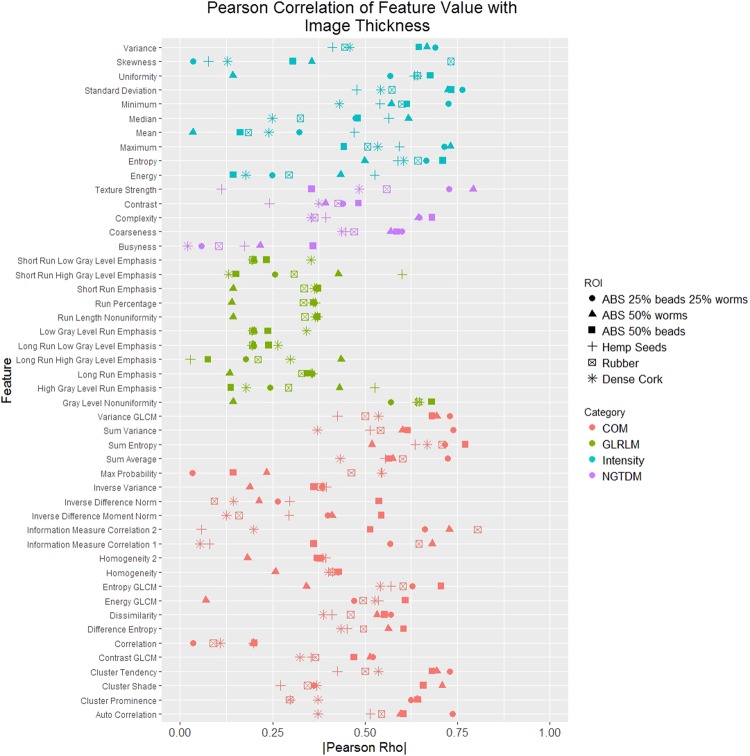
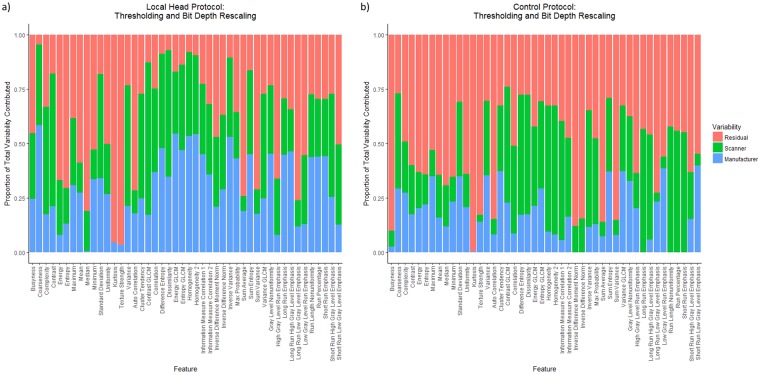
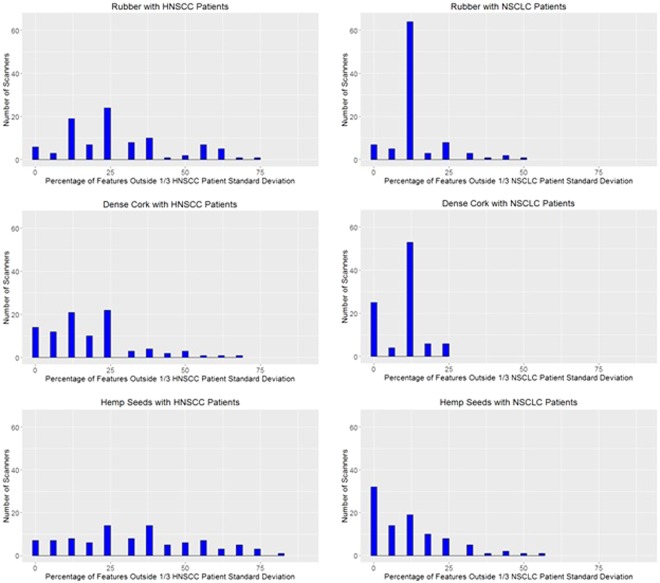
Radiomics has shown promise in improving models for predicting patient outcomes. However, to maximize the information gain of the radiomics features, especially in larger patient cohorts, the variability in radiomics features owing to differences between scanners and scanning protocols must be accounted for. To this aim, the imaging variability of radiomics feature values was evaluated on 100 computed tomography scanners at 35 clinics by imaging a radiomics phantom using a controlled protocol and the commonly used chest and head protocols of the local clinic. We used a linear mixed-effects model to determine the degree to which the manufacturer and individual scanners contribute to the overall variability. Using a controlled protocol reduced the overall variability by 57% and 52% compared to the local chest and head protocols respectively. The controlled protocol also reduced the relative contribution of the manufacturer to the total variability. For almost all variabilities (manufacturer, scanner, and residual with different preprocesssing), the controlled protocol scans had a significantly smaller variability than the local protocol scans did. For most radiomics features, the imaging variability was small relative to the inter-patient feature variability in non-small cell lung cancer and head and neck squamous cell carcinoma patient cohorts. From this study, we conclude that using controlled scans can reduce the variability in radiomics features, and our results demonstrate the importance of using controlled protocols in prospective radiomics studies.


Conflict of interest statement

The authors declare no competing interests.

Figures

Figure 1
Figure 1
Axial views from a computed tomography scan of the radiomics phantom used. The cartridges are (a) 50% acrylonitrile butadiene styrene (ABS), 25% acrylic beads, and 25% polyvinyl chloride (PVC) pieces (percentages are by weight), (b) 50% ABS and 50% PVC pieces, (c) 50% ABS and 50% acrylic beads, (d) hemp seeds in polyurethane, (e) shredded rubber, and (f) dense cork. The high-density polystyrene buildup is seen outside the cartridges with dimensions of 28 cm × 21 cm × 22 cm. The cartridges had a diameter of 10.8 cm. Window width: 1600, window level: −300.
Figure 2
Figure 2
Histograms of image thicknesses across the scans taken using (a) the local chest protocol and (b) the local head protocol.
Figure 3
Figure 3
Absolute value of the Pearson correlation rho for the correlation between feature value and image thickness for each region of interest (ROI). Each ROI is a different shape. Each category of feature is a different color. The correlation varies between and within features depending on the ROI. COM: gray level co-occurrence matrix, GLCM: gray level co-occurrence (used when there are features with the same name in different categories to differentiate them), GLRLM: gray level run length matrix, NGTDM: neighborhood gray tone difference matrix, beads: acrylic beads, worms: polyvinyl chloride pieces.
Figure 4
Figure 4
Bar plots of the relative contributions of the scanner-wise variability (green), manufacturer-wise variability (blue), and residual variability (red) for each feature using thresholding and bit depth rescaling calculated on (a) the local head protocol and (b) the controlled protocol. The contribution of the manufacturer was much larger for many features in the local head protocol than in the controlled protocol. The total variability for the controlled protocol compared with that of the head protocol was 0.48.
Figure 5
Figure 5
The percentages of features outside 1/3 of the scaled patient standard deviation for rubber, dense cork, and hemp seeds in the head and neck squamous cell carcinoma (HNSCC) patient cohort and the non-small cell lung cancer (NSCLC) patient cohort using the features correlated with patient survival in previous studies without non-robust features. More scanners had fewer features outside 1/3 of the patient standard deviation in the NSCLC patient cohort than the HNSCC patient cohort.

References

    1. Lambin P, et al. Radiomics: extracting more information from medical images using advanced feature analysis. European journal of cancer. 2012;48:441–446. doi: 10.1016/j.ejca.2011.11.036. - DOI - PMC - PubMed
    1. Fried DV, et al. Prognostic value and reproducibility of pretreatment CT texture features in stage III non-small cell lung cancer. International journal of radiation oncology, biology, physics. 2014;90:834–842. doi: 10.1016/j.ijrobp.2014.07.020. - DOI - PMC - PubMed
    1. Fave X, et al. Delta-radiomics features for the prediction of patient outcomes in non-small cell lung cancer. Scientific reports. 2017;7:588. doi: 10.1038/s41598-017-00665-z. - DOI - PMC - PubMed
    1. Hunter LA, et al. NSCLC tumor shrinkage prediction using quantitative image features. Computerized medical imaging and graphics: the official journal of the Computerized Medical Imaging Society. 2016;49:29–36. doi: 10.1016/j.compmedimag.2015.11.004. - DOI - PubMed
    1. Parmar C, et al. Radiomic feature clusters and prognostic signatures specific for Lung and Head & Neck cancer. Scientific reports. 2015;5:11044. doi: 10.1038/srep11044. - DOI - PMC - PubMed

Publication types

MeSH terms