. 2018 Aug 29;9(1):3503.
doi: 10.1038/s41467-018-05992-x.

EMT- and stroma-related gene expression and resistance to PD-1 blockade in urothelial cancer

Affiliations

EMT- and stroma-related gene expression and resistance to PD-1 blockade in urothelial cancer

Li Wang et al. Nat Commun. .

Abstract

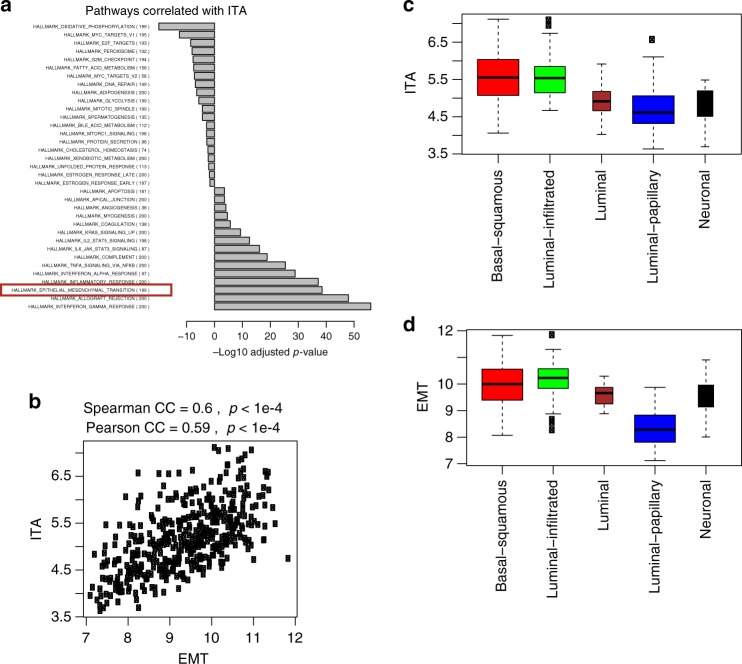
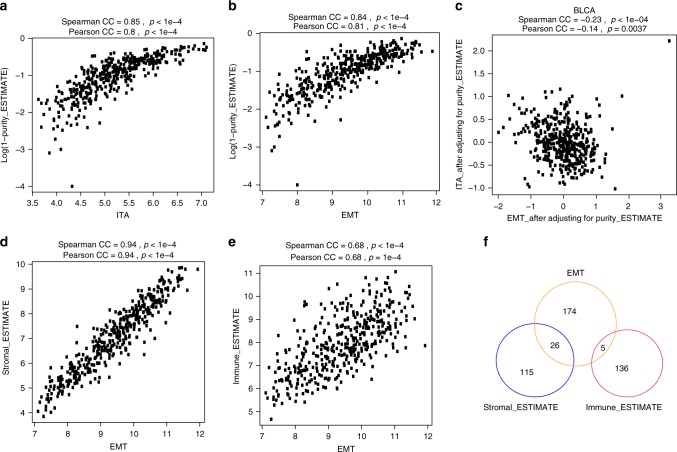
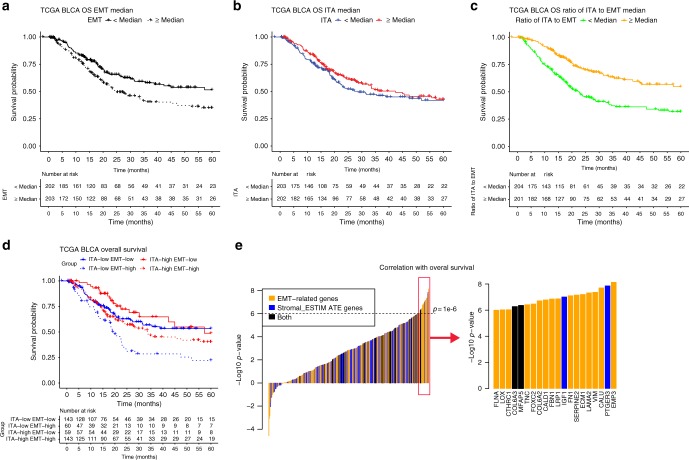
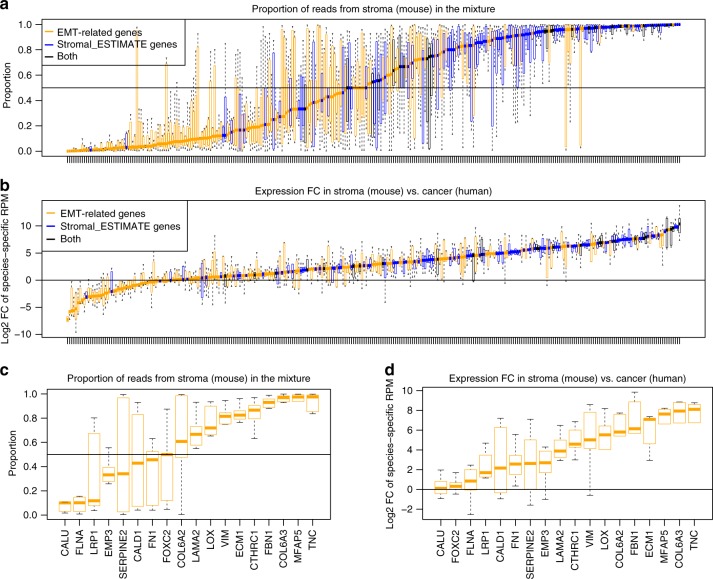
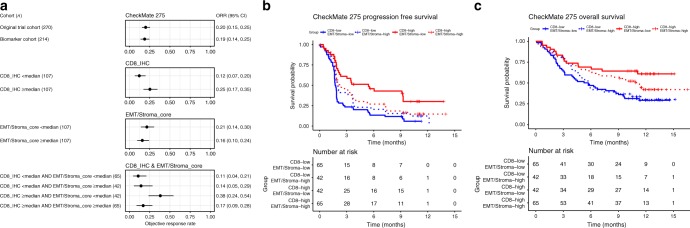
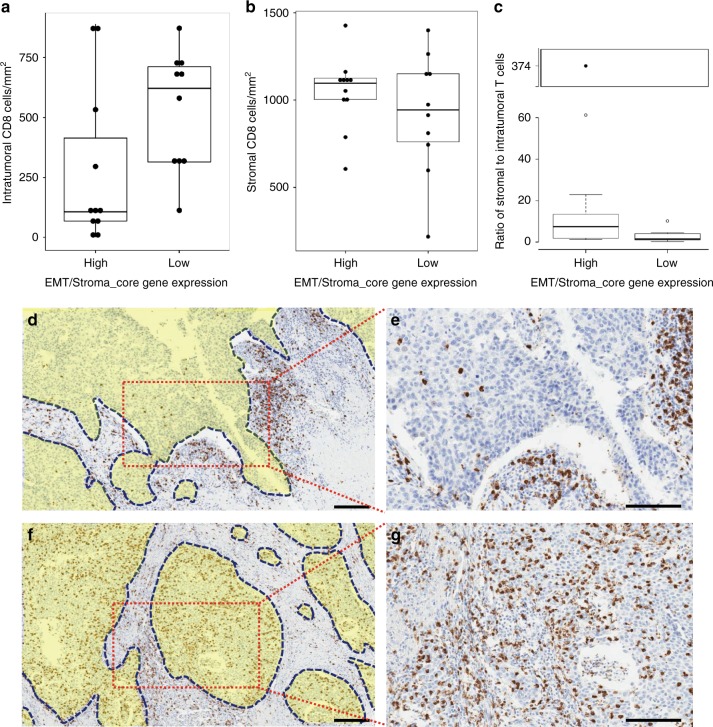
Cancers infiltrated with T-cells are associated with a higher likelihood of response to PD-1/PD-L1 blockade. Counterintuitively, a correlation between epithelial-mesenchymal transition (EMT)-related gene expression and T-cell infiltration has been observed across tumor types. Here we demonstrate, using The Cancer Genome Atlas (TCGA) urothelial cancer dataset, that although a gene expression-based measure of infiltrating T-cell abundance and EMT-related gene expression are positively correlated, these signatures convey disparate prognostic information. We further demonstrate that non-hematopoietic stromal cells are a major source of EMT-related gene expression in bulk urothelial cancer transcriptomes. Finally, using a cohort of patients with metastatic urothelial cancer treated with a PD-1 inhibitor, nivolumab, we demonstrate that in patients with T-cell infiltrated tumors, higher EMT/stroma-related gene expression is associated with lower response rates and shorter progression-free and overall survival. Together, our findings suggest a stroma-mediated source of immune resistance in urothelial cancer and provide rationale for co-targeting PD-1 and stromal elements.


Conflict of interest statement

M.D.G. has served as a consultant and has received research funding from Bristol-Myers Squibb. A.S., P.M.S., S.D.C., and A.A. are employees of Bristol-Myers Squibb. The remaining authors declare no competing interests.

Figures

Fig. 1
Fig. 1
T-cell related gene expression is enriched in a subset of UC specimens. a Expression profiles of 144 T-cell marker genes across 22 different types or states of immune cells; b Expression profiles of the same 144 genes (the same order as in a) across 408 UC tumor samples in TCGA
Fig. 2
Fig. 2
T-cell related gene expression and EMT-related gene expression are positively correlated in UC specimens. a Pathways ranked by their correlation with ITA. Pearson’s correlation coefficient (CC) with ITA was calculated for each individual gene in TCGA UC datasets. Wilcoxon rank sum test was then used to compare CC values in each pathway with all the other genes. X-axis shows the –log10 p-value of the Wilcoxon test for each pathway (pathways that were negatively correlated with ITA were given log10 p-value instead); b Plot of the correlation between ITA and EMT in TCGA UC samples; c Plot EMT-related gene expression for different molecular subtypes of UC in TCGA; d Plot EMT-related gene expression for different molecular subtypes of UC in TCGA. For boxplots, boxes extend from the first to third quartiles, middle line shows median, whiskers extend to the most extreme data point which is no more than 1.5 times the interquartile range from the box, open circles show individual values that are more than 1.5 times the interquartile range from the box
Fig. 3
Fig. 3
EMT-related gene expression is inversely correlated with tumor purity in UC specimens and likely emanates from stroma. Plot of correlation between a tumor purity and ITA, b tumor purity and EMT-related genes, c tumor purity adjusted ITA and EMT, d EMT-related genes and stromal signature (average of stromal_ESTIMATE gene expression), and e EMT-related genes and average of immune_ESTIMATE gene expression in TCGA UC samples; f Overlap among EMT-related, stromal_ESTIMATE and immune_ESTIMATE gene sets
Fig. 4
Fig. 4
EMT-related gene expression and T-cell related gene expression confer disparate prognostic information in patients with muscle-invasive UC of the bladder treated with cystectomy. Kaplan–Meier survival curves for UC patients in TCGA (n = 405) divided into two groups by the a EMT-related gene expression, b ITA gene expression, c the ratio of ITA to EMT, or d divided into four groups by both EMT-related and ITA gene expression. Median EMT and ITA values were used to distinguish low vs. high expression. e Individual EMT-related and stromal_ESTIMATE genes were ranked according to the significance of their association with survival. Y-axis shows the −log10 p-value by the Wald test for each individual gene in the bivariate cox-regression model where ITA was included (those associated with worse survival were assigned log10 p-value instead)
Fig. 5
Fig. 5
EMT-related gene expression emanates predominantly from a stromal source in UC PDX models. a Fraction of reads mapped to mouse for each EMT-related and stromal signal gene; b Fold change of the species-specific RPM value between human and mouse for each EMT-related and stromal signal gene; c Fraction of reads mapped to mouse for the top 18 EMT genes correlated with survival (EMT/Stroma_core genes); d Fold change of the species-specific RPM value between human and mouse for the top 18 EMT-related genes (EMT/Stroma_core genes) correlated with survival. For boxplots, boxes extend from the first to third quartiles, middle line shows median, whiskers extend to the most extreme data point which is no more than 1.5 times the interquartile range from the box, open circles show individual values that are more than 1.5 times the interquartile range from the box
Fig. 6
Fig. 6
Higher EMT/Stroma-related gene expression is associated with an attenuated response to PD-1 blockade in T-cell infiltrated UC. a Objective response rate estimates with the PD-1 inhibitor, nivolumab, in the CheckMate 275 biomarker cohort, by CD8 and EMT/Stroma_core subgroup (n = 214). Subgroups are defined by biomarker score ≥ or < the median score. Plotting symbols show objective response rate point estimates; error bars show 95% confidence intervals for objective response rate. Kaplan–Meier estimates of b PFS and c OS curves in patients in the CheckMate 275 biomarker cohort, stratified according to the four biomarker subgroups
Fig. 7
Fig. 7
T-cells in UC specimens with higher EMT/Stroma-related gene expression are more frequently localized to the peritumoral stroma. Boxplots of the density of a intratumoral or b peritumoral-stroma CD8 cells in specimens (n = 21), by EMT/Stroma_core gene expression category (≥ or < median level); c Ratio of peritumoral stroma CD8 cells to intratumoral CD8 cells; d, e Representative tumor specimen with low intratumoral CD8 cells and high peritumoral stromal CD8 infiltrates, and f, g with high total and intratumoral CD8 cells. Yellow-shaded zones in images d and f identify tumor areas, whereas the rest represent adjacent stroma. Scale bars correspond to 200 μm. In boxplots, boxes extend from the first to third quartiles, middle line shows median, whiskers extend up to 1.5 times the interquartile range from the top and bottom of the box to the furthest data within that distance. Data beyond the end of the whiskers are “outlying” points. In a and b, filled circles show individual values. In c, the outlying point with extreme value is boxed with a break in the Y axis to better display the entire distribution of the data. Two lines at the end of the whiskers correspond to the maximum and minimum of the data points with the extreme outlier removed

Comment in

References

    1. Bellmunt J, et al. Pembrolizumab as second-line therapy for advanced urothelial carcinoma. N. Engl. J. Med. 2017;376:1015–1026. doi: 10.1056/NEJMoa1613683. - DOI - PMC - PubMed
    1. Sharma P, et al. Nivolumab in metastatic urothelial carcinoma after platinum therapy (CheckMate 275): a multicentre, single-arm, phase 2 trial. Lancet Oncol. 2017;18:312–322. doi: 10.1016/S1470-2045(17)30065-7. - DOI - PubMed
    1. Apolo AB, et al. Avelumab, an anti-programmed death-ligand 1 antibody, in patients with refractory metastatic urothelial carcinoma: results from a multicenter, phase Ib study. J. Clin. Oncol. 2017;35:2117–2124. doi: 10.1200/JCO.2016.71.6795. - DOI - PMC - PubMed
    1. Massard C, et al. Safety and efficacy of durvalumab (MEDI4736), an anti-programmed cell death ligand-1 immune checkpoint inhibitor, in patients with advanced urothelial bladder cancer. J. Clin. Oncol. 2016;34:3119–3125. doi: 10.1200/JCO.2016.67.9761. - DOI - PMC - PubMed
    1. Balar AV, et al. Atezolizumab as first-line treatment in cisplatin-ineligible patients with locally advanced and metastatic urothelial carcinoma: a single-arm, multicentre, phase 2 trial. Lancet. 2017;389:67–76. doi: 10.1016/S0140-6736(16)32455-2. - DOI - PMC - PubMed

Publication types

MeSH terms