. 2018 Aug 29;9(1):3506.
doi: 10.1038/s41467-018-05861-7.

Nrf2 negatively regulates STING indicating a link between antiviral sensing and metabolic reprogramming

Affiliations

Nrf2 negatively regulates STING indicating a link between antiviral sensing and metabolic reprogramming

David Olagnier et al. Nat Commun. .

Abstract

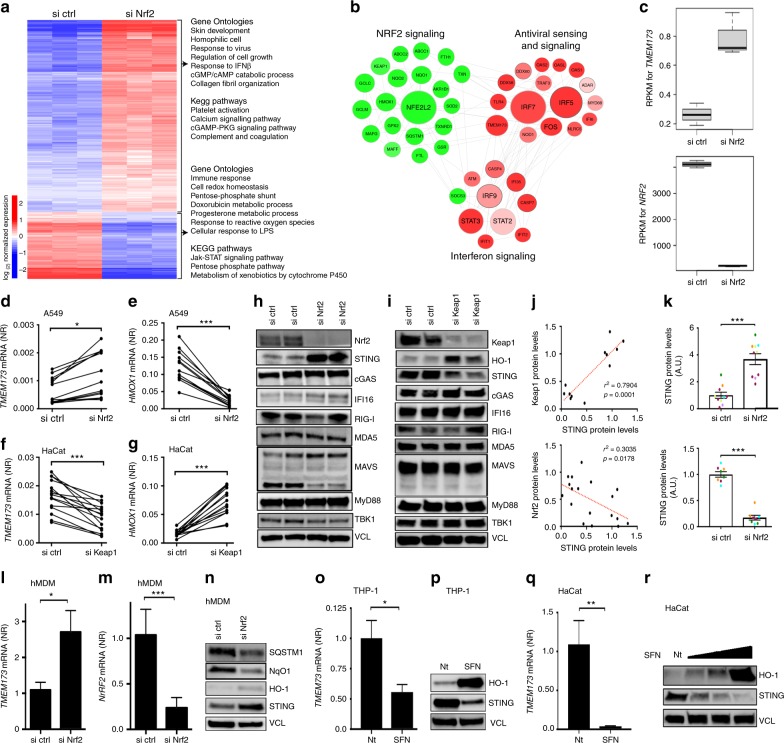
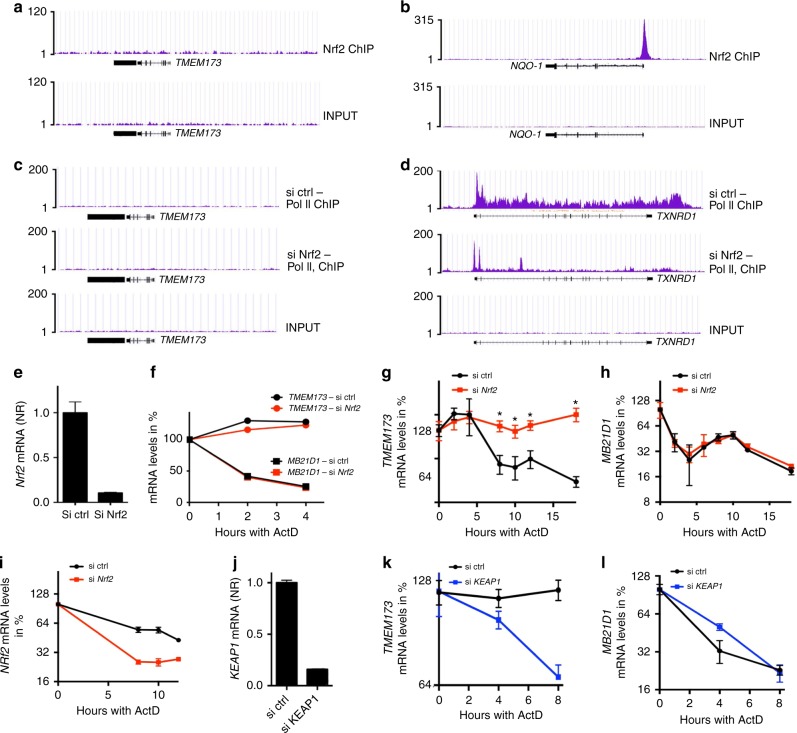
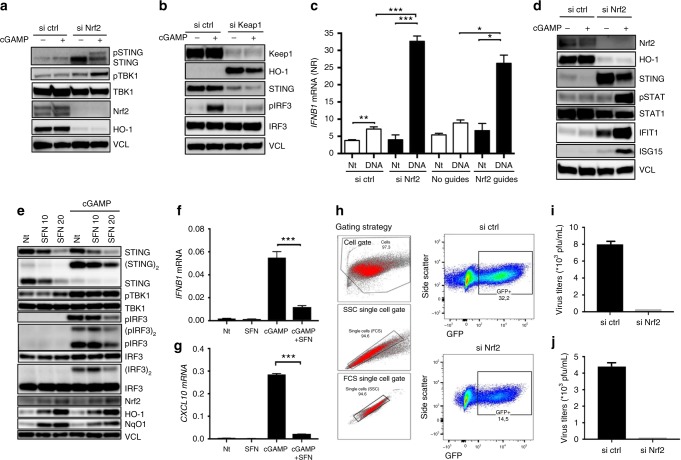
The transcription factor Nrf2 is a critical regulator of inflammatory responses. If and how Nrf2 also affects cytosolic nucleic acid sensing is currently unknown. Here we identify Nrf2 as an important negative regulator of STING and suggest a link between metabolic reprogramming and antiviral cytosolic DNA sensing in human cells. Here, Nrf2 activation decreases STING expression and responsiveness to STING agonists while increasing susceptibility to infection with DNA viruses. Mechanistically, Nrf2 regulates STING expression by decreasing STING mRNA stability. Repression of STING by Nrf2 occurs in metabolically reprogrammed cells following TLR4/7 engagement, and is inducible by a cell-permeable derivative of the TCA-cycle-derived metabolite itaconate (4-octyl-itaconate, 4-OI). Additionally, engagement of this pathway by 4-OI or the Nrf2 inducer sulforaphane is sufficient to repress STING expression and type I IFN production in cells from patients with STING-dependent interferonopathies. We propose Nrf2 inducers as a future treatment option in STING-dependent inflammatory diseases.


Conflict of interest statement

The authors declare no competing interests.

Figures

Fig. 1
Fig. 1
Nrf2 suppresses STING expression. A549 cells were transfected with control or Nrf2 siRNA for 48 h. Samples were analysed by RNAseq and differentially expressed pathways and genes that satisfied p-value <0.001 and fold change cutoff >1 or <−1 were selected. The data are from one experiment performed in triplicate. a Heat map of differentially regulated genes and a listing of representative gene ontologies and KEGG pathways associated with these genes. b Cloud analysis of differentially expressed genes. c Representation of RNA-reads for from RNAseq. Graph displays boxplots with boxes indicating mean, s.e.m. as well as min and max values. dg Cells were transfected with control, Nrf2 or Keap1 siRNA for 48 h or 72 h, respectively. TMEM173 and HMOX-1 mRNA expression levels were monitored by qPCR. Each two connected dots represent data from one biological experiment with paired samples. h, i Antiviral sensor, adaptor or accessory molecules were examined by immunoblotting. Data are representative of two independent experiments. j Correlation between Keap1 and STING protein levels in HaCat cells and Nrf2 and STING protein levels in A549 cells using Image J quantification of western blot intensities. Correlations were calculated using a Spearman's test. Each dot represents a biological sample. k Quantification of STING staining intensities in multiple western blots using Image J. Colorations indicate sample pairing. Graphs display mean and s.e.m. ln TMEM173 and NRF2 mRNA expression levels by qPCR (l, m) or western blotting (n) in human monocyte-derived macrophages treated with control siRNA or Nrf2 siRNA. Data represent means ± s.e.m. of experiments performed on two donors. or PMA-differentiated THP1 cells (o) or HaCat cells (q and r) were stimulated with l-sulforasphane (SFN) (20 μM) for 72 h. TMEM173 mRNA and STING protein levels were determined by qPCR and immunoblotting, respectively. Data are from one representative experiment which has been repeated twice. Two-tailed Student’s t-test was used to determine statistical significance
Fig. 2
Fig. 2
Nrf2 regulates STING mRNA stability. a, b A549 cells were lysed and subjected to ChIP-seq using a Nrf2 specific antibody. Graphs display fragment pileup per 1 million reads at the genomic loci proximal to TMEM173 (a) and NQO-1 (b). c, d A549 cells were treated with either control (ctrl) or Nrf2 targeted siRNA for 48 h. Cells were then lysed and subjected to ChIP-seq analysis using a Pol II-specific antibody. Graphs display fragment pileup per 1 million reads at the genomic loci surrounding TMEM173 (c) and TXNRD1 (d). ei A549 cells were treated with ctrl or Nrf2 siRNA for 48 h. Knockdown efficiency of Nrf2 was determined by qPCR (e). fi Cells were then treated with Actinomycin D (10 µg/mL) as indicated and gene expression was determined by qPCR. The graph in (f) is one representative of two independent experiments. The graphs in (g) and h contains merged data from two independent experiments with n = 5 at the 8 h timepoint and n > 2 for remaining time points. Data displayed in (i) represent one experiment with n = 3. (*) indicates statistical significance using Student’s t-test with p < 0.05. jl HaCat cells were treated with ctrl or Keap1 siRNA for 72 h. Knockdown efficiency of Keap1 was determined by qPCR (j). k, l Cells were then treated with Actinomycin D (5 µg/mL) as indicated and gene expression was determined by qPCR. Data displayed in (k) and l represent one experiment with n = 3. (*) indicates statistical significance using Student’s t-test with p < 0.05
Fig. 3
Fig. 3
Nrf2 impairs antiviral innate immunity and increases susceptibility to DNA virus infection. a, b A549 cells (a) or HaCat cells (b) were transfected with Nrf2 or Keap1 siRNA for 48 h or 72 h, respectively, and were subsequently challenged with cGAMP for 3 h (4 μg mL−1). Whole-cell extracts were analysed for STING signaling events by immunoblotting. Blots in (a) and b are representative of >6 independent experiments. c A549 cells silenced for Nrf2 using siRNA or lacking Nrf2 after CRISPR/Cas9 editing were stimulated with dsDNA (4 μg mL−1). IFNB1 mRNA levels were determined by qPCR. Data are the means ± s.e.m. of an experiment performed in triplicate. d A549 cells were transfected with control or Nrf2 siRNA for 48 h and were subsequently challenged with cGAMP for 24 h (4 μg mL−1). Whole-cell extracts were analysed for ISG expression by immunoblotting. Blot is representative of more than four independent experiments. eg PMA-differentiated THP1 cells were pre-treated with increasing doses of l-sulforaphane (SFN) for 72 h and subsequently stimulated with cGAMP (4 μg mL−1) for 3 h (f) or 6 h (f, g). Whole-cell extracts were analysed for antiviral signaling events by immunoblotting (e) and IFNβ1 and CXCL10 gene expression by qPCR (f, g). Blot in e is representative of three independent experiments. Data in (f) and g are the means ± s.e.m. of an experiment performed in triplicate. hj A549 cells were transfected with control or Nrf2 siRNA for 48 h and were subsequently infected with HSV-1-GFP (KOS strain), or HSV-2 (MS and 333 strains) at an MOI of 0.01 for 24 h. Viral infectivity was determined by flow cytometry (h) and viral replication by plaque assay (i, j). h Graphs display gating strategy (left) and GFP intensity by flow cytometry (right). i, j Graphs display mean and s.e.m. of plaques two independent experiments. Data presented in (hj) are representative of two independent experiments. Unpaired two-tailed Student’s t-test was used to determine significance of the difference between the control and each experimental condition
Fig. 4
Fig. 4
Nrf2 is a negative regulator of STING during metabolic reprogramming. a Lactate and glucose were measured in supernatants from PMDC05 cells stimulated with LPS (1 μg mL−1) or gardiquimod (4 µg ml−1) for 24 h. Data are the means and s.e.m. from one of two independent experiments performed in septuplicates. b, c Itaconate was measured in the cell medium and in the cell pellets of LPS-stimulated PMDC05 by LC/MS. Data are the means and s.e.m. from one of two independent. d PMDC05 stimulated with LPS (200 ng mL−1) or gardiquimod (400 ng ml−1) for 24 h were lysed and analysed for HIF1α, IFIT1, and Vinculin (VCL) as loading control. e PMDC05 cells were stimulated with gardiquimod (4 μg mL−1), LPS (1 μg mL−1), CpG (4 μg mL−1), cGAMP (4 μg mL−1), or Poly (I:C) (4 μg mL−1) for 24, 48, or 72 h. Whole-cell extracts were analysed by immunoblotting. f TMEM173 mRNA was assessed by qPCR in PMDC05 stimulated with indicated agonists for 48 h. Data are the means ± s.e.m. of one experiment performed in triplicate. g PMDC05 cells were pre-treated with the Nrf2 inhibitor ML385 (20 µM) before stimulation with LPS (1 μg mL−1) or gardiquimod (4 μg mL−1) for 72 h. Cells were then lysed and lysates were analysed by western blotting. h PMDC05 cells were pre-stimulated with gardiquimod (4 μg mL−1) or LPS (1 μg mL−1) for 72 h before challenge with cGAMP (4 μg mL−1) for 24 h. Type I IFN release was assessed using a HEK-Blue assay. Data are the means ± s.e.m. of one representative experiment performed in triplicate. i Graphical display of how 4-OI might possibly activate Nrf2. j HEK293T cells were treated with increasing doses of 4-OI (30–250 μM) for 18 h. ARE-promoter activity was assessed by luciferase assay. Data are means ± s.e.m. of two independent experiments in triplicate. k THP1 cells were treated with SFN (20 μM) or 4-OI (125 μM) for 48 h and mRNA levels were determined by qPCR. l THP1 cells were pre-treated with increasing does of 4-OI (62.5–125 μM) for 72 h and challenged with cGAMP (4 μg mL−1). Whole-cell lysates were then blotted as indicated. Data are from one representative experiment that has been repeated twice. mn THP1 cells were pre-treated with 4-OI (125 μM) for 72 h before challenge of 24 h with cGAMP (4 μg mL−1). Supernatants were assessed for type I IFN by HEK-Blue cell assay (m) and whole-cell lysates by immunoblotting (n). o, p HaCat and A549 cells were treated with Nrf2 siRNA for 72 h and for 48 h, respectively, before treatment with 4-OI (125 μM) for 48 h. Whole-cell lysates were used for immunoblotting. qs mRNA levels (q, r) and protein levels (s) were assessed by qPCR and immunoblotting in hMDMs silenced for Nrf2 by siRNA. Data are from two donors. Unpaired two-tailed Student’s t-test was used to determine significance
Fig. 5
Fig. 5
Activation of Nrf2 suppresses STING-dependent type IFN response in fibroblasts from SAVI patients. a, b HEK293T were transiently transfected with human WT and SAVI-STING plasmids (V174L, N152S, or V155M) (500 ng/mL). Cells were treated 1 h prior transfection with SFN (10 μM) or 4-octyl-itaconate (4-OI) (200 μM). TMEM173 mRNA levels were assessed by qPCR. Data are the means ± s.e.m. of one experiment performed in quadruplicate. c, d HEK293T were transiently transfected with human WT and SAVI-STING plasmids (V174L, N152S, or V155M) (500 ng/mL), together with an ISRE-Luciferase reporter. Cells were treated 1 h prior transfection of the plasmids with SFN (10 μM) or 4-octyl-itaconate (4-OI) (200 μM). Luciferase activity was assessed 24 h after transfection. Data are the means ± s.e.m. of one experiment performed in duplicate (c) and triplicate (d). e, f Whole-cell lysates from (c) and (d) were analysed by immunoblotting for antiviral signaling with Vinculin (VCL) as loading control. gi Fibroblasts from SAVI patients were pre-treated with increasing doses of l-sulforaphane (SFN) (10 and 20 μM) for 72 h before getting challenged with cGAMP (4 µg/mL). Whole-cell lysates were analysed for late antiviral signaling events by immunoblotting after 24 h of stimulation. Data are from three individual patients. j Supernatants from (gi) were collected after 24 h of cGAMP treatment and analysed for type I IFN production. Data are from three individual patients and bars indicated mean and SEM. km Immortalized fibroblasts from SAVI patients were pre-treated with 4-OI (200 μM) for 48 h before treating with cGAMP. After 24 h of stimulation cells were collected for western blotting (km), and type I IFN analysis by bioassay (n). Data display results from three individual SAVI patients

References

    1. Sykiotis GP, Bohmann D. Stress-activated cap’n’collar transcription factors in aging and human disease. Sci. Signal. 2010;3:re3. doi: 10.1126/scisignal.3112re3. - DOI - PMC - PubMed
    1. Hayes JD, Dinkova-Kostova AT. The Nrf2 regulatory network provides an interface between redox and intermediary metabolism. Trends Biochem. Sci. 2014;39:199–218. doi: 10.1016/j.tibs.2014.02.002. - DOI - PubMed
    1. Soares MP, Ribeiro AM. Nrf2 as a master regulator of tissue damage control and disease tolerance to infection. Biochem. Soc. Trans. 2015;43:663–668. doi: 10.1042/BST20150054. - DOI - PMC - PubMed
    1. Thimmulappa RK, et al. Nrf2 is a critical regulator of the innate immune response and survival during experimental sepsis. J. Clin. Invest. 2006;116:984–995. doi: 10.1172/JCI25790. - DOI - PMC - PubMed
    1. Thimmulappa RK, et al. Nrf2-dependent protection from LPS induced inflammatory response and mortality by CDDO-Imidazolide. Biochem. Biophys. Res. Commun. 2006;351:883–889. doi: 10.1016/j.bbrc.2006.10.102. - DOI - PMC - PubMed

Publication types