. 2018 Sep;561(7722):268-272.
doi: 10.1038/s41586-018-0462-y. Epub 2018 Aug 29.

Cotranslational assembly of protein complexes in eukaryotes revealed by ribosome profiling

Affiliations

Cotranslational assembly of protein complexes in eukaryotes revealed by ribosome profiling

Ayala Shiber et al. Nature. 2018 Sep.

Abstract

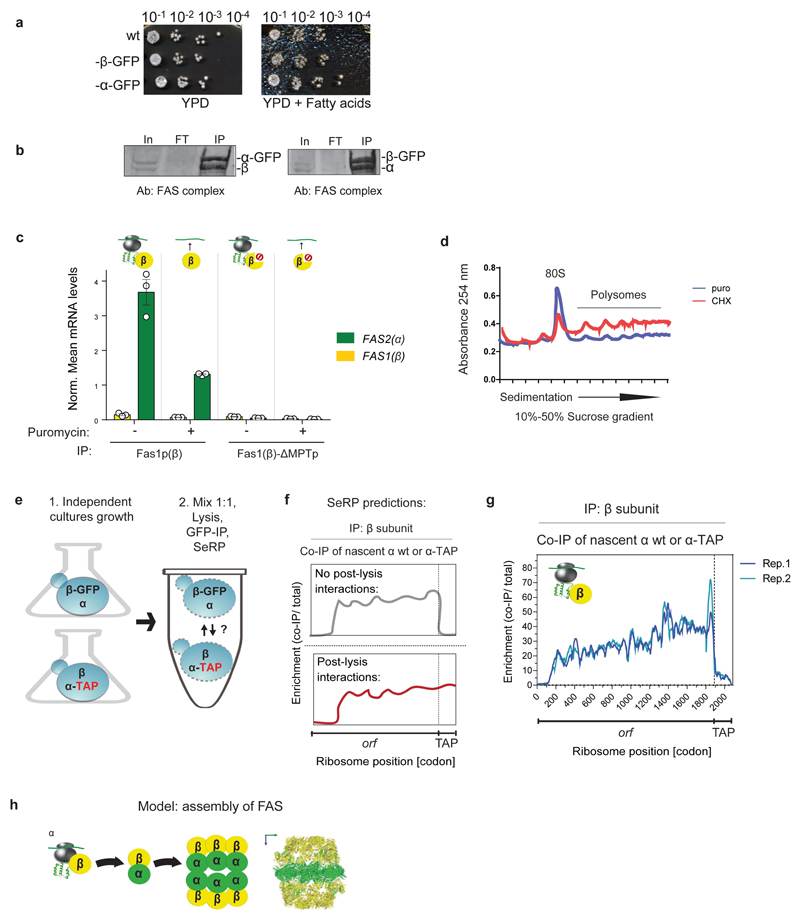
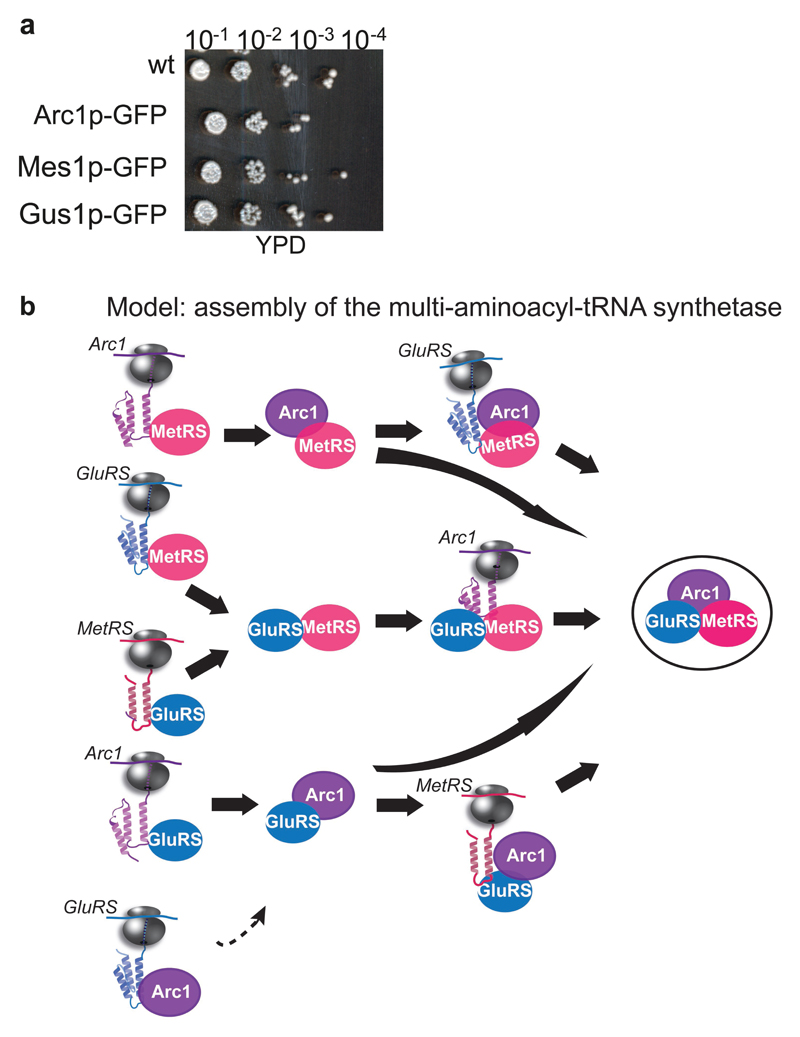
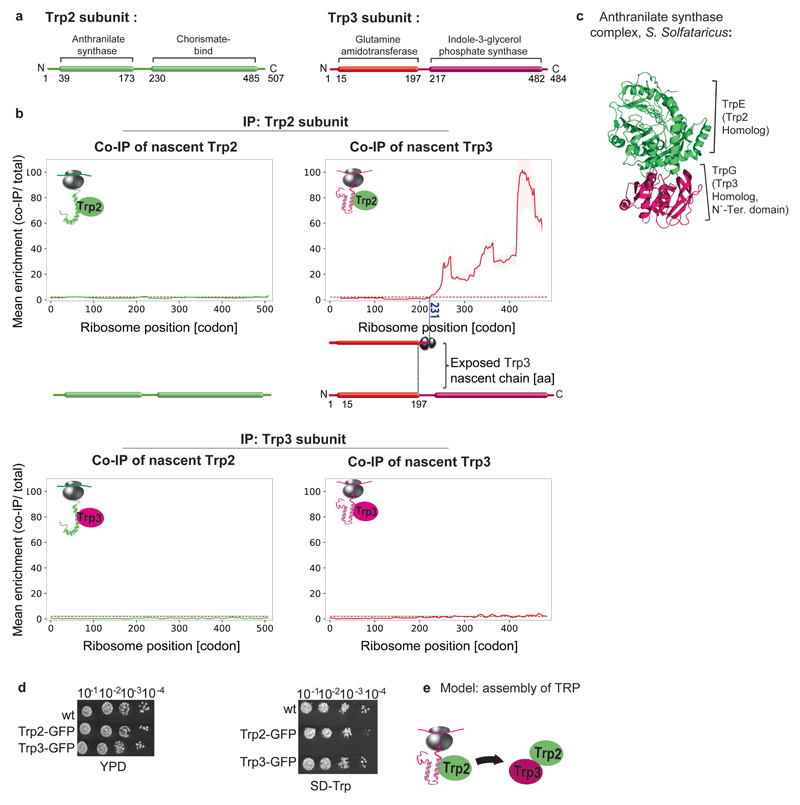
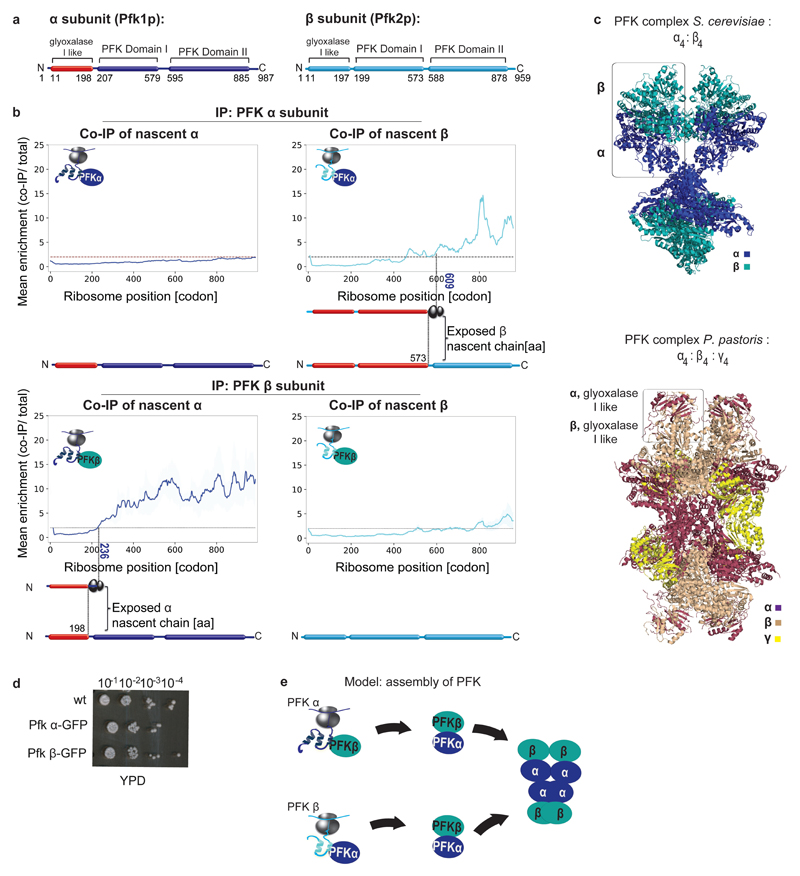
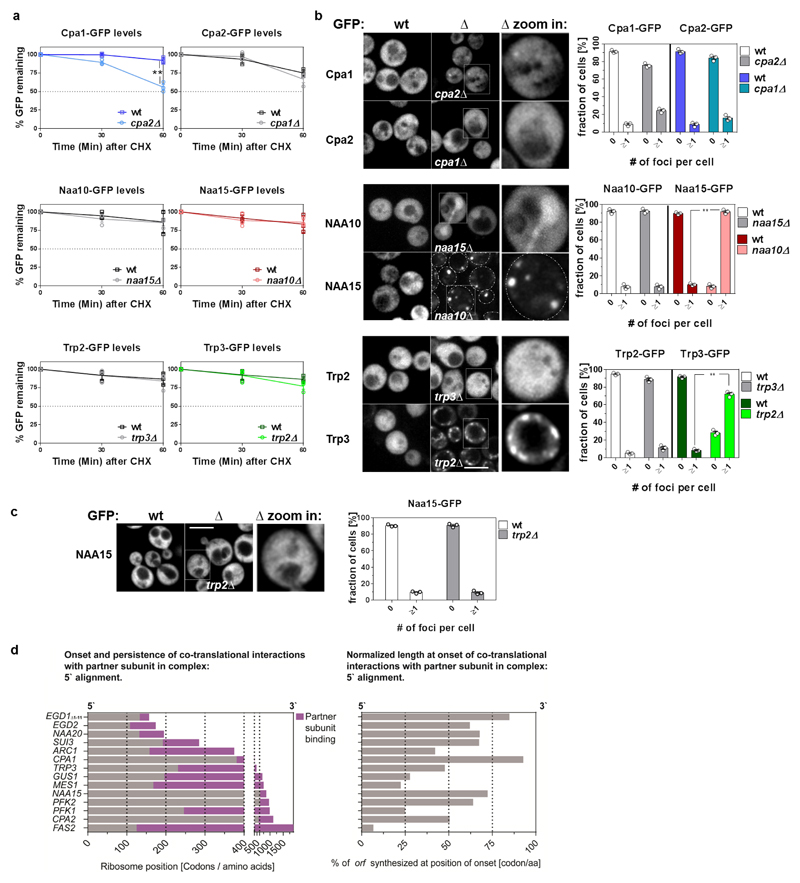
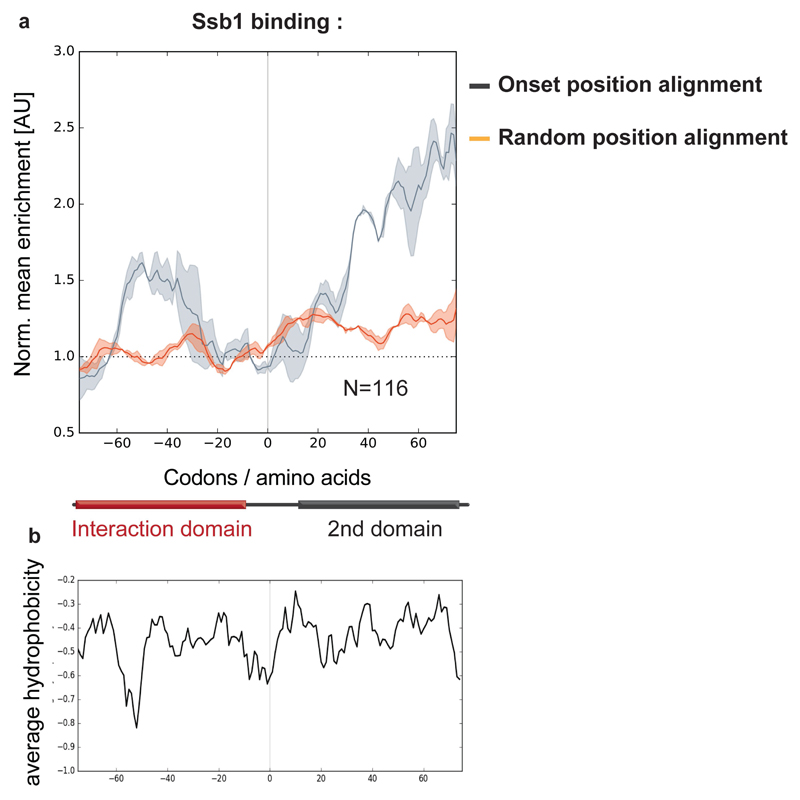
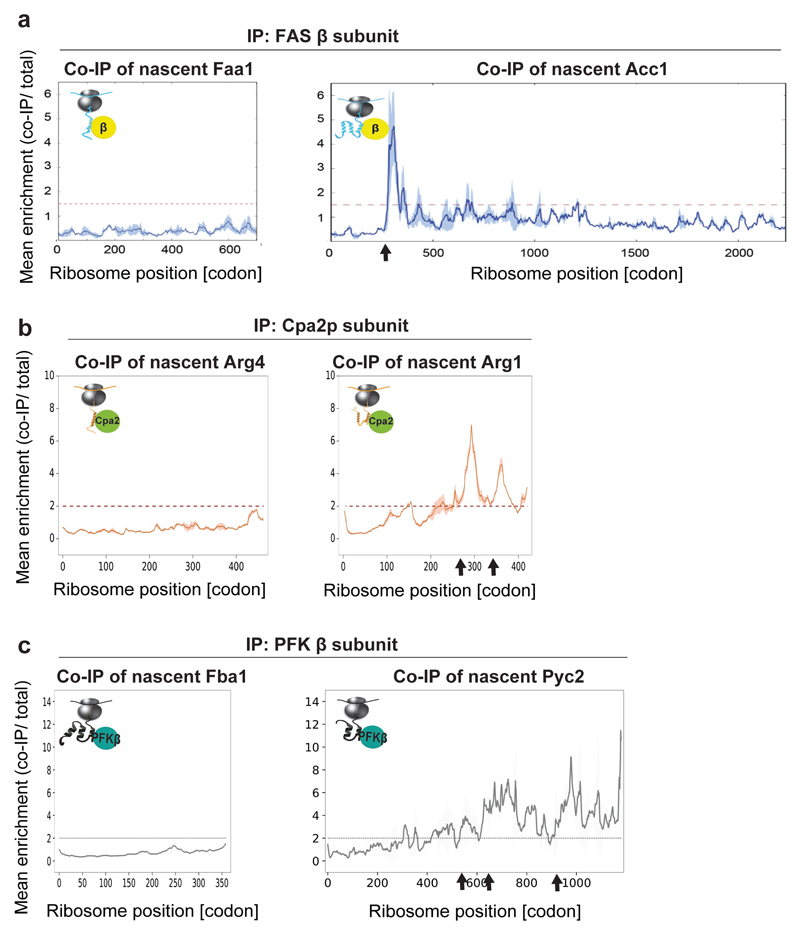
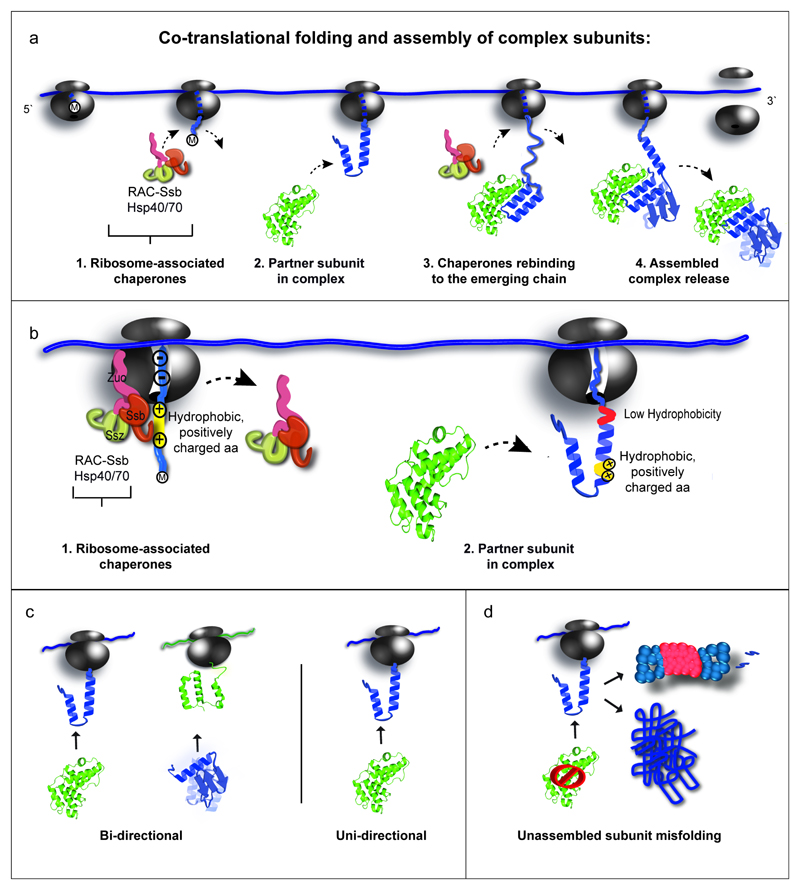
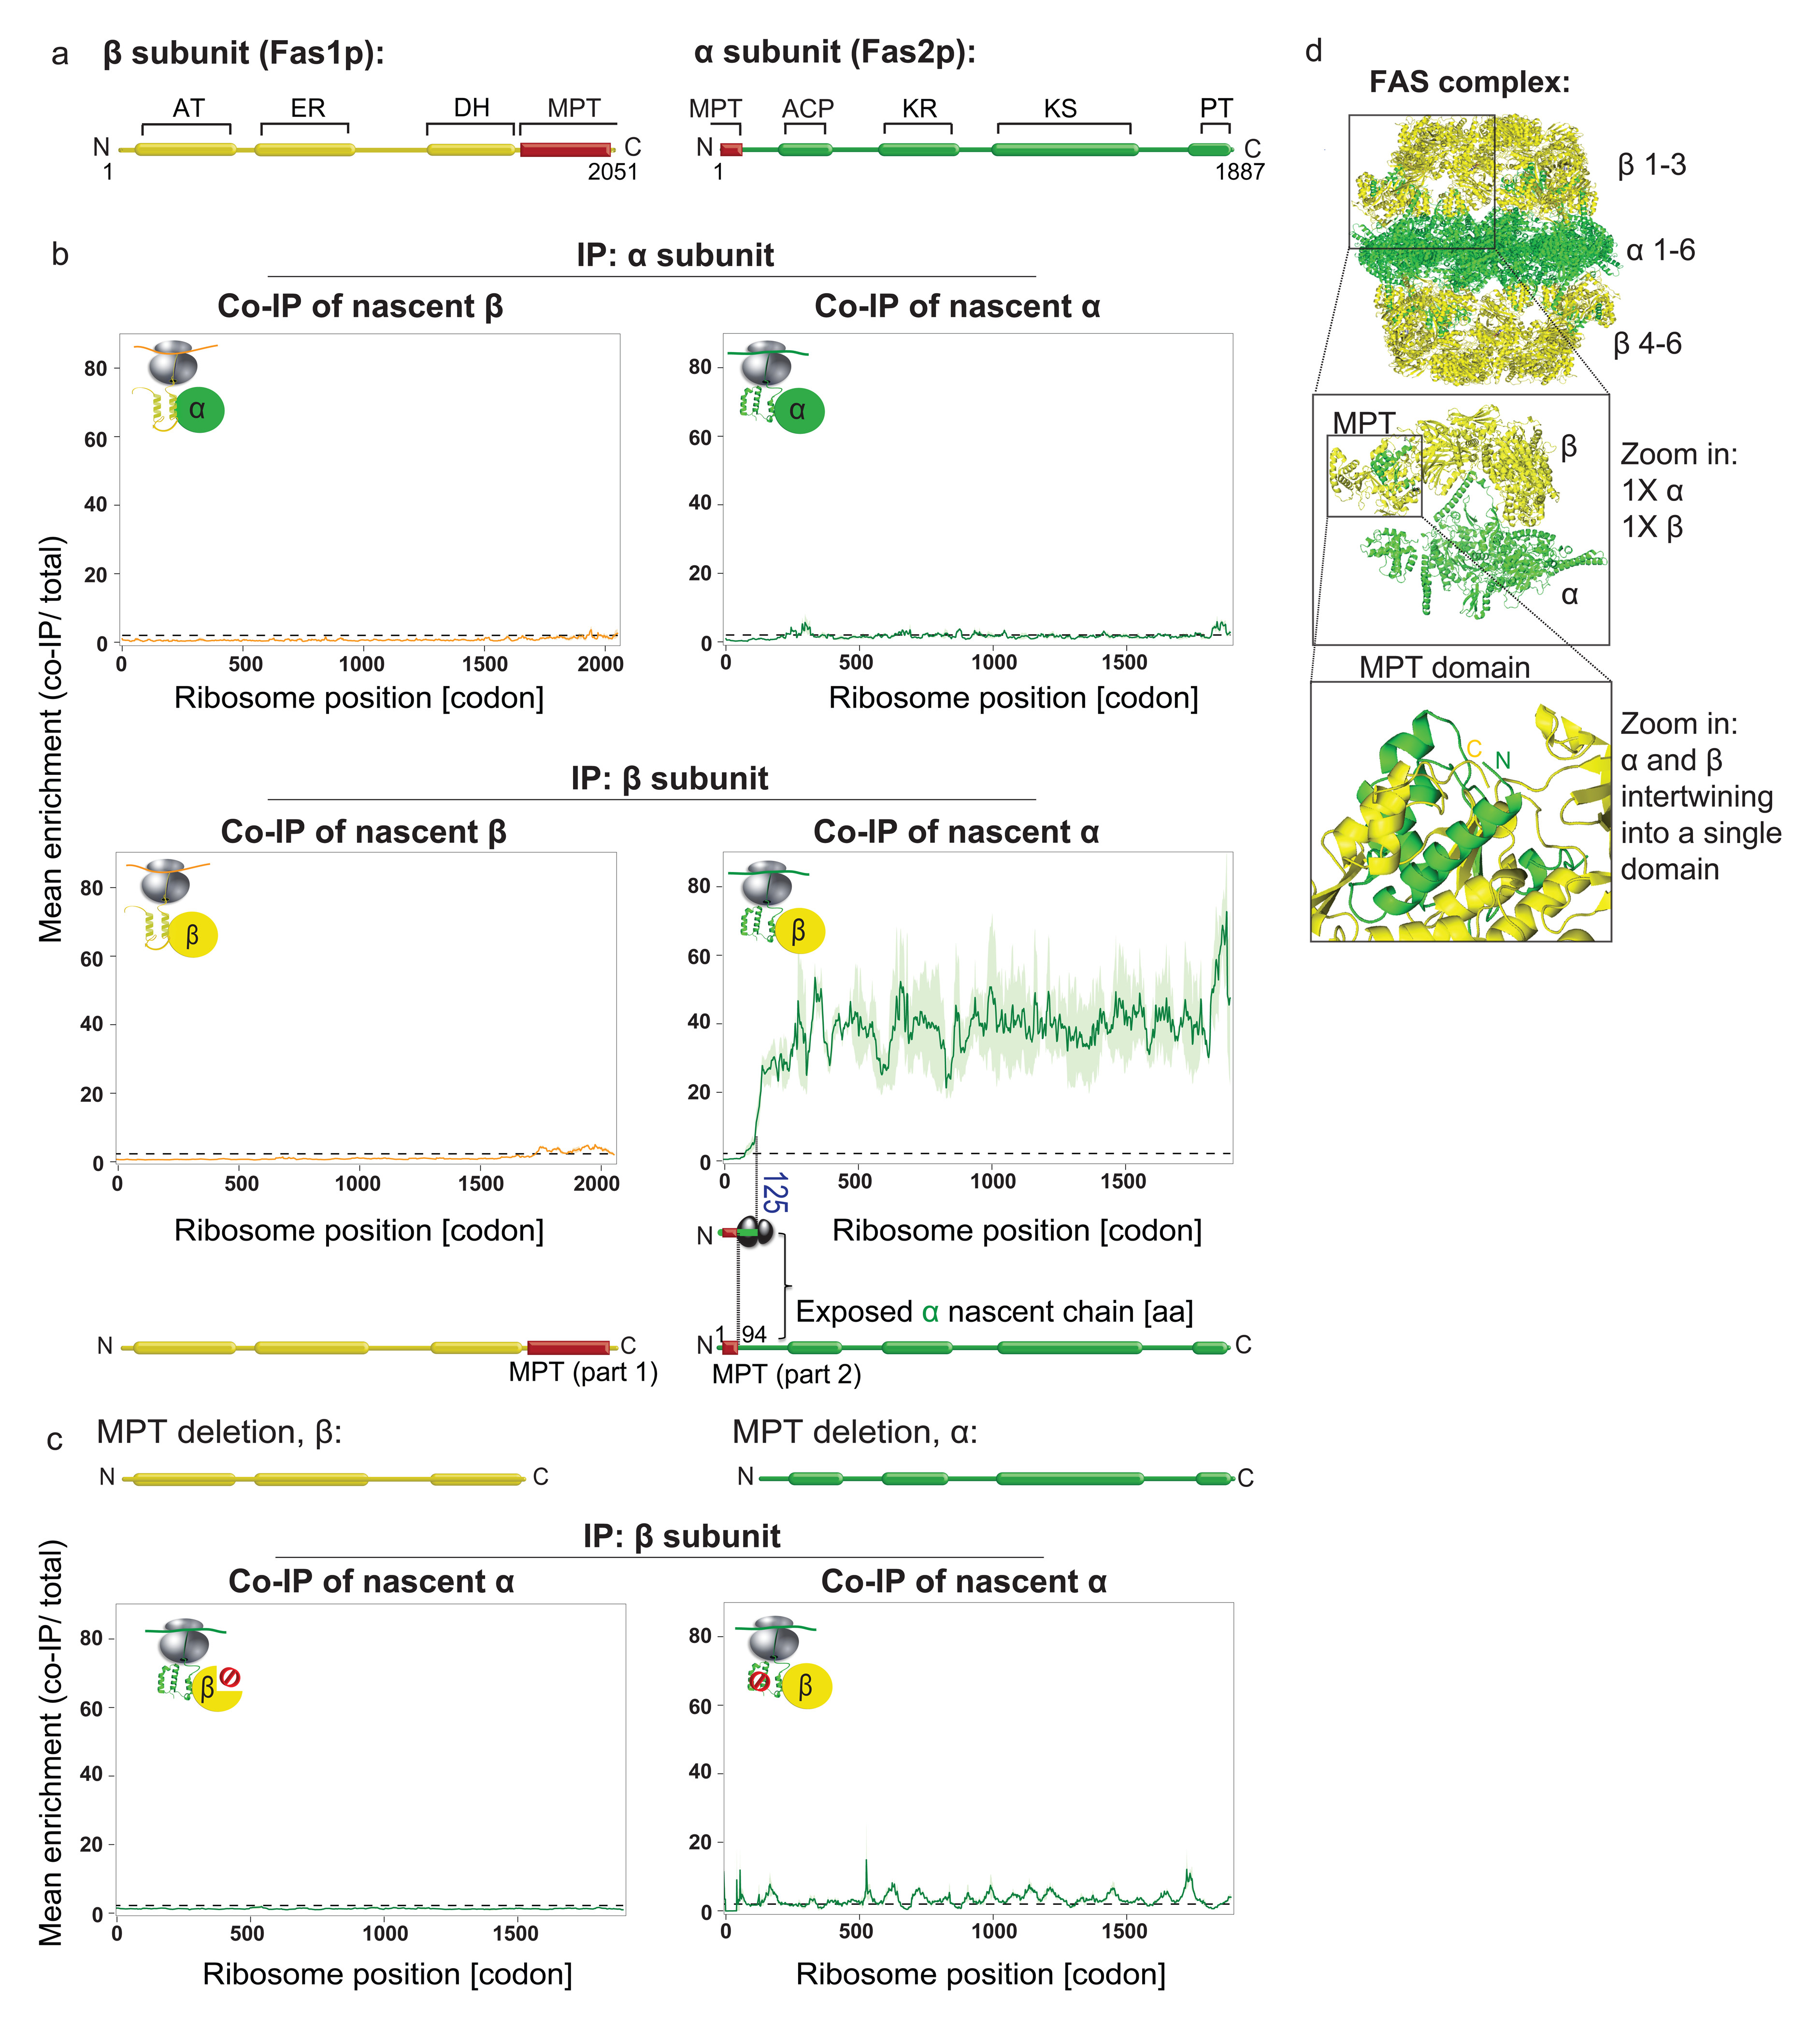
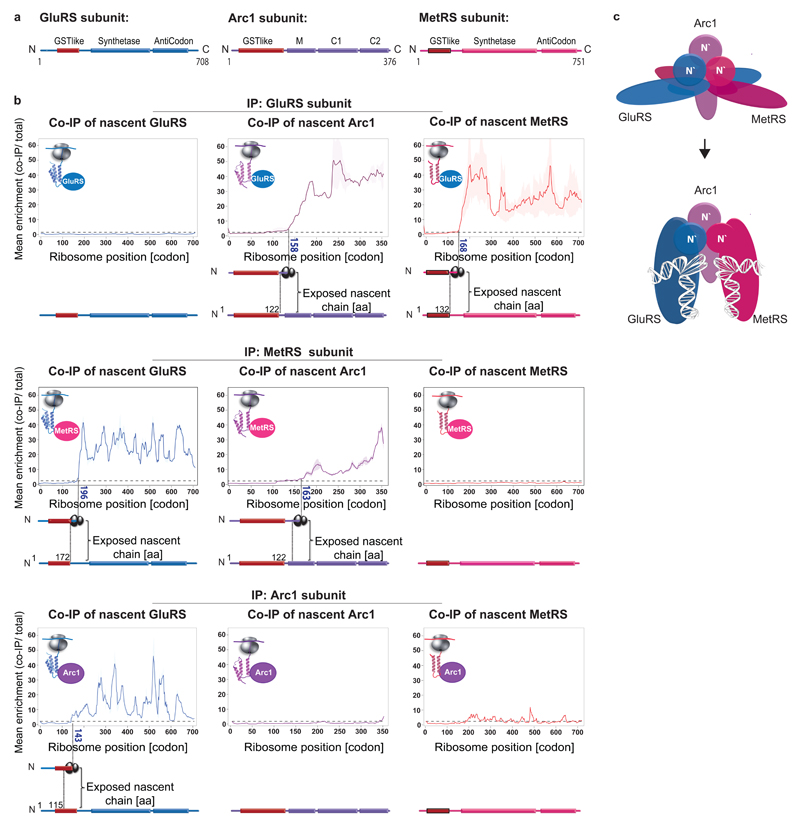
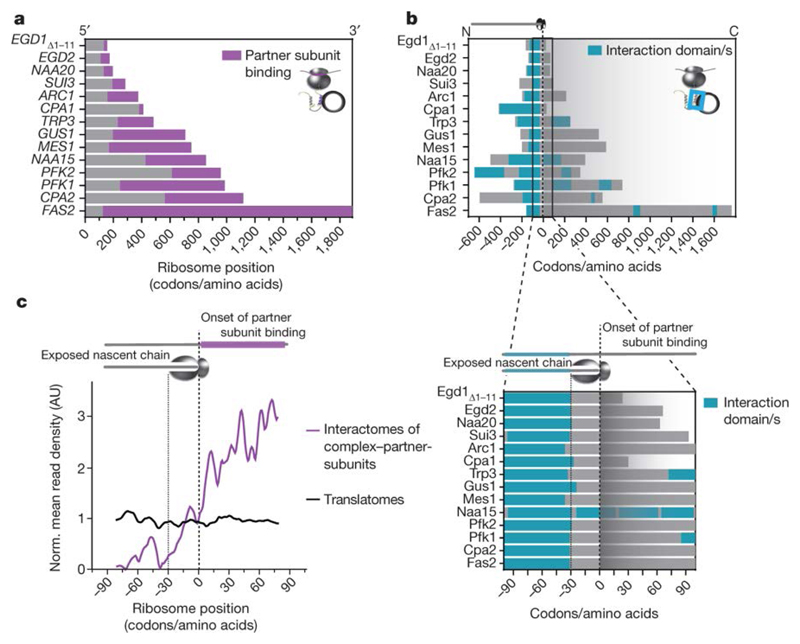
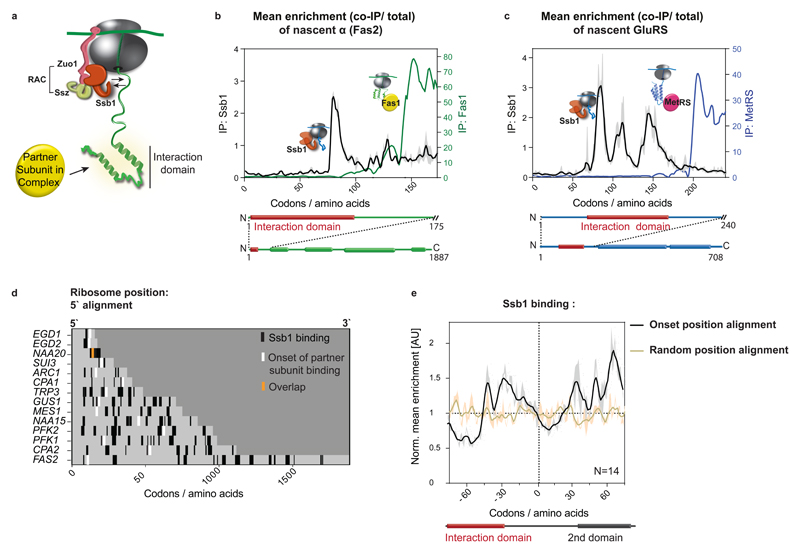
The folding of newly synthesized proteins to the native state is a major challenge within the crowded cellular environment, as non-productive interactions can lead to misfolding, aggregation and degradation1. Cells cope with this challenge by coupling synthesis with polypeptide folding and by using molecular chaperones to safeguard folding cotranslationally2. However, although most of the cellular proteome forms oligomeric assemblies3, little is known about the final step of folding: the assembly of polypeptides into complexes. In prokaryotes, a proof-of-concept study showed that the assembly of heterodimeric luciferase is an organized cotranslational process that is facilitated by spatially confined translation of the subunits encoded on a polycistronic mRNA4. In eukaryotes, however, fundamental differences-such as the rarity of polycistronic mRNAs and different chaperone constellations-raise the question of whether assembly is also coordinated with translation. Here we provide a systematic and mechanistic analysis of the assembly of protein complexes in eukaryotes using ribosome profiling. We determined the in vivo interactions of the nascent subunits from twelve hetero-oligomeric protein complexes of Saccharomyces cerevisiae at near-residue resolution. We find nine complexes assemble cotranslationally; the three complexes that do not show cotranslational interactions are regulated by dedicated assembly chaperones5-7. Cotranslational assembly often occurs uni-directionally, with one fully synthesized subunit engaging its nascent partner subunit, thereby counteracting its propensity for aggregation. The onset of cotranslational subunit association coincides directly with the full exposure of the nascent interaction domain at the ribosomal tunnel exit. The action of the ribosome-associated Hsp70 chaperone Ssb8 is coordinated with assembly. Ssb transiently engages partially synthesized interaction domains and then dissociates before the onset of partner subunit association, presumably to prevent premature assembly interactions. Our study shows that cotranslational subunit association is a prevalent mechanism for the assembly of hetero-oligomers in yeast and indicates that translation, folding and the assembly of protein complexes are integrated processes in eukaryotes.


Conflict of interest statement

The authors declare no competing financial interests.

Figures

Extended Data Figure 1
Extended Data Figure 1. Functionality of GFP-tagged FAS complex subunits, characteristics of co- versus post-translational FAS subunit interactions and the FAS assembly model.
a, GFP tagging of the FAS complex subunits does not affect growth under fatty acid depletion conditions, as compared to wild-type (YPD, right compared to YPD + fatty acids, left). A representative image from three biologically independent experiments is shown. b, Immunoblotting of the FAS complex subunits in input, flow through and immunopurification fractions of a typical SeRP experiment analysing samples of strains encoding either GFP- tagged α or β subunits. Data are from three biologically independent experiments. c, Puromycin-induced release of nascent chains (10 µg/ml, 10 min post lysis) decreases the interaction of nascent α with the C-terminally tagged β subunit, analysed by immunopurification followed by RT-qPCR. Data are normalized mean mRNA levels ± s.e.m. with each data point from three biologically independent experiments. d, Polysome profiles of samples following puromycin (puro) treatment (as in c) or CHX treatment. Data representative of three biologically independent experiments are shown. e, Post-lysis binding control: experimental scheme. Two independent cultures, of two strains, expressing either wild-type α subunit and C-terminally GFP- tagged β subunit; or wild-type β subunit and C-terminally TAP-tagged α subunit, were grown to log phase, OD600 nm 0.5. The cells were then mixed in a 1:1 ratio and subsequently lysed, subjected to GFP immunopurification and SeRP. f, Predicted SeRP engagement of nascent wild-type α or α-TAP ORF, by C-terminally GFP tagged β subunit. No post-lysis interactions: no detection of ribosome protected footprints of mRNA encoding TAP (top). Post-lysis interactions: detection of ribosome protected footprints of TAP-encoding mRNA at a similar level to wild-type α subunit ORF (bottom). g, Results of post-lysis binding control: engagement of nascent wild-type α or α-TAP by C-terminally GFP tagged β subunit, analyzed by SeRP, as in Fig.1. Data are from two biologically independent experiments. h, Model of the FAS complex assembly pathway.
Extended Data Figure 2
Extended Data Figure 2. Functionality of GFP-tagged multi-aminoacyl-tRNA synthetase complex subunits and the assembly model.
a, GFP tagging of the essential multi-aminoacyl-tRNA synthetase complex subunits does not affect growth, as compared to wildtype (YPD). A representative image from three biologically independent experiments is shown. b, Model of the multi-aminoacyl-tRNA synthetase complex assembly pathways.
Extended Data Figure 3
Extended Data Figure 3. Cotranslational assembly of the anthranilate synthase complex.
a, Domain organization of the anthranilate synthase subunits. b, Engagement of nascent Trp2p (tryptophan 2) and Trp3p (tryptophan 3) by C-terminally-tagged Trp2p subunit (top) compared to engagement of nascent Trp2p and Trp3p by C-terminally-tagged Trp3p subunit (bottom), analysed by SeRP. Data are from two biologically independent experiments. Coloured numbers indicate ribosome positions where the enrichment stably crosses the twofold threshold. The area between replicates is shaded, indicating the degree of experimental variation. c, Crystal structure of the homologous anthranilate synthase complex from the archaea Sulfolobus Solfataricus (~60% sequence similarity, PDB: 1QDL1). d, GFP tagging of the complex subunits does not affect cell growth under tryptophan depletion conditions (YPD, right panel compared to SD lacking tryptophan, left). A representative image from three biologically independent experiments is shown. e, Model of the anthranilate synthase assembly pathway.
Extended Data Figure 4
Extended Data Figure 4. Cotranslational assembly of the phosphofructokinase complex.
a, Domain organization of the phosphofructokinase (PFK) subunits. b, Engagement of nascent α and β by C-terminally tagged α subunit (top) compared to engagement of nascent α and β by C-terminally tagged β subunit (bottom), analysed by SeRP. Data are from two biologically independent experiments. Coloured numbers indicate ribosome positions when the enrichment stably crosses the twofold threshold. The area between replicates is shaded, indicating the degree of experimental variation. c, Top, crystal structure of the S. cerevisiae PFK complex (PDB: 3O8O2). Bottom, crystal structure of the highly homologous (~75% sequence similarities) Pichia pastoris (also known as Komagataella pastoris) PFK complex, PDB: 3OPY. Boxed: the N`- terminal glyoxalase I-like interface domains of α and β. This domain is missing in the S. cerevisiae structure, as the first 200aa of each subunit, containing this domain were cleaved before crystallization. d GFP tagging of the complex subunits does not affect cell growth with glucose as carbon source (YPD). A Representative of 3 biologically independent experiments is shown. e, Model of PFK assembly pathways.
Extended Data Figure 5
Extended Data Figure 5. Aggregation and degradation propensity of individual complex subunits.
a, Stability of individual complex subunits, tagged by GFP, determined by CHX chase, in wild-type and in deletion strains expressing orphan complex subunit. Cells with GFP fluorescence were analysed by FACS. Mean GFP fluorescence ± s.e.m are presented with each data point from three biologically independent experiments overlaid. In each experiment, 20,000 events were recorded. **P=0.0253, two tailed t-test. b, Solubility of individual complex subunits, tagged by GFP, determined by localization patterns changes, in wild-type and in deletion strains expressing orphan complex subunit. Log-phase cells (30°C) were fixed and analyzed by confocal microscopy. A representative image is shown. Scale bar 4µm (left panel). The fraction of cells displaying foci of GFP-tagged subunit per cell was quantified (right panel) (n=155 cells/sample; for 3 biologically independent experiments). The mean and SEM are presented, overlaid with each data point. c, Subunit aggregation is complex-specific. Solubility of the Naa15-GFP subunit of the NatA complex in trp2∆ mutant cells deleted for the Trp2 subunit of the TRP complex, analysed as in b. (n=155 cells/sample; from three biologically independent experiments). Data are mean ± s.e.m. overlaid with each data point. ** P=1.367248 × 10 −11 (middle) and P=7.850135 × 10 −10 of a (lower panel) of a two tailed t-test. d, Characteristics of cotranslational complex assembly interactions. Left, zoom-in on the first 400 codons, displaying the onset and persistence of cotranslational interaction of each subunit with its partner subunit or subunits, for all 14 subunits identified as cotranslationally engaged. Right, the corresponding normalized length of each ORF at the onset of cotranslational interactions with partner subunits, demonstrating the length variability at the onset position.
Extended Data Figure 6
Extended Data Figure 6. Proteome wide bioinformatics analysis of Ssb1 interplay with putative onset of cotranslational assembly interactions.
a, Metagene analysis of Ssb1–GFP interaction profiles with the nascent chains of 116 yeast proteins identified as putative cotranslationally assembling subunits (putative assembly identification algorithm and parameters detailed in the Supplementary Information). The dark grey line indicates Ssb interaction profiles, aligned to the subunits putative onset of cotranslational subunit association positions depicted as 0 (onset position alignment). A zoomed-in view of the nascent-chain segments at assembly onset position ±75 amino acids is shown. The orange line indicates Ssb binding profiles for nascent chains aligned to random positions along the ORFs. Data are from two biologically independent experiments. The area between replicates is shaded, indicating the degree of experimental variation. There is no correlation detected between the random and onset position alignment (Pearson correlation r2=0.2911), thus Ssb depletion at positions of onset is significant. b, Average Kyte-Doolittle hydrophobicity plot (7-amino-acid-window) of the 116 nascent-chain segments. A zoomed-in view of the nascent-chain segments at assembly onset position ±75 amino acids is shown, as in a.
Extended Data Figure 7
Extended Data Figure 7. Cotranslational interactions networks of FAS β, Cpa2 and PFK β metabolic enzymes subunits, analysed by SeRP.
a, Fatty acid synthesis metabolic pathway: nascent Faa1 is not engaged by C-terminally-tagged FAS complex β subunit, while nascent Acc1 shows a transient interaction, crossing the twofold enrichment threshold, at position approximately 250 codons/amino acids (indicated by an arrow). b, Arginine biosynthetic pathway: nascent Arg4 (argininosuccinate lyase) is not engaged by C-terminally-tagged Cpa2 subunit, whereas nascent Arg1 shows several transient interactions crossing the twofold enrichment threshold, at positions indicted by arrows. c, Glycolysis pathway: nascent Fba1 (fructose 1,6-bisphosphate aldolase) is not engaged by C-terminally tagged PFK complex β subunit, while Pyc2 (pyruvate carboxylase isoform) shows several transient interactions crossing the twofold enrichment threshold, at positions indicted by arrows. a-c, Data are from two biologically independent experiments. The area between replicates is shaded, indicating the degree of experimental variation.
Extended Data Figure 8
Extended Data Figure 8. Model of cotranslational folding and assembly of complex subunits.
a, Nascent chains emerging from the ribosome exit tunnel are first engaged by ribosome-associated chaperones. Upon emergence of a complete interaction domain the nascent chain is engaged by its complex partner subunit. This engagement remains stable throughout the rest of the ORF translation. b, The nascent-chain amino acid composition at the ribosome exit tunnel may direct the interplay between Ssb and partner subunit association. High hydrophobicity and positively charged amino acids (aa) are engaged by Ssb; low hydrophobicity disfavors binding of Ssb at the onset of subunit association, allowing for folding of the interaction domain and subunit joining. c, Modes of cotranslational assembly: most complexes are assembled in a unidirectional manner, in which one dedicated, fully synthesized subunit engages its nascent partner. d, Diverging misfolding propensities of complex subunits: subunits engaged as nascent chains are prone to misfolding, whereas their partner subunits are generally more stable.
Figure 1
Figure 1. Cotranslational assembly of the FAS complex.
a, Domain organization of FAS subunits: acyltransferase (AT), enoyl-reductase (ER), dehydratase (DH), malonyl/palmitoyl-transferase (MPT), acyl carrier protein (ACP), ketoreductase (KR), ketoacyl synthase (KS), phosphopantetheine transferase (PT). b, Nascent β and α engagement by C-terminally tagged α (top) or by C-terminally tagged β (bottom), analysed by SeRP. CThe ribosome position at which the enrichment stably crosses the twofold threshold (codon 125) is indicated. The area between replicates is shaded, indicating the degree of experimental variation. Data are from two biologically independent experiments. IP, immunopurification. c, Effect of the deletion of the MPT domain segment on cotranslational interactions, analysed as in b. Data are from two biologically independent experiments. d, Structural characteristics of the FAS complex and the MPT domain (PDB: 2UV8).
Figure 2
Figure 2. Cotranslational assembly of the aminoacyl-tRNA-synthetase complex.
a, Domain organization of aminoacyl-tRNA-synthetase subunits. b, Engagement of nascent GluRS (left), Arc1 (middle) and MetRS (right) by C-terminally tagged GluRS (top), C-terminally tagged MetRS (middle) or C-terminally tagged Arc1 (bottom), analysed by SeRP. Coloured numbers indicate ribosome positions at which the enrichments stably cross the twofold threshold (dotted line). The area between replicates area shaded, indicating the degree of experimental variation. Data are from two biologically independent experiments. c Illustration of the subunits N′-terminal interfaces and structural fluctuations upon tRNA binding, based on structural data derived from a previous study.
Figure 3
Figure 3. Characteristics of cotranslational complex assembly interactions.
a, Onset and persistence of the cotranslational interaction of each subunit with its partner complex subunit or subunits, for all 14 subunits identified as cotranslationally engaged. NAA20 and NAA15 are also known as NAT3 and NAT1, respectively.b, Top, interaction domain exposure correlated to the onset of assembly onset. Bottom, an expanded view of the region surrounding the onset of assembly.c, Normalized mean read density of interaction profiles of 14 cotranslationally engaged subunits, aligned and zoomed-in to the assembly onset of each nascent chain. AU, arbitrary units.
Figure 4
Figure 4. Coordination of cotranslational complex assembly with the ribosome-associated chaperone Ssb binding.
a, Illustration of ribosome–nascent-chain binding to Ssb or a partner subunit. b, c, Zoomed-in interaction profiles of Ssb1–GFP and cotranslationally engaged partner subunits with the nascent FAS α (b, Fas2) and nascent GluRS (c), analysed by SeRP. The area between replicates is shaded, indicating the degree of experimental variation. d, Heat map of Ssb1–GFP binding to ribosomes synthesizing the 14 cotranslationally engaged subunits, compared to complex assembly onset. e, Metagene analysis of Ssb1–GFP interaction profiles with 14 cotranslationally engaged nascent chains, aligned and zoomed-in to assembly onset, compared to random position along the ORFs alignment. There is no correlation between the onset and random position alignment (Pearson correlation r=0.01256), thus Ssb depletion at onset positions is significant. The area between replicates is shaded, indicating the degree of experimental variation. be, Data are from two biologically independent experiments.

Comment in

References

    1. Balchin D, Hayer-Hartl M, Hartl FU. In vivo aspects of protein folding and quality control. Science. 2016;353:aac4354. doi: 10.1126/science.aac4354. - DOI - PubMed
    1. Gloge F, Becker AH, Kramer G, Bukau B. Co-translational mechanisms of protein maturation. Current opinion in structural biology. 2014;24:24–33. doi: 10.1016/j.sbi.2013.11.004. - DOI - PubMed
    1. Benschop JJ, et al. A consensus of core protein complex compositions for Saccharomyces cerevisiae. Molecular cell. 2010;38:916–928. doi: 10.1016/j.molcel.2010.06.002. - DOI - PubMed
    1. Shieh YW, et al. Operon structure and cotranslational subunit association direct protein assembly in bacteria. Science. 2015;350:678–680. doi: 10.1126/science.aac8171. - DOI - PubMed
    1. Le Tallec B, et al. 20S proteasome assembly is orchestrated by two distinct pairs of chaperones in yeast and in mammals. Molecular cell. 2007;27:660–674. doi: 10.1016/j.molcel.2007.06.025. - DOI - PubMed

Publication types

MeSH terms