

Crystallization of Organic Molecules: Nonclassical Mechanism Revealed by Direct Imaging
- PMID: 30159400
- PMCID: PMC6107864
- DOI: 10.1021/acscentsci.8b00289
Crystallization of Organic Molecules: Nonclassical Mechanism Revealed by Direct Imaging
Abstract
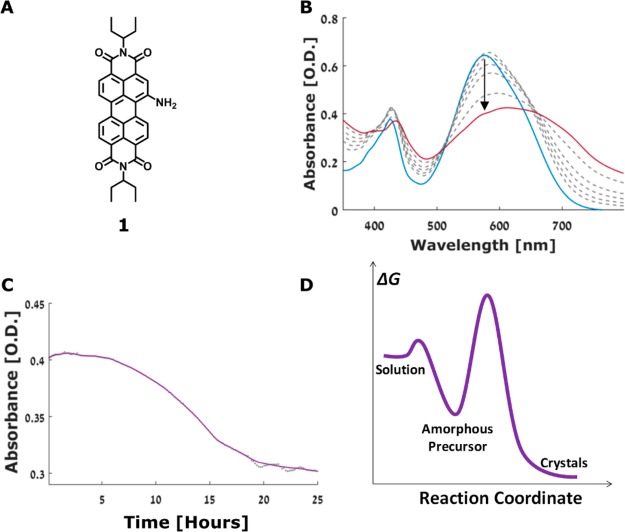
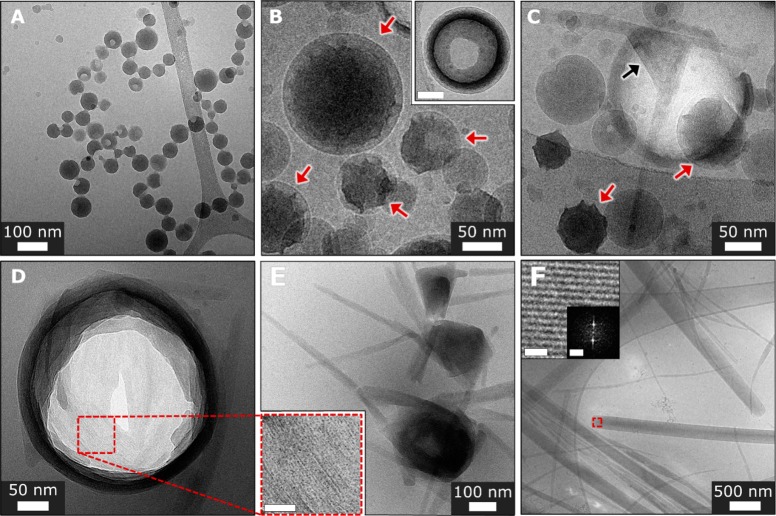
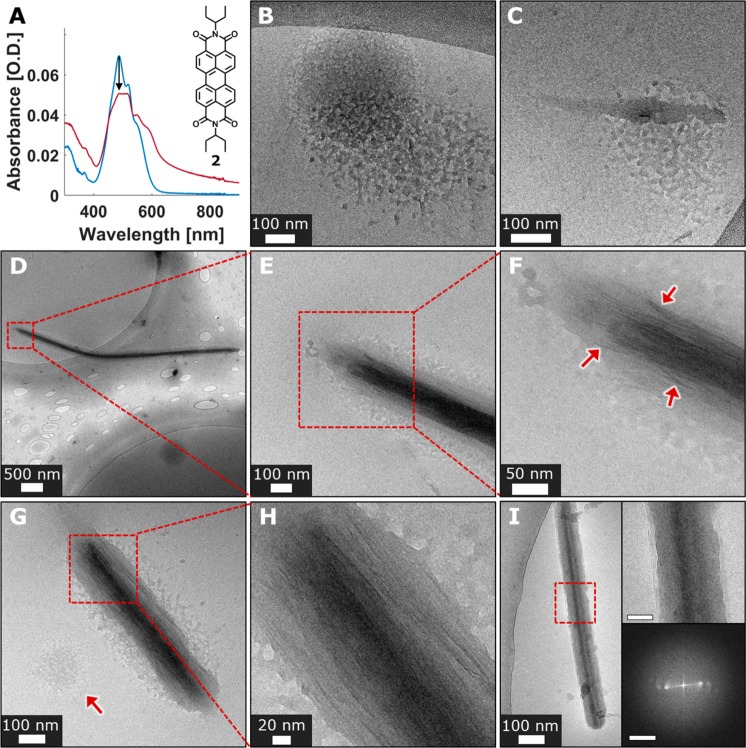
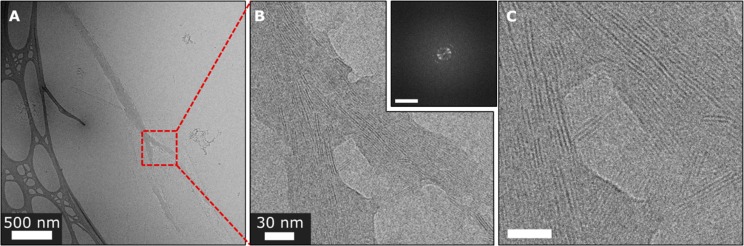
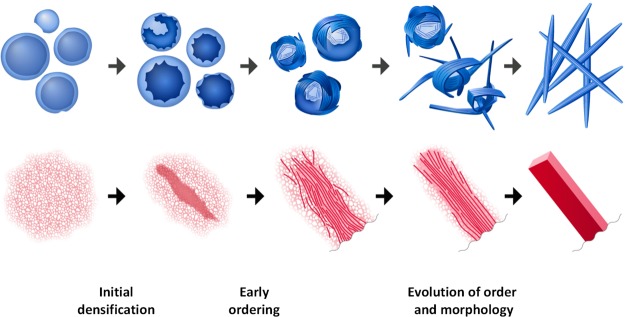
Organic crystals are of primary importance in pharmaceuticals, functional materials, and biological systems; however, organic crystallization mechanisms are not well-understood. It has been recognized that "nonclassical" organic crystallization from solution involving transient amorphous precursors is ubiquitous. Understanding how these precursors evolve into crystals is a key challenge. Here, we uncover the crystallization mechanisms of two simple aromatic compounds (perylene diimides), employing direct structural imaging by cryogenic electron microscopy. We reveal the continuous evolution of density, morphology, and order during the crystallization of very different amorphous precursors (well-defined aggregates and diffuse dense liquid phase). Crystallization starts from initial densification of the precursors. Subsequent evolution of crystalline order is gradual, involving further densification concurrent with optimization of molecular ordering and morphology. These findings may have implications for the rational design of organic crystals.
Conflict of interest statement
The authors declare no competing financial interest.
Figures
Similar articles
-
Crystallization of Small Organic Molecules in a Polymer Matrix: Multistep Mechanism Enables Structural Control.Small. 2019 Sep;15(38):e1902936. doi: 10.1002/smll.201902936. Epub 2019 Aug 5. Small. 2019. PMID: 31379126
-
Precrystalline Aggregates Enable Control over Organic Crystallization in Solution.Angew Chem Int Ed Engl. 2016 Jan 4;55(1):179-82. doi: 10.1002/anie.201507659. Epub 2015 Nov 10. Angew Chem Int Ed Engl. 2016. PMID: 26553393
-
Multistep Crystallization of Pharmaceutical Amorphous Nanoparticles via a Cognate Pathway of Oriented Attachment: Direct Evidence of Nonclassical Crystallization for Organic Molecules.Nano Lett. 2022 Aug 24;22(16):6841-6846. doi: 10.1021/acs.nanolett.2c01608. Epub 2022 Jul 13. Nano Lett. 2022. PMID: 35830610
-
Nonclassical crystallization in vivo et in vitro (II): Nanogranular features in biomimetic minerals disclose a general colloid-mediated crystal growth mechanism.J Struct Biol. 2016 Nov;196(2):260-287. doi: 10.1016/j.jsb.2016.09.005. Epub 2016 Sep 9. J Struct Biol. 2016. PMID: 27620641 Review.
-
Direct Imaging of the Kinetic Crystallization Pathway: Simulation and Liquid-Phase Transmission Electron Microscopy Observations.Materials (Basel). 2023 Mar 1;16(5):2026. doi: 10.3390/ma16052026. Materials (Basel). 2023. PMID: 36903141 Free PMC article. Review.
Cited by
-
An investigation of the kinetics and thermodynamics of NaCl nucleation through composite clusters.PNAS Nexus. 2022 Mar 30;1(2):pgac033. doi: 10.1093/pnasnexus/pgac033. eCollection 2022 May. PNAS Nexus. 2022. PMID: 36713321 Free PMC article.
-
Nonclassical Crystallization and Core-Shell Structure Formation of Ibuprofen from Binary Solvent Solutions.Cryst Growth Des. 2023 Jan 4;23(1):236-245. doi: 10.1021/acs.cgd.2c00971. Epub 2022 Dec 21. Cryst Growth Des. 2023. PMID: 36624777 Free PMC article.
-
Observation of crystallisation dynamics by crystal-structure-sensitive room-temperature phosphorescence from Au(I) complexes.Commun Chem. 2020 Oct 14;3(1):139. doi: 10.1038/s42004-020-00382-1. Commun Chem. 2020. PMID: 36703373 Free PMC article.
-
Nonclassical Crystallization of the L‑Tartrate Salt of Cyamemazine.Cryst Growth Des. 2025 Jul 15;25(15):5813-5821. doi: 10.1021/acs.cgd.5c00223. eCollection 2025 Aug 6. Cryst Growth Des. 2025. PMID: 40787077 Free PMC article.
-
A nonclassical pathway of β-hematin crystal nucleation enables its suppression by antimalarials.Commun Chem. 2025 Aug 13;8(1):246. doi: 10.1038/s42004-025-01612-0. Commun Chem. 2025. PMID: 40804158 Free PMC article.
References
LinkOut - more resources
Full Text Sources
Other Literature Sources
