. 2018:1:70.
doi: 10.1038/s42003-018-0075-x. Epub 2018 Jun 13.

Predicting resistance of clinical Abl mutations to targeted kinase inhibitors using alchemical free-energy calculations

Affiliations

Predicting resistance of clinical Abl mutations to targeted kinase inhibitors using alchemical free-energy calculations

Kevin Hauser et al. Commun Biol. 2018.

Abstract

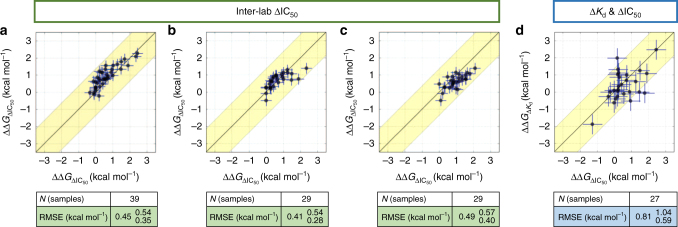
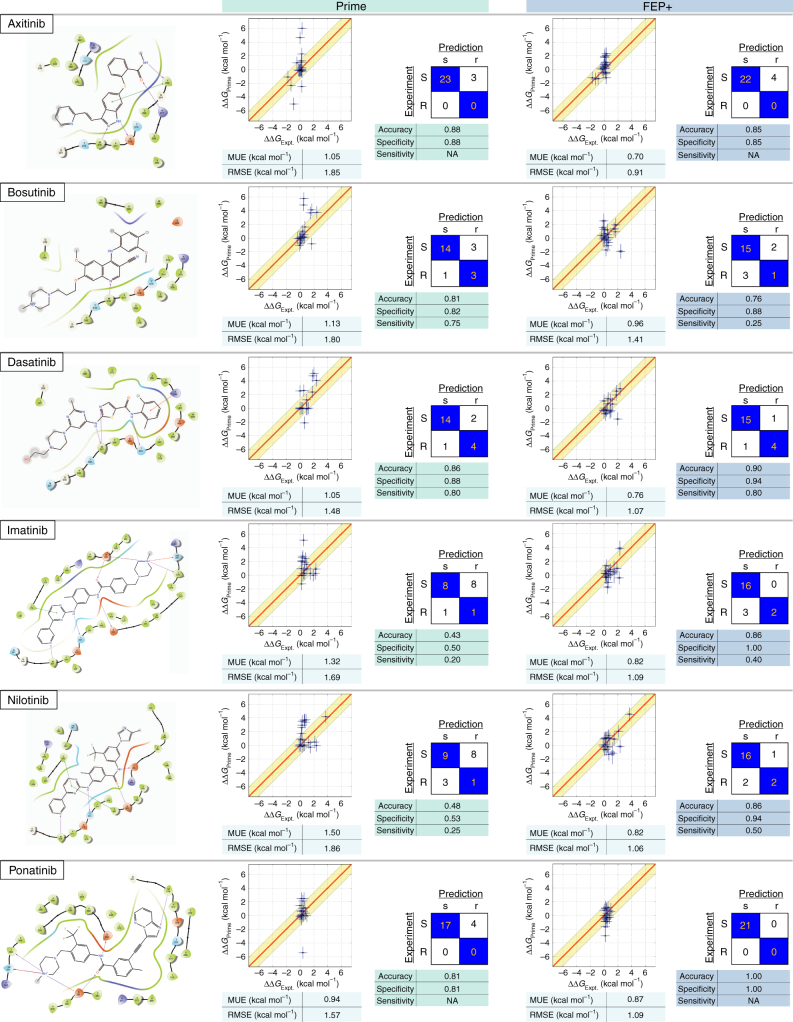
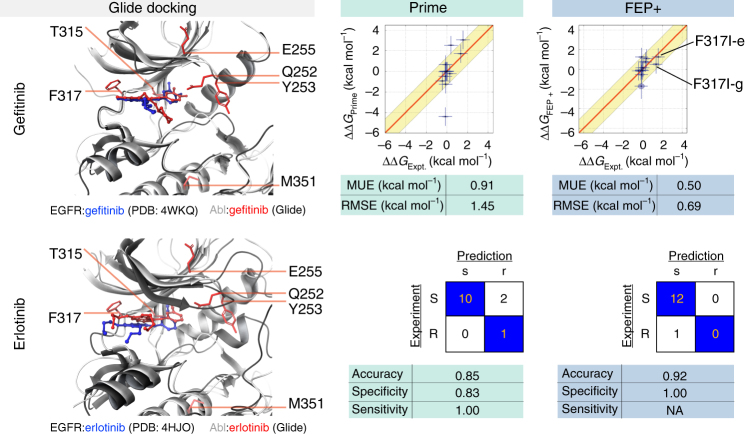
The therapeutic effect of targeted kinase inhibitors can be significantly reduced by intrinsic or acquired resistance mutations that modulate the affinity of the drug for the kinase. In cancer, the majority of missense mutations are rare, making it difficult to predict their impact on inhibitor affinity. This complicates the practice of precision medicine, pairing of patients with clinical trials, and development of next-generation inhibitors. Here, we examine the potential for alchemical free-energy calculations to predict how kinase mutations modulate inhibitor affinities to Abl, a major target in chronic myelogenous leukemia (CML). We find these calculations can achieve useful accuracy in predicting resistance for a set of eight FDA-approved kinase inhibitors across 144 clinically-identified point mutations, achieving a root mean square error in binding free energy changes of 1.10.91.3 kcal/mol (95% confidence interval) and correctly classifying mutations as resistant or susceptible with 888293% accuracy. Since these calculations are fast on modern GPUs, this benchmark establishes the potential for physical modeling to collaboratively support the rapid assessment and anticipation of the potential for patient mutations to affect drug potency in clinical applications.


Conflict of interest statement

J.D.C. is a member of the Scientific Advisory Board for Schrödinger Inc. S.R. is a former employee of Schrödinger Inc.; and K.H., C.N., R.A., T.S., and L.W. are employees of Schrödinger Inc.

Figures

Fig. 1
Fig. 1
Relative alchemical free-energy calculations can be used to predict affinity changes of FDA-approved selective kinase inhibitors arising from clinically identified mutations in their targets of therapy. a Missense mutation statistics derived from 10,336 patient samples subjected to Memorial Sloan Kettering-Integrated Mutation Profiling of Actionable Cancer Targets (MSK-IMPACT) deep sequencing panel show that 68.5% of missense kinase mutations in cancer patients have never been observed previously, while 87.4% have been observed no more than ten times; the vast majority of clinically observed missense kinase mutations are unique to each patient. b To compute the impact of a clinical point mutation on inhibitor binding free energy, a thermodynamic cycle can be used to relate the free energy of the wild-type and mutant kinase in the absence (top) and presence (bottom) of the inhibitor. c Summary of mutations studied in this work. Frequency of the wild-type (dark green) and mutant (green) residues for the 144 clinically-identified Abl mutations used in this study (see Table 1 for data sources). Also shown is the frequency of residues within 5 Å (light blue) and 8 Å (blue) of the binding pocket. The ordering of residues along the x-axis corresponds to the increasing occurrence of residues within 5 Å of the binding pocket. The number of wild-type Phe residues (n = 45) and mutant Val residues (n = 31) exceeded the limits of the y-axis
Fig. 2
Fig. 2
Cross-comparison of the experimentally measured effects that mutations in Abl kinase have on ligand binding, performed by different labs. ΔΔG was computed from publicly available ΔpIC50 or ΔpKd measurements and these values of ΔΔG were then plotted and the RMSE between them reported. a ΔpIC50 measurements (X-axis) from ref. compared with ΔpIC50 measurements (Y-axis) from ref. . b ΔpIC50 measurements (X-axis) from ref. compared with ΔpIC50 measurements (Y-axis) from ref. . c ΔpIC50 measurements (X-axis) from ref. compared with ΔpIC50 measurements (Y-axis) from ref. . d ΔpIC50 measurements (X-axis) from ref. compared with ΔpKd measurements (Y-axis) from ref. using non-phosphorylated Abl kinase. Scatter plot error bars in (ac) are ±standard error (SE) taken from the combined 97 inter-lab ΔΔGs derived from the ΔpIC50 measurements, which was 0.320.280.36; the RMSE was 0.450.390.51 kcal mol−1. Scatter plot error bars in (d) are the ±standard error (SE) of ΔΔGs derived from ΔpIC50 and ΔpKd from a set of 27 mutations, which is 0.580.420.74 kcal mol−1; the RMSE was 0.810.591.04 kcal mol−1
Fig. 3
Fig. 3
Comparison of experimentally measured binding free-energy changes (ΔΔG) for 131 clinically observed mutations and 6 targeted kinase inhibitors (TKI). Co-crystal structures are publicly available for wild-type Abl kinase (see Methods) bound to these inhibitors. Top panel: Abl:TKI co-crystal structures (protein is gray; TKI is green) with positions of point mutations shown as spheres colored from blue (near) to red (far) by relative distance from the inhibitor. Middle panel: Scatter plots show Prime and FEP+ computed ΔΔG compared to experiment. Variability (ellipses) in experimental ΔΔG (standard error between IC50-derived ΔΔG measurements made by different labs, 0.32 kcal mol−1) and computed ΔΔGσ = 0 kcal mol−1 for Prime while for FEP+ the standard error of the mean from 3 independent runs). Experimental error bars (σexp) are the standard error between ΔpIC50 and ΔKd measurements, 0.58 kcal mol−1. To better highlight true outliers unlikely to simply result from expected forcefield error, we presume forcefield error (σFF ≈ 0.9 kcal mol−1) also behaves as a random error, and represent the total estimated statistical and forcefield error σFF2+σexp∕cal2 as vertical error bars. The yellow region indicates area in which predicted ΔΔG is within 1.36 kcal mol−1 of experiment. Two mutations were beyond the concentration limit of the assay and were not plotted; N = 129. Bottom panel: Truth tables and classification results include T315I/dasatinib and L248R/imatinib; 131 points were used. Truth tables of classification accuracy, sensitivity and specificity using two-classes (resistant: ΔΔG > 1.36 kcal/mol; ΔΔG ≤ 1.36 kcal/mol). For MUE, RMSE, and classification statistics, sub/superscripts denote 95 % CIs. For Prime, *MUE highlights that the Bayesian model yields a value for MUE that is noticeably larger than MUE for observed data due to the non-Gaussian error distribution of Prime
Fig. 4
Fig. 4
Physical modeling accuracy in computing the impact of clinical Abl mutations on selective inhibitor binding. Ligand interaction diagrams for six selective FDA-approved TKIs for which co-crystal structures with Abl were available (left). Comparisons for clinically observed mutations are shown for FEP+ (right) and Prime (left). For each ligand, computed vs. experimental binding free energies (ΔΔG) are plotted with MUE and RMSE (units of kcal mol−1) depicted below. Truth tables are shown to the right. Rows denote true susceptible (S, ΔΔG ≤ 1.36 kcal mol−1) or resistant (R, ΔΔG > kcal mol−1) experimental classes using a 1.36 kcal mol−1 (10-fold change) threshold; columns denote predicted susceptible (s, ΔΔG ≤ kcal mol−1) or resistant (r, ΔΔG > kcal mol−1). Correct predictions populate diagonal elements (orange text), incorrect predictions populate off-diagonals. Accuracy, specificity, and sensitivity for two-class classification are shown below the truth table. Elliptical point sizes and error bars in the scatter plots depict estimated uncertainty/variability and error, respectively, (±σ) of FEP+ values (vertical size) and experimental values (horizontal size). Note: The sensitivity for axitinib and ponatinib is NA, because there is no resistant mutation for these two drugs
Fig. 5
Fig. 5
Predicting resistance mutations using FEP+ for inhibitors for which co-crystal structures with wild-type kinase are not available. The docked pose of Abl:erlotinib is superimposed on the co-crystal structure of EGFR:erlotinib; erlotinib docked to Abl (light gray) is depicted in green and erlotinib bound to EGFR (dark gray) is depicted in blue. The docked pose of Abl:gefitinib is superimposed on the co-crystal structure of EGFR:gefitinib; gefitinib docked to Abl (light gray) is depicted in green and gefitinib bound to EGFR (dark gray) is depicted in blue. The locations of clinical mutants for each inhibitor are highlighted (red spheres). The overall RMSEs and MUEs for Prime (center) and FEP+ (right) and two-class accuracies are also shown in the figure. Computed free-energy changes due to the F317I mutation for erlotinib (−e) and gefitinib (−g) are highlighted in the scatter plot. FEP+ results are based on the docked models prepared with crystal waters added back while the Prime (an implicit solvent model) results are based on models without crystallographic water

References

    1. Roskoski, R. Jr. USFDA approved protein kinase inhibitors. http://www.brimr.org/PKI/PKIs.htm (2017).
    1. Santos R, et al. A comprehensive map of molecular drug targets. Nat. Rev. Drug Discov. 2016;16:19–34. doi: 10.1038/nrd.2016.230. - DOI - PMC - PubMed
    1. Shah NP, et al. Multiple BCR-ABL kinase domain mutations confer polyclonal resistance to the tyrosine kinase inhibitor imatinib (STI571) in chronic phase and blast crisis chronic myeloid leukemia. Cancer Cell. 2002;2:117–125. doi: 10.1016/S1535-6108(02)00096-X. - DOI - PubMed
    1. Buczek M, Escudier B, Bartnik E, Szczylik C, Czarnecka A. Resistance to tyrosine kinase inhibitors in clear cell renal cell carcinoma: From the patient’s bed to molecular mechanisms. Biochim. Biophys. Acta Rev. Cancer. 2014;1845:31–41. doi: 10.1016/j.bbcan.2013.10.001. - DOI - PubMed
    1. Huang L, Fu L. Mechanisms of resistance to EGFR tyrosine kinase inhibitors. Acta Pharm. Sin. B. 2015;5:390–401. doi: 10.1016/j.apsb.2015.07.001. - DOI - PMC - PubMed

LinkOut - more resources