Review
. 2018 Aug:10:43-52.
doi: 10.1016/j.coisb.2018.05.004.

Machine learning and image-based profiling in drug discovery

Affiliations
Review

Machine learning and image-based profiling in drug discovery

Christian Scheeder et al. Curr Opin Syst Biol. 2018 Aug.

Abstract

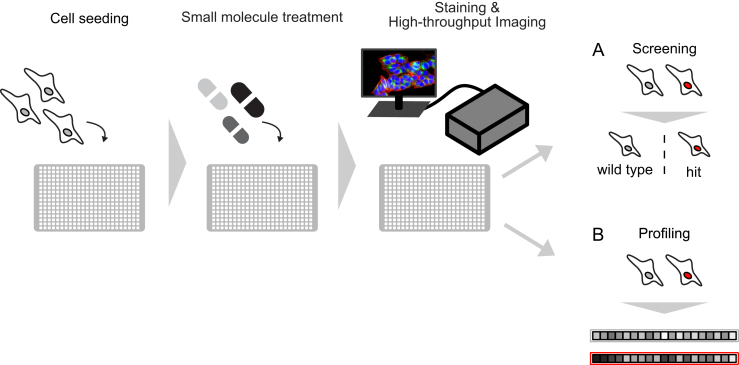
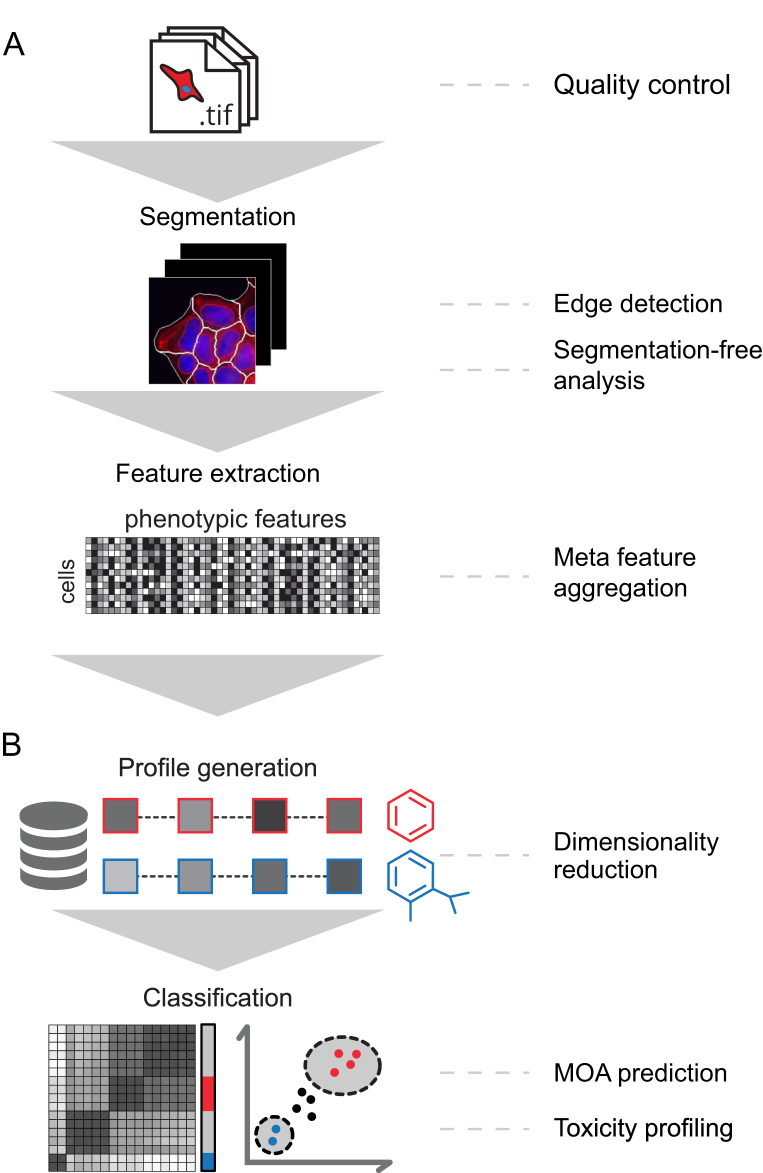
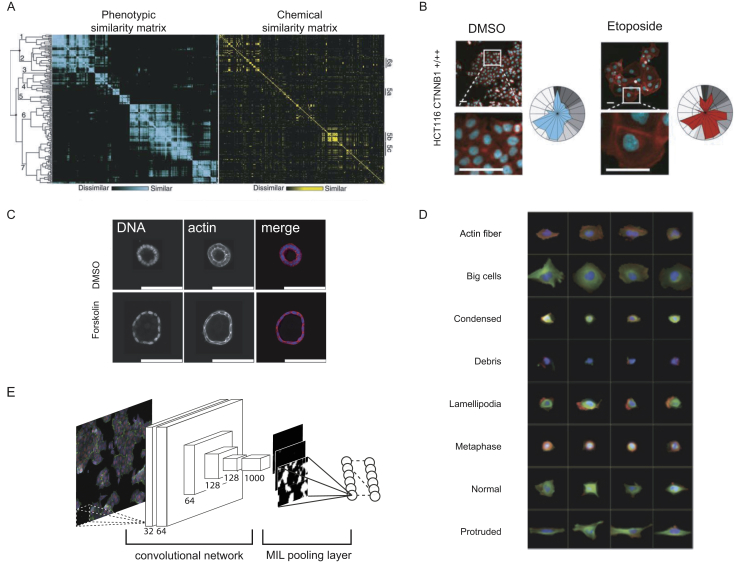
The increase in imaging throughput, new analytical frameworks and high-performance computational resources open new avenues for data-rich phenotypic profiling of small molecules in drug discovery. Image-based profiling assays assessing single-cell phenotypes have been used to explore mechanisms of action, target efficacy and toxicity of small molecules. Technological advances to generate large data sets together with new machine learning approaches for the analysis of high-dimensional profiling data create opportunities to improve many steps in drug discovery. In this review, we will discuss how recent studies applied machine learning approaches in functional profiling workflows with a focus on chemical genetics. While their utility in image-based screening and profiling is predictably evident, examples of novel insights beyond the status quo based on the applications of machine learning approaches are just beginning to emerge. To enable discoveries, future studies also need to develop methodologies that lower the entry barriers to high-throughput profiling experiments by streamlining image-based profiling assays and providing applications for advanced learning technologies such as easy to deploy deep neural networks.

Keywords: Drug discovery; High-content analysis; High-throughput screening; Image analysis; Imaging; Machine learning.


Figures

Figure 1
Figure 1
Typical workflow of image-based small molecule experiments. A typical high-throughput imaging experiment starts with the seeding of adherent cells in suitable microtiter plates (e.g. 384-well plates) followed by an incubation time of several hours to let the cells attach. In a second step, compounds are added using robotic liquid handling stations. In simple experiments cells are perturbed with one compound per well before the assay is stopped by fixation and staining of cells. Finally, plates are imaged using automated microscopes (wide-field or confocal, one or more fields on view, [23]). This generic workflow describes the basic steps of high-throughput imaging experiments which can further be distinguished in two approaches. (A) Screening experiments are designed to identify small molecules that modulate a pre-defined phenotype. (B) Profiling experiments follow an unbiased approach to profile cells upon perturbations by extracting hundreds of phenotypic measurements. In both approaches the application of more complex experimental designs and cell culture models such as 3-D cell culture will require specific microscopes, additional processing steps and, thus, reduce throughput.
Figure 2
Figure 2
Typical analysis strategy and machine learning applications in image-based small molecule profiling experiments. (A) Images acquired in a high-throughput profiling experiment are analyzed using automated, highly parallelized analysis pipelines that employ software such as CellProfiler, R/EBImage, Icy or ImageJ. In a first step, the quality of the images is controlled. For this purpose, machine learning classifiers can be trained to recognize and remove images with artifacts. Segmentation-based or segmentation-free approaches are then used to extract quantitative image features that represent the cellular phenotypes (see Box 1 for more details). (B) The extracted phenotypic features may be used “as is” or further processed to derive meta-feature vectors representing each perturbation. Treatment-level profiles are then further used to classify compounds with shared MOA, toxicity or to assess the efficacy of candidate molecules.
Figure 3
Figure 3
Example images and analyses for image-based small molecule profiling. (A) Young et al. could show that substantial correlation between phenotypic feature vectors and chemical similarities based on compound chemical structure exists. This implied that phenotypic similarities could be harnessed to find small molecules with similar chemical structure (adapted from Ref. [28]). (B) Breinig et al. built on this observation and tested if image-based phenotypic profiles also reveal cell line specific responses to certain compound perturbations. They found, for example, that the presence or absence of the CTNNB1 mutant allele causes a differential cellular reaction to Etoposide treatment (adapted from Ref. [25]). (C) 3D-cyst culture was applied by Booij et al. to map the activity and function of small molecule compounds and antibodies by image-based profiling. Using this analysis, they found that PI3K inhibitor treatment was not able to suppress forskolin induced cyst swelling (adapted from Ref. [68]). (D) Schematic illustration of the neural network architecture (left) that was used by Kraus et al. to classify small molecules by mechanism of action from full-size microscopy images of cancer cells. Kraus et al. combined deep convolutional networks with multiple instance learning (MIL) to classify small molecules based on image-level labels. In a second step the architecture of the convolutional MIL model allowed tracing back and segmenting single cells in the full-size images (, figure kindly provided by O. Kraus). (E) Fuchs et al. employed a classifier to group cells into phenotypic classes. By classifying single cells phenotypic class upon RNAi perturbation they could group genes based on phenotypic similarity and functionally related groups (adapted from Ref. [16]).

References

    1. Nüsslein-Volhard C., Wieschaus E. Mutations affecting segment number and polarity in Drosophila. Nature. 1980;287:795–801. - PubMed
    1. Sepp K.J., Hong P., Lizarraga S.B., Liu J.S., Mejia L.A., Walsh C.A., Perrimon N. Identification of neural outgrowth genes using genome-wide RNAi. PLoS Genet. 2008;4:e1000111. - PMC - PubMed
    1. Kiger A.A., Baum B., Jones S., Jones M.R., Coulson A., Echeverri C., Perrimon N. A functional genomic analysis of cell morphology using RNA interference. J Biol. 2003;2:27. - PMC - PubMed
    1. Kamath R.S., Ahringer J. Genome-wide RNAi screening in Caenorhabditis elegans. Methods. 2003;30:313–321. - PubMed
    1. Boutros M., Heigwer F., Laufer C. Microscopy-based high-content screening. Cell. 2015;163:1314–1325. - PubMed