

Evidence of induced muscle regeneration persists for years in the mouse
- PMID: 30159908
- PMCID: PMC6296893
- DOI: 10.1002/mus.26329
Evidence of induced muscle regeneration persists for years in the mouse
Abstract
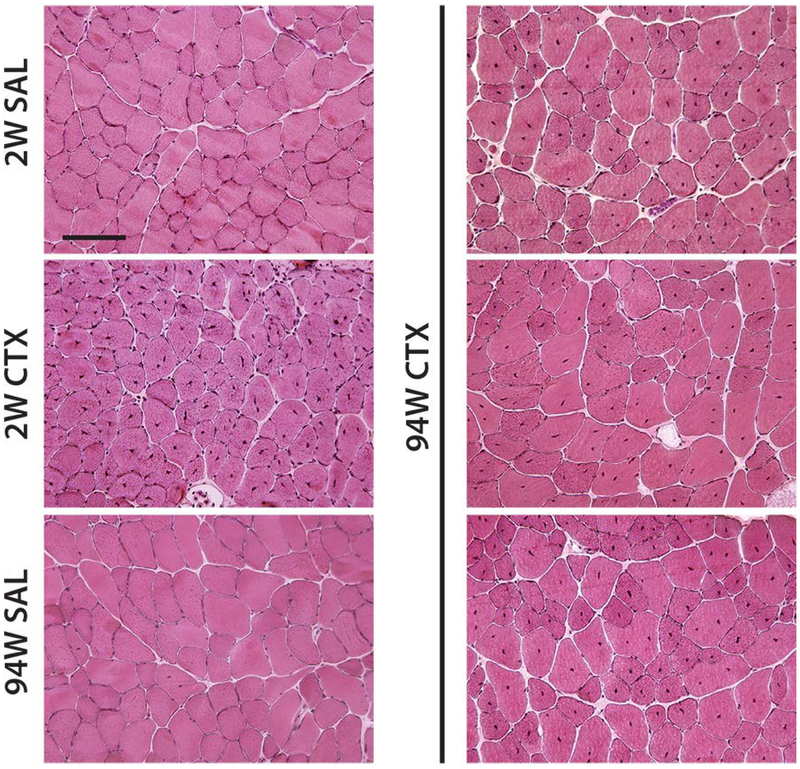
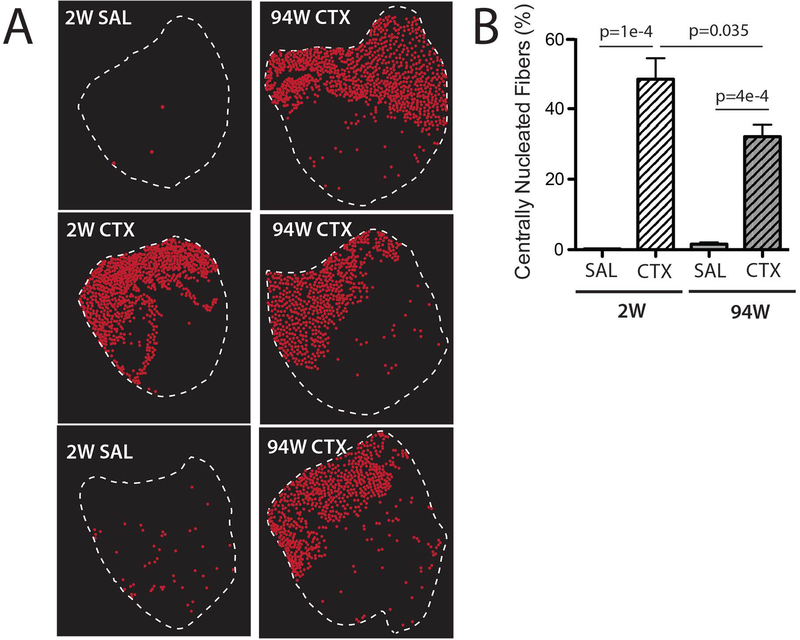
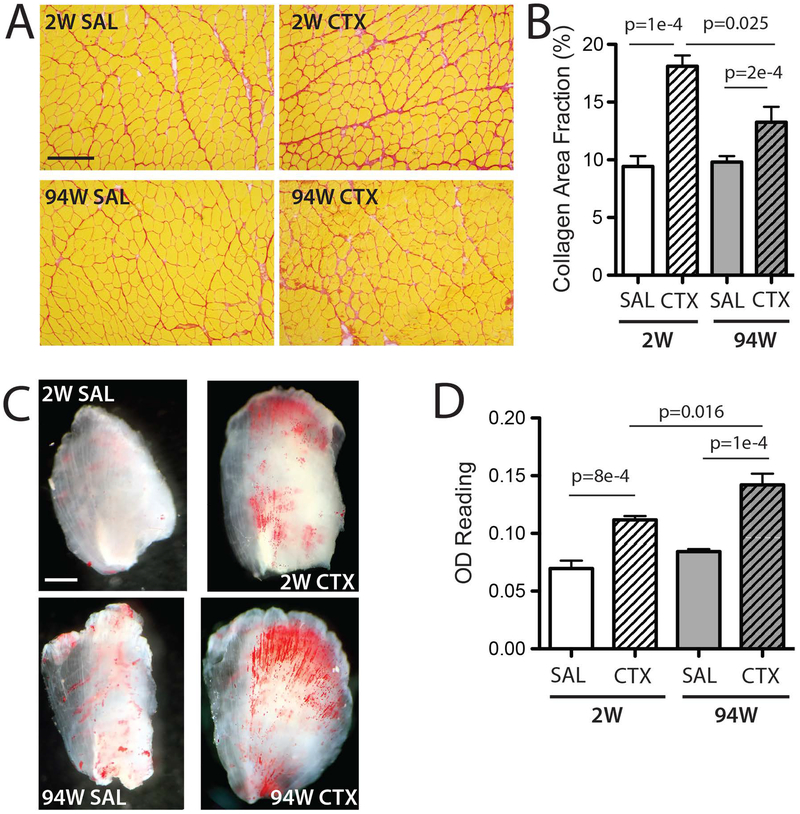
Introduction: Efficient repositioning of centralized nuclei after injury has long been assumed, with centralized nuclei frequently cited as indicators of ongoing regeneration. However, reports of centralized nuclei that persist after full recovery of fiber area and muscle force production call into question the time course of nuclear repositioning.
Methods: We evaluated regeneration after cardiotoxin-induced damage in 10-week-old mice by quantifying intracellular and extracellular pathology at 2 and 94 weeks post-injection.
Results: Centrally nucleated fibers were still prevalent at 94 weeks post-injection, representing > 25% of muscle fibers. Areas with > 90% centrally nucleated fibers could still be identified. Extra-myocellular indicators of regeneration (e.g., fibrosis and fatty infiltration) also remained significantly elevated at the 94-week time-point.
Discussion: These findings indicate that not all nuclei are repositioned at the conclusion of induced muscle regeneration. Muscle Nerve 58:858-862, 2018.
Keywords: cardiotoxin; centralized nuclei; fatty infiltration; nuclear positioning; regeneration.
© 2018 Wiley Periodicals, Inc.
Conflict of interest statement
Figures
Similar articles
-
Comparative study of muscle regeneration following cardiotoxin and glycerol injury.Ann Anat. 2015 Nov;202:18-27. doi: 10.1016/j.aanat.2015.07.002. Epub 2015 Aug 21. Ann Anat. 2015. PMID: 26340019
-
Notexin causes greater myotoxic damage and slower functional repair in mouse skeletal muscles than bupivacaine.Muscle Nerve. 2006 Nov;34(5):577-85. doi: 10.1002/mus.20616. Muscle Nerve. 2006. PMID: 16881061
-
Abnormal Skeletal Muscle Regeneration plus Mild Alterations in Mature Fiber Type Specification in Fktn-Deficient Dystroglycanopathy Muscular Dystrophy Mice.PLoS One. 2016 Jan 11;11(1):e0147049. doi: 10.1371/journal.pone.0147049. eCollection 2016. PLoS One. 2016. PMID: 26751696 Free PMC article.
-
Rantes secreted from macrophages disturbs skeletal muscle regeneration after cardiotoxin injection in Cbl-b-deficient mice.Muscle Nerve. 2011 Feb;43(2):223-9. doi: 10.1002/mus.21829. Epub 2010 Nov 16. Muscle Nerve. 2011. PMID: 21254087
-
Skeletal Muscle Regeneration in Cardiotoxin-Induced Muscle Injury Models.Int J Mol Sci. 2022 Nov 2;23(21):13380. doi: 10.3390/ijms232113380. Int J Mol Sci. 2022. PMID: 36362166 Free PMC article. Review.
Cited by
-
APOBEC2 safeguards skeletal muscle cell fate through binding chromatin and regulating transcription of non-muscle genes during myoblast differentiation.Proc Natl Acad Sci U S A. 2024 Apr 23;121(17):e2312330121. doi: 10.1073/pnas.2312330121. Epub 2024 Apr 16. Proc Natl Acad Sci U S A. 2024. PMID: 38625936 Free PMC article.
-
Three-dimensional imaging studies in mice identify cellular dynamics of skeletal muscle regeneration.Dev Cell. 2024 Jun 3;59(11):1457-1474.e5. doi: 10.1016/j.devcel.2024.03.017. Epub 2024 Apr 2. Dev Cell. 2024. PMID: 38569550 Free PMC article.
-
Brown Fat Promotes Muscle Growth During Regeneration.J Orthop Res. 2019 Aug;37(8):1817-1826. doi: 10.1002/jor.24324. Epub 2019 May 17. J Orthop Res. 2019. PMID: 31042310 Free PMC article.
-
Lifelong Outcomes of Systemic Adeno-Associated Virus Micro-Dystrophin Gene Therapy in a Murine Duchenne Muscular Dystrophy Model.Hum Gene Ther. 2023 May;34(9-10):449-458. doi: 10.1089/hum.2022.181. Epub 2023 May 2. Hum Gene Ther. 2023. PMID: 36515166 Free PMC article.
-
Calorie restriction and rapamycin distinctly restore non-canonical ORF translation in the muscles of aging mice.NPJ Regen Med. 2024 Sep 19;9(1):23. doi: 10.1038/s41536-024-00369-9. NPJ Regen Med. 2024. PMID: 39300171 Free PMC article.
References
-
- Clark WE An experimental study of the regeneration of mammalian striped muscle. J. Anat 80, 24–36.4 (1946). - PubMed
-
- Spiro AJ, Shy GM & Gonatas NK Myotubular myopathy. Persistence of fetal muscle in an adolescent boy. Arch. Neurol 14, 1–14 (1966). - PubMed
-
- Schmalbruch H The morphology of regeneration of skeletal muscles in the rat. Tissue Cell 8, 673–692 (1976). - PubMed
-
- Carlson BM The regeneration of skeletal muscle. A review. Am. J. Anat 137, 119–149 (1973). - PubMed
Publication types
MeSH terms
Substances
Grants and funding
LinkOut - more resources
Full Text Sources
Other Literature Sources
Miscellaneous
