. 2018 Nov;48(11):1861-1871.
doi: 10.1002/eji.201847623. Epub 2018 Sep 25.

The macrophage migration inhibitory factor pathway in human B cells is tightly controlled and dysregulated in multiple sclerosis

Affiliations

The macrophage migration inhibitory factor pathway in human B cells is tightly controlled and dysregulated in multiple sclerosis

Liza Rijvers et al. Eur J Immunol. 2018 Nov.

Abstract

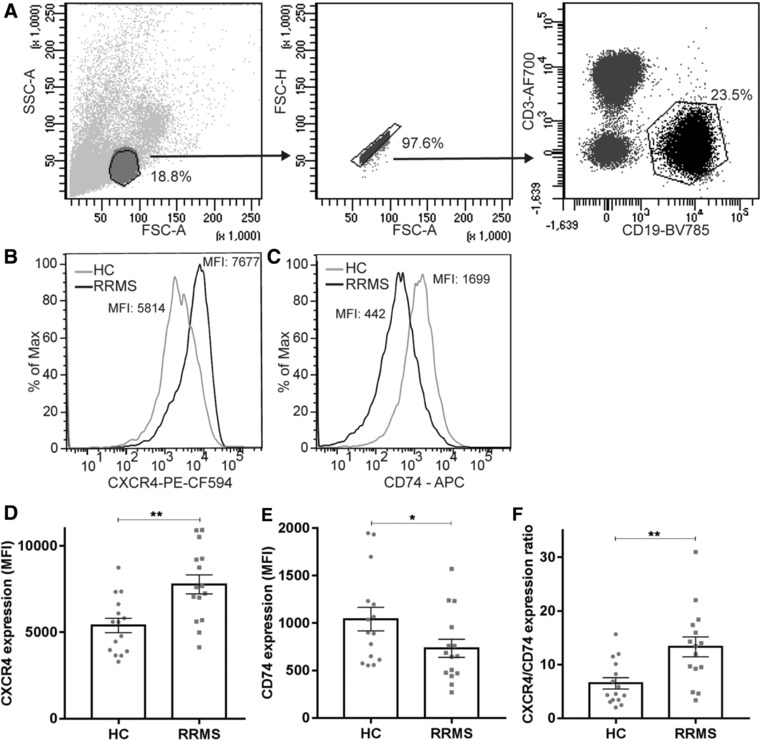
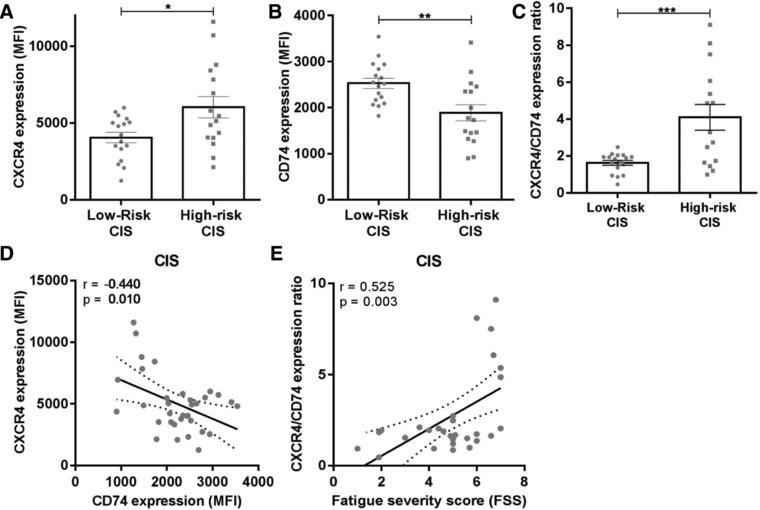
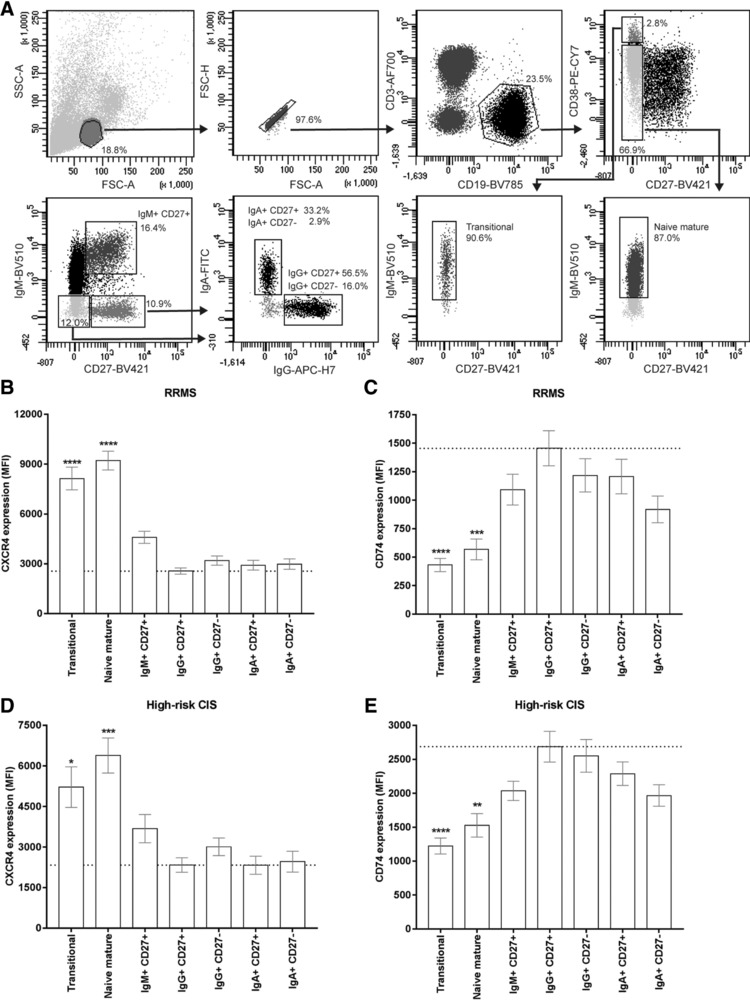
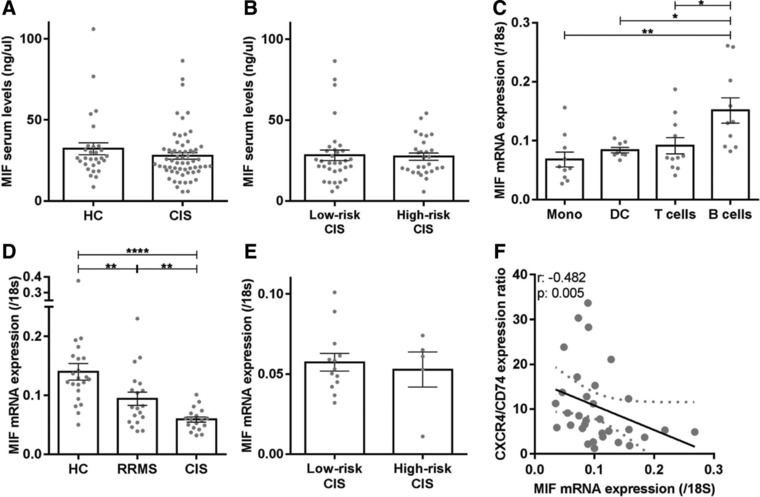
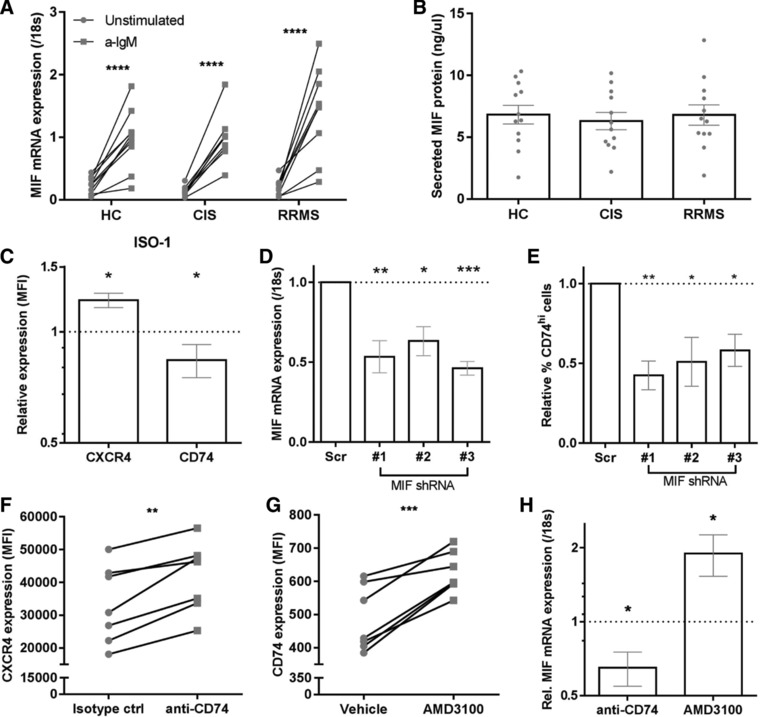
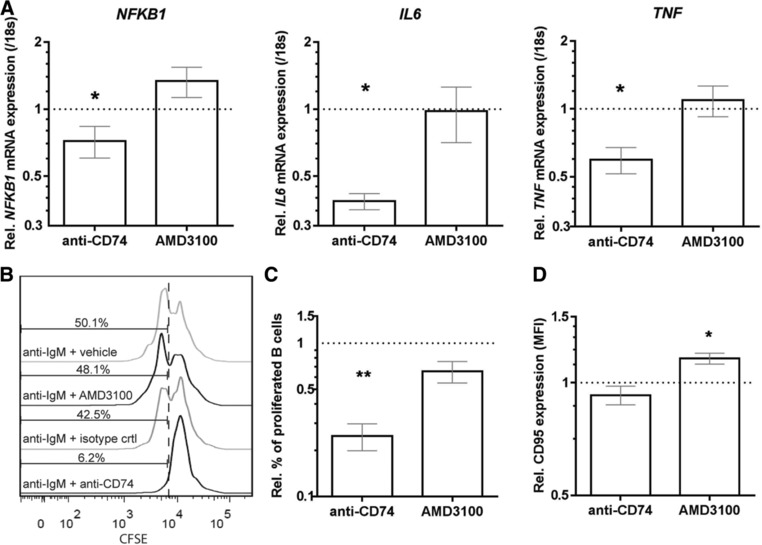
In MS, B cells survive peripheral tolerance checkpoints to mediate local inflammation, but the underlying molecular mechanisms are relatively underexplored. In mice, the MIF pathway controls B-cell development and the induction of EAE. Here, we found that MIF and MIF receptor CD74 are downregulated, while MIF receptor CXCR4 is upregulated in B cells from early onset MS patients. B cells were identified as the main immune subset in blood expressing MIF. Blocking of MIF and CD74 signaling in B cells triggered CXCR4 expression, and vice versa, with separate effects on their proinflammatory activity, proliferation, and sensitivity to Fas-mediated apoptosis. This study reveals a new reciprocal negative regulation loop between CD74 and CXCR4 in human B cells. The disturbance of this loop during MS onset provides further insights into how pathogenic B cells survive peripheral tolerance checkpoints to mediate disease activity in MS.

Keywords: Autoimmune disease; B-cell biology; Clinically isolated syndrome; MIF receptors CXCR4/CD74; MS.


Figures

Figure 1
Figure 1
CXCR4 upregulation and CD74 downregulation on B cells of clinically definite MS patients. (A) Gating strategy for CD19+ B cells. (B and C) representative histograms of CXCR4 (B) and CD74 (C) expression levels in HC and RRMS. (D–F) Expression of MIF receptors CXCR4 (D) and CD74 (E) and their ratios (F) on blood B cells from 15 RRMS patients and 15 age‐ and gender‐matched healthy controls (HC) as determined by FACS. Data were measured in three individual experiments, with 5 HC and 5 RRMS patients per experiment. Data are shown as mean ± SEM. Unpaired t‐tests were used to compare groups. *p < 0.05, **p < 0.01.
Figure 2
Figure 2
High CXCR4/CD74 expression ratios on B cells of CIS patients associate with rapid MS diagnosis. Expression of MIF receptors CXCR4 and CD74 and their ratios on blood B cells of 17 low‐risk CIS and 16 high‐risk CIS patients (A–C), as determined by FACS. Gating on CD19+ B cells is depicted in Fig. 1. Data were measured in nine individual experiments, with 1–2 low‐risk CIS and 1–2 high‐risk CIS patients were measured per experiment. Data are shown as mean ± SEM. Unpaired t‐tests were used to compare groups. (D) Correlation between CXCR4 and CD74 expression on B cells in CIS patients (n = 33). (E) Correlation between CXCR4/CD74 surface expression ratios on B cells and fatigue severity scores (FSS) for CIS patients (n = 30). r = Pearson's correlation coefficient (D) or Spearman correlation (E). *p < 0.05, **p < 0.01, ***p < 0.001.
Figure 3
Figure 3
The CXCR4hiCD74lo phenotype of B cells in early MS blood is linked to transitional and naive mature populations. (A) Used gating strategy for the different blood B‐cell subsets analyzed in B–E: transitional (IgM+CD27CD38hiCD24hi), naive mature (IgM+CD27CD38−/dim), IgM+CD27+ (nonclass‐switched memory), IgG+CD27+, IgG+CD27, IgA+CD27+, and IgA+CD27 B cells. Blood from RRMS (B, C; n = 15) and high‐risk CIS (D, E; n = 16) patients was used to assess CXCR4 (B, D) and CD74 (C, E) expression on these subsets. For RRMS patients, the data were measured in three individual experiments with five RRMS patients per experiment. For high‐risk CIS patients, data were measured in nine individual experiments with 1–2 patients per experiment. The expression level on each subset was compared to that of IgG+CD27+ memory B cells. Data are shown as mean ± SEM. Kruskal–Wallis test with Dunn's correction for multiple comparison was used to compare groups. *p < 0.05, **p < 0.01, ***p < 0.001, ****p < 0.0001.
Figure 4
Figure 4
Serum MIF levels are not different, while the predominant MIF expression in B cells is reduced in CIS and RRMS patients. MIF serum levels (ng/μL) were compared between CIS patients (n = 61) and HC (n = 29; (A), as well as between low‐risk CIS (n = 33) and high‐risk CIS (n = 28) subgroups (B) using ELISA. Data are measured in one single experiment. Each dot represents the mean value of one individual, measured in duplicates. (C) Monocytes (n = 10), dendritic cells (n = 8), T cells (n = 11), and B cells (n = 10) were sorted from healthy blood and assessed for MIF mRNA expression relative to those of 18S mRNA using qPCR. Data were collected in four independent experiments with 2–4 donors per experiment. Similar analyses were performed for blood B cells from CIS patients (n = 18), RRMS patients (n = 19), and HC (D; n = 22), as well as low‐risk CIS (n = 13) and high‐risk CIS (n = 5) groups (E). B cells of CIS patients were sorted in nine independent experiments with 2–4 patients per experiment. B cells of HC and RRMS patients were sorted in 17 independent experiments, with 1–2 HC and 1–2 RRMS patients per experiment. MIF and 18S mRNA expression was measured in six individual experiments, with two independent experiments per patient group. Data are shown as mean ± SEM. Each dot represents the mean value of one individual, measured in duplicates. Student's t‐tests were used to compare groups. (F) Correlation between MIF mRNA levels and CXCR4/CD74 surface expression ratios in B cells from patients and healthy controls (n = 30). B cells were sorted, mRNA was measured in duplicates, and surface expression was analyzed in six independent experiments with 2 HC and 2–4 patients per experiment. r = Spearman's correlation; *p < 0.05, **p < 0.01, ****p < 0.0001.
Figure 5
Figure 5
Interference with MIF signaling pathways reveals mutual regulation of CD74, CXCR4, and MIF expression in in vitro‐activated B cells. B cells sorted from CIS, RRMS, and HC blood (n = 9–12 per group) were activated in vitro for 24 h using anti‐IgM and analyzed for MIF expression (A; qPCR) and secretion into culture media (B; ELISA). Stimulations have been done in three individual experiments with 3–4 patients per group per experiment. Each dot represents the mean value of one individual, measured in duplicates. (C) In vitro‐activated B cells from healthy blood were treated with and without MIF inhibitor ISO‐1 for 24 h and assessed for CXCR4 and CD74 surface expression using FACS (n = 6). Stimulations have been done in three individual experiments with two controls per group per experiment. (D, E) The human B‐cell line Raji (CD74hi) was transfected with three distinct MIF shRNA constructs and compared with scrambled controls for MIF mRNA levels (D) and the percentage of CD74hi cells (E) at day 3 (n = 5). Data were measured in five individual experiments with one set of scrambled and three different shRNA's per experiment. In vitro‐activated B cells were also evaluated for CXCR4 (F, n = 7), CD74 (G, n = 7) and MIF mRNA (H, n = 5–6, measured in duplicates) expression after 24 h treatment with anti‐CD74 (LN2) or isotype antibody (F, H) and CXCR4 antagonist AMD3100 (G, H). Stimulations have been done in three individual experiments with 2–3 controls per group per experiment. All used controls were set at 1 (dotted line). Data are shown as mean ± SEM. Paired t‐tests were performed to compare groups. *p < 0.05, **p < 0.01, ***p < 0.001.
Figure 6
Figure 6
CD74 and CXCR4 on human B cells differentially control proinflammatory gene expression, proliferation, and sensitivity to Fas‐mediated apoptosis. B cells from healthy blood were in vitro‐activated with a‐IgM and subsequently treated with anti‐CD74 antibody (LN2) or AMD3100. Data were compared to their respective controls for relative NF‐κB, IL‐6, and TNF‐α mRNA expression after 24 h using qPCR (A, n = 4–6, measured in duplicates), as well as CFSE‐based proliferation (B and C, n = 5) and Fas (CD95) surface levels (D, n = 5) after 3 days using FACS. Stimulations have been done in three individual experiments with two controls per group per experiment. All used controls were set at 1 (dotted line). Data are shown as mean ± SEM. Paired t‐tests were performed to compare groups. *p < 0.05, **p < 0.01.

References

    1. Nylander, A. and Hafler, D. A. , Multiple sclerosis. J. Clin. Invest. 2012. 122: 1180–1188. - PMC - PubMed
    1. Hauser, S. L. , Waubant, E. , Arnold, D. L. , Vollmer, T. , Antel, J. , Fox, R. J. , Bar‐Or, A. et al., B‐cell depletion with rituximab in relapsing‐remitting multiple sclerosis. N. Engl. J. Med. 2008. 358: 676–688. - PubMed
    1. Kinnunen, T. , Chamberlain, N. , Morbach, H. , Cantaert, T. , Lynch, M. , Preston‐Hurlburt, P. , Herold, K. C. et al., Specific peripheral B cell tolerance defects in patients with multiple sclerosis. J. Clin. Invest. 2013. 123: 2737–2741. - PMC - PubMed
    1. Calandra, T. and Roger, T. , Macrophage migration inhibitory factor: a regulator of innate immunity. Nat. Rev. Immunol. 2003. 3: 791–800. - PMC - PubMed
    1. Baker, D. , O'Neill, J. K. and Turk, J. L. , Cytokines in the central nervous system of mice during chronic relapsing experimental allergic encephalomyelitis. Cell. Immunol. 1991. 134: 505–510. - PubMed

Publication types

MeSH terms

Substances