. 2018 Nov 1;315(5):G810-G823.
doi: 10.1152/ajpgi.00238.2018. Epub 2018 Aug 30.

Intestinal bile acid sequestration improves glucose control by stimulating hepatic miR-182-5p in type 2 diabetes

Affiliations

Intestinal bile acid sequestration improves glucose control by stimulating hepatic miR-182-5p in type 2 diabetes

Leslie R Sedgeman et al. Am J Physiol Gastrointest Liver Physiol. .

Abstract

Colesevelam is a bile acid sequestrant approved to treat both hyperlipidemia and type 2 diabetes, but the mechanism for its glucose-lowering effects is not fully understood. The aim of this study was to investigate the role of hepatic microRNAs (miRNAs) as regulators of metabolic disease and to investigate the link between the cholesterol and glucose-lowering effects of colesevelam. To quantify the impact of colesevelam treatment in rodent models of diabetes, metabolic studies were performed in Zucker diabetic fatty (ZDF) rats and db/db mice. Colesevelam treatments significantly decreased plasma glucose levels and increased glycolysis in the absence of changes to insulin levels in ZDF rats and db/db mice. High-throughput sequencing and real-time PCR were used to quantify hepatic miRNA and mRNA changes, and the cholesterol-sensitive miR-96/182/183 cluster was found to be significantly increased in livers from ZDF rats treated with colesevelam compared with vehicle controls. Inhibition of miR-182 in vivo attenuated colesevelam-mediated improvements to glycemic control in db/db mice. Hepatic expression of mediator complex subunit 1 (MED1), a nuclear receptor coactivator, was significantly decreased with colesevelam treatments in db/db mice, and MED1 was experimentally validated to be a direct target of miR-96/182/183 in humans and mice. In summary, these results support that colesevelam likely improves glycemic control through hepatic miR-182-5p, a mechanism that directly links cholesterol and glucose metabolism. NEW & NOTEWORTHY Colesevelam lowers systemic glucose levels in Zucker diabetic fatty rats and db/db mice and increases hepatic levels of the sterol response element binding protein 2-responsive microRNA cluster miR-96/182/183. Inhibition of miR-182 in vivo reverses the glucose-lowering effects of colesevelam in db/db mice. Mediator complex subunit 1 (MED1) is a novel, direct target of the miR-96/182/183 cluster in mice and humans.

Keywords: bile acid sequestrants; cholesterol; glucose metabolism; microRNAs; sterol-regulatory element binding protein 2.


Conflict of interest statement

No conflicts of interest, financial or otherwise, are declared by the authors.

Figures

Fig. 1.
Fig. 1.
Colesevelam (Col) treatment improves glucose tolerance in Zucker diabetic fatty (ZDF) rats. A: morning glucose levels in ZDF rats treated with vehicle or 2% colesevelam-supplemented diet; n = 24. B: fasting glucose in portal blood after 12-h fast; n = 22–23. C: hemoglobin A1c levels; n = 24. D: food intake of ZDF rats treated with vehicle or 2% colesevelam supplemented diet; n = 12. E: body weights; n = 24. F: plasma glucose levels after intraperitoneal glucose challenge; n = 12. G: area under the curve (AUC) of glucose tolerance tests; n = 12. H: total glucose disposal via glycolytic pathway following glucose disposal tests; n = 12. I: insulin levels during glucose tolerance test; n = 12. J: 12-h fasting insulin levels; n = 24. For comparisons between 2 groups, Mann-Whitney nonparametric tests were used, and for repeated measures across time, two-way ANOVAs with Bonferonni’s posttests were used.
Fig. 2.
Fig. 2.
Colesevelam (Col) alters hepatic lipid metabolism but has modest effects on incretins. A: levels of glucagon like peptide-1 (GLP-1) in portal blood from overnight-fasted animals; n = 24. B: levels of gastric inhibitory peptide (GIP) in portal blood from overnight-fasted animals; n = 24. C: plasma GIP levels after intraperitena glucose challenge; n = 12. D: percentage of new islets by 5-bromo-2'-deoxyuridine labeling; n = 12. E: homeostatic model assessment (HOMA) method for assessing insulin resistance from basal (fasting) glucose and insulin concentrations; n = 22–24 F: homeostatic model assessment (HOMA) method for assessing insulin β-cell function from basal (fasting) glucose and C-peptide concentrations; n = 22–23. G: percent de novo cholesterol synthesis over 4 wk; n = 6. H: de novo lipogenesis, percent new triglyceride-palmitate after 4 wk of labeling; n = 6. For comparisons between 2 groups, Mann-Whitney nonparametric tests were used, and for repeated measures across time, two-way ANOVAs with Bonferonni’s posttests were used.
Fig. 3.
Fig. 3.
The microRNA (miR)-96/182/183 cluster is upregulated in the livers of colesevelam-treated Zucker diabetic fatty (ZDF) rats. A: volcano plot depicting significantly altered miRNAs between colesevelam (Col) and vehicle-treated ZDF rat livers (left) and expression (reads per million total reads) of the miR-96/182/183 cluster (left); n = 6. B–D: liver expression of the miR-96/182/183 cluster by real-time PCR; n = 9–12. E: liver gene (mRNA) expression changes of Srebf2 and its target genes Hmgcr, Ldlr, and Sqle; n = 8–12. For sequencing data, unpaired t-tests were used. For comparisons between 2 groups, Mann-Whitney nonparametric tests were used; n.d., not detectable.
Fig. 4.
Fig. 4.
Colesevelam (Col) stimulates the microRNA miR-96/182/183 cluster in livers of db/db mice and is inhibited with locked-nucleic acid (LNA)-182 treatment. A: schematic of animal study. Twelve-week-old db/db mice treated with vehicle or 2% colesevelam-supplemented diet for 9 wk. GTT, glucose tolerance test; ITT, insulin tolerance test. B: liver expression of miR-96/182/183 cluster miRNAs; n = 8–9. C: liver gene (mRNA) expression changes for SREBP2 target genes Hmgcr, Ldlr, Sqle, and Srebf2; n = 8–9. Actb, β-actin. D: white adipose tissue (WAT) miRNA expression of miR-182/183/96 cluster; n = 8–9. For comparisons among 3 groups, Kruskal-Wallis one-way ANOVA with Dunn’s posttest was used; α = 0.05.
Fig. 5.
Fig. 5.
Inhibition of microRNA (miR)-182 in vivo abrogates the early improvements in glucose tolerance conferred by colesevelam in db/db mice. A: 4-h fasted glucose levels in Chow + PBS-, Col + PBS-, and Col + locked-nucleic acid (LNA)-treated db/db mice; n = 7–9. B: body weight of db/db mice; n = 8–9. C: plasma glucose levels after intraperitoneal glucose challenge at wk 4 of study; n = 9. D: area under the curve (AUC) of glucose tolerance test at wk 4; n = 9. E: plasma glucose levels after intraperitoneal glucose challenge at wk 4 of study; n = 9. F: area under the curve of glucose tolerance test at wk 4; n = 9. G: plasma insulin levels after 4-h fast and 15 min postglucose bolus at wk 5 of study; n = 9. H: plasma gastric inhibitory peptide (GIP) levels after 4-h fast and 15 min postglucose bolus at wk 5 of study. n = 6–7. For comparisons among 3 groups, Kruskal-Wallis one-way ANOVA with Dunn’s posttest was used (α = 0.05); or two-way ANOVA with Bonferonni’s posttest for repeated measures across time was used. *P < 0.05, Chow + PBS vs. Col + PBS; #P < 0.05, Chow + PBS vs. Col + LNA; $P < 0.05, Col + PBS vs. Col + LNA.
Fig. 6.
Fig. 6.
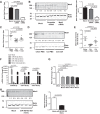
Mediator complex subunit 1 (Med1) is regulated by microRNA (miR)-96/182/183 in mice. A: expression of Med1 by real-time PCR in mouse primary hepatocytes transfected with 50 nM of Med1 or scramble siRNA; n = 3 B: Western blot of Med1 and β-actin (loading control) from protein samples of primary hepatocytes transfected with Med1 or scramble siRNA. Ratio of Med1/β-actin densitometry is indicated between the blots and graphed on the right; n = 3. A.U., arbitrary units. C: hepatic Med1 mRNA levels in db/db mice treated with vehicle or 2% colesevelam (Col)-supplemented diet and PBS or locked-nucleic acid (LNA)-182-5p; real-time PCR; n = 8–9. D: hepatic Med1 and β-actin (loading control) protein levels from 3 representative liver protein samples for Chow + PBS, Col + PBS, and Col + LNA-182. Western blotting. Ratio of Med1/β-actin densitometry is indicated between the blots. E: densitometry quantification of Med1 protein levels normalized to β-actin; n = 8–9. F: expression of miR-96-5p, miR-182-5p, and miR-183-5p in mouse primary hepatocytes transfected with 50 nM miR-96-5p, miR-182-5p, miR-183-5p mimics individually or in combination; real-time PCR; n = 3. G: Med1 mRNA levels in mouse primary hepatocytes transfected with 50 nM miR-96-5p, miR-182-5p, and miR-183-5p mimics individually or in combination; real-time PCR; n = 3. H: protein levels of Med1 and β-actin (loading control) from protein samples of primary hepatocytes transfected with mock or 50 nM miR-96-5p, miR-182-5p, and miR-183-5p mimics individually or in combination. Ratio of Med1/β-actin densitometry is indicated between the blots and graphed on the right; n = 3. For comparisons between 2 groups, Students’ t-tests were used, and for more than 2 groups, Kruskal-Wallis one-way ANOVA with Dunn’s posttest was used (α = 0.05) or one-way ANOVA with Bonferonni’s posttest for comparison to mock group only was used (α = 0.05).
Fig. 7.
Fig. 7.
Mediator complex subunit 1 (MED1) is a direct target of microRNA (miR)-182-5p, miR-183-5p, and miR-96-5p in humans. A: schematic of human MED1 mRNA and the 3 putative miR-182/183/96 target sites in the 3′-untranslated region (3′-UTR). B: predicted MED1 3′-UTR target sites. Bases highlighted in dark gray represent mutations for gene reporter (luciferase) assays. C: normalized luciferase activity in HEK293 cells after dual transfection of miR-96/182/183 mimics and gene (luciferase) reporters harboring putative target sites for miR-96-5p, miR-182-5p, and/or miR-183-5p; n = 4. D: miR-96-5p, miR-182-5p, and miR-183-5p levels in Huh7 cells transfected with 50 nM miR-96-5p, miR-182-5p, and miR-183-5p mimics individually or in combination; real-time PCR; n = 6. E: MED1 mRNA levels in Huh7 cells transfected with 50 nM miR-96-5p, miR-182-5p, and miR-183-5p mimics individually or in combination; real-time PCR; n = 6. F: miR-96-5p, miR-182-5p, and miR-183-5p levels in Huh7 cells transfected with mock or 50 nM locked-nucleic acids (LNAs) against miR-182-5p and/or miR-183-5p; real-time PCR; n = 6. G: MED1 mRNA levels in Huh7 cells transfected mock or 50 nM LNAs against miR-182-5p and/or miR-183-5p; real-time PCR; n = 6. H: protein levels of Med1 and β-actin (loading control) from protein lysates of Huh7 cells transfected with mock or 50 nM miR-96, miR-182, and miR-183 LNAs. Ratio of Med1/β-actin densitometry is indicated between the blots and graphed on the right; n = 6. A.U. arbitrary units. For comparisons between more than 2 groups to mock only, one-way ANOVA with Bonferonni’s posttest was used, α = 0.05. For comparisons between 2 groups, Mann-Whitney nonparametric tests were used.

Similar articles

Cited by

References

    1. Aiman U, Najmi A, Khan RA. Statin induced diabetes and its clinical implications. J Pharmacol Pharmacother 5: 181–185, 2014. doi:10.4103/0976-500X.136097. - DOI - PMC - PubMed
    1. Allen RM, Zhao S, Ramirez Solano MA, Zhu W, Michell DL, Wang Y, Shyr Y, Sethupathy P, Linton MF, Graf GA, Sheng Q, Vickers KC. Bioinformatic analysis of endogenous and exogenous small RNAs on lipoproteins. J Extracell Vesicles 7: 1506198, 2018. doi:10.1080/20013078.2018.1506198. - DOI - PMC - PubMed
    1. Bai L, Jia Y, Viswakarma N, Huang J, Vluggens A, Wolins NE, Jafari N, Rao MS, Borensztajn J, Yang G, Reddy JK. Transcription coactivator mediator subunit MED1 is required for the development of fatty liver in the mouse. Hepatology 53: 1164–1174, 2011. doi:10.1002/hep.24155. - DOI - PMC - PubMed
    1. Bartel DP. MicroRNAs: target recognition and regulatory functions. Cell 136: 215–233, 2009. doi:10.1016/j.cell.2009.01.002. - DOI - PMC - PubMed
    1. Bays HE, Goldberg RB, Truitt KE, Jones MR. Colesevelam hydrochloride therapy in patients with type 2 diabetes mellitus treated with metformin: glucose and lipid effects. Arch Intern Med 168: 1975–1983, 2008. doi:10.1001/archinte.168.18.1975. - DOI - PubMed

Publication types

MeSH terms