Comparative Study
. 2018 Nov 1;125(5):1563-1575.
doi: 10.1152/japplphysiol.00980.2017. Epub 2018 Aug 30.

Noninvasive allergic sinus congestion and resolution assessments using microcomputed tomography imaging

Affiliations
Comparative Study

Noninvasive allergic sinus congestion and resolution assessments using microcomputed tomography imaging

Julia Litvinov et al. J Appl Physiol (1985). .

Abstract

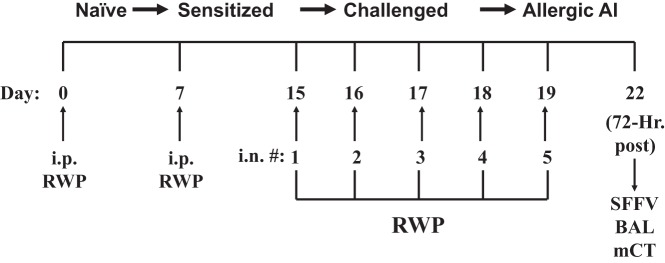
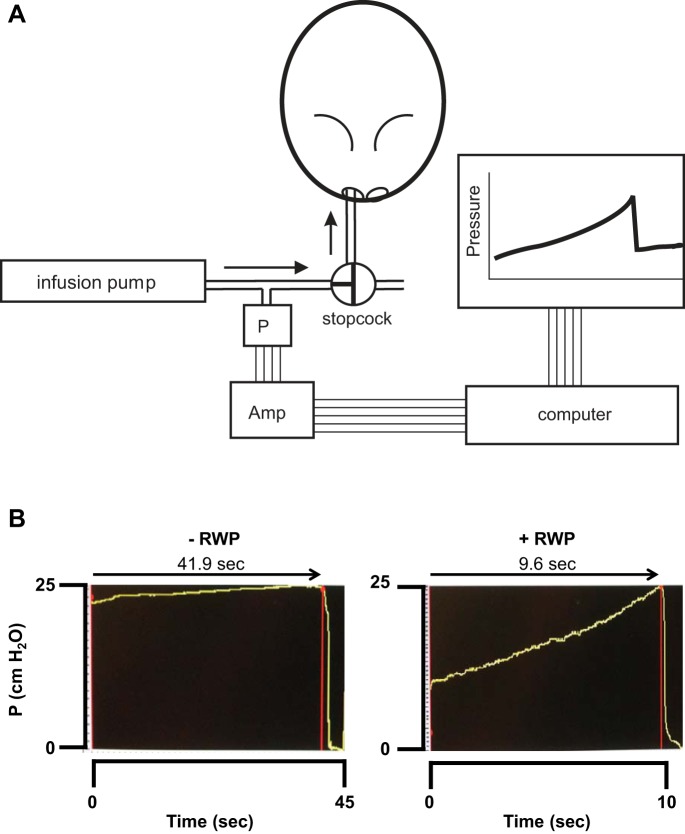
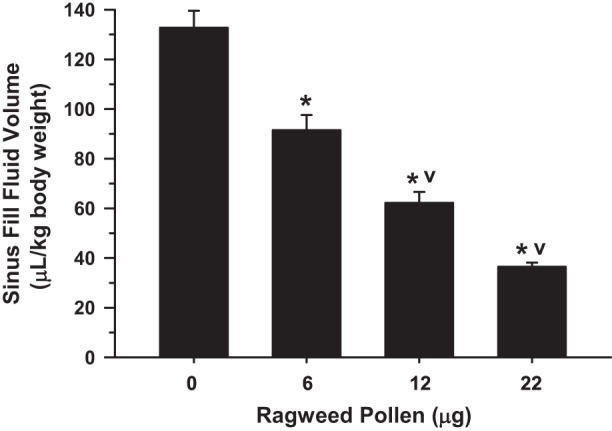
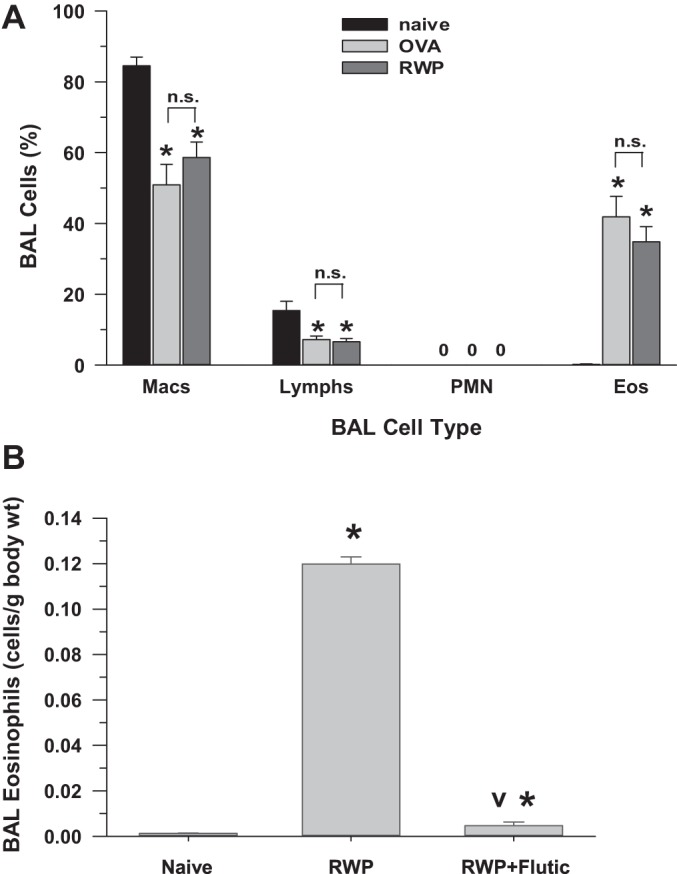
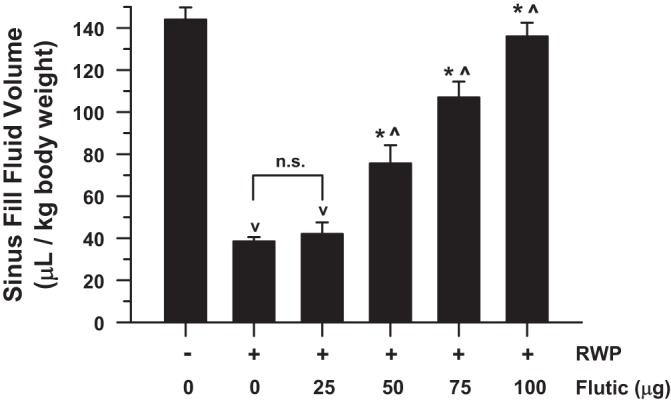
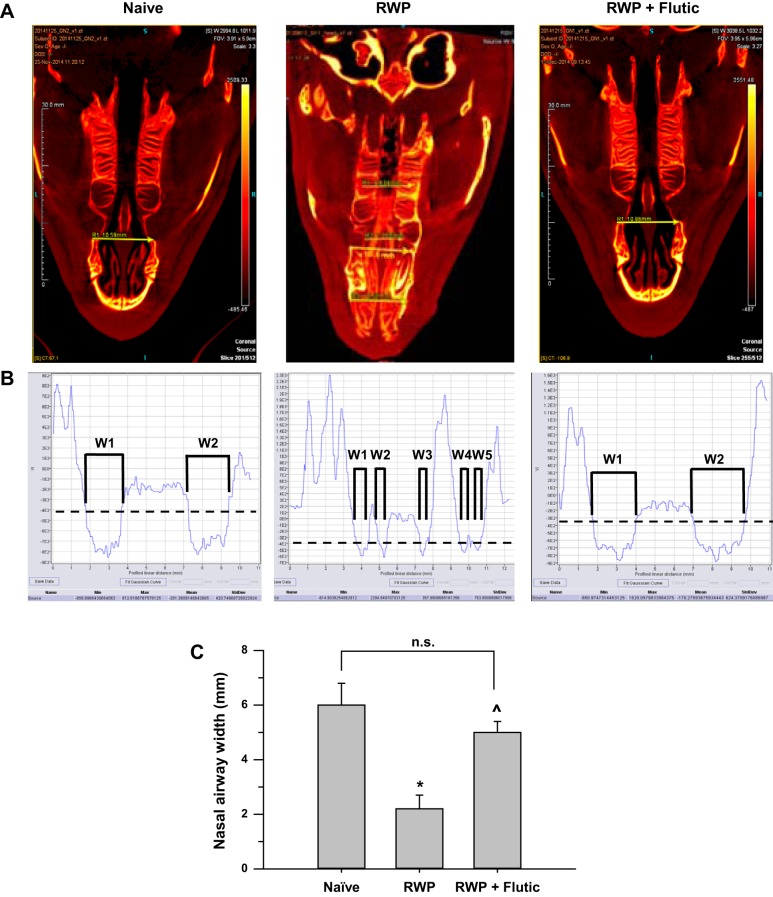
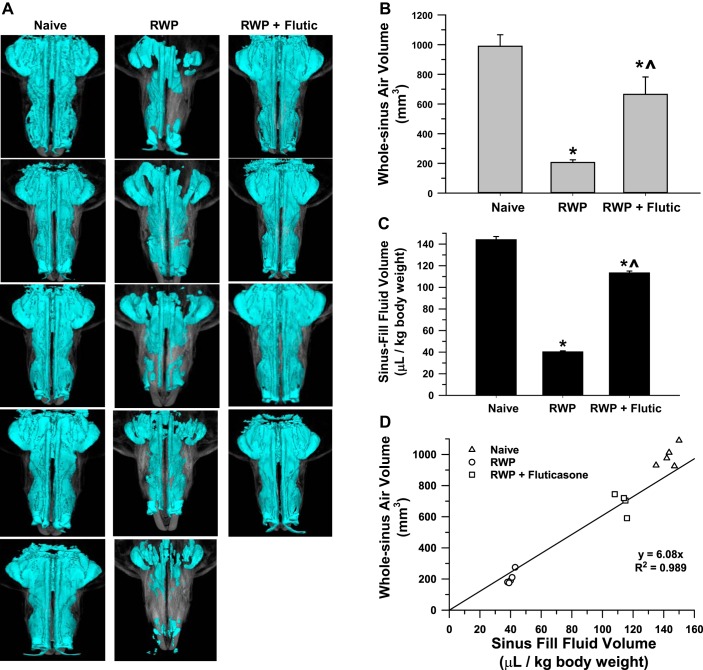
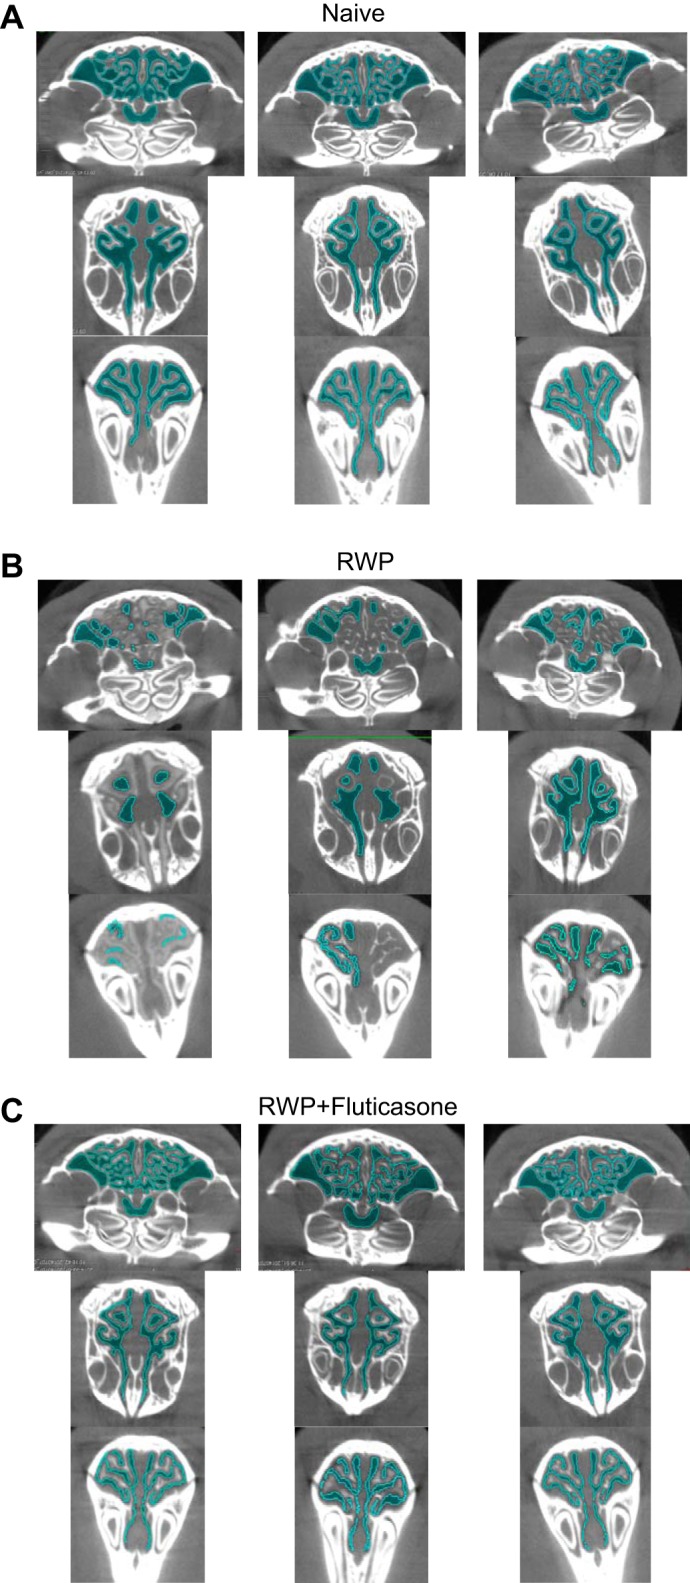
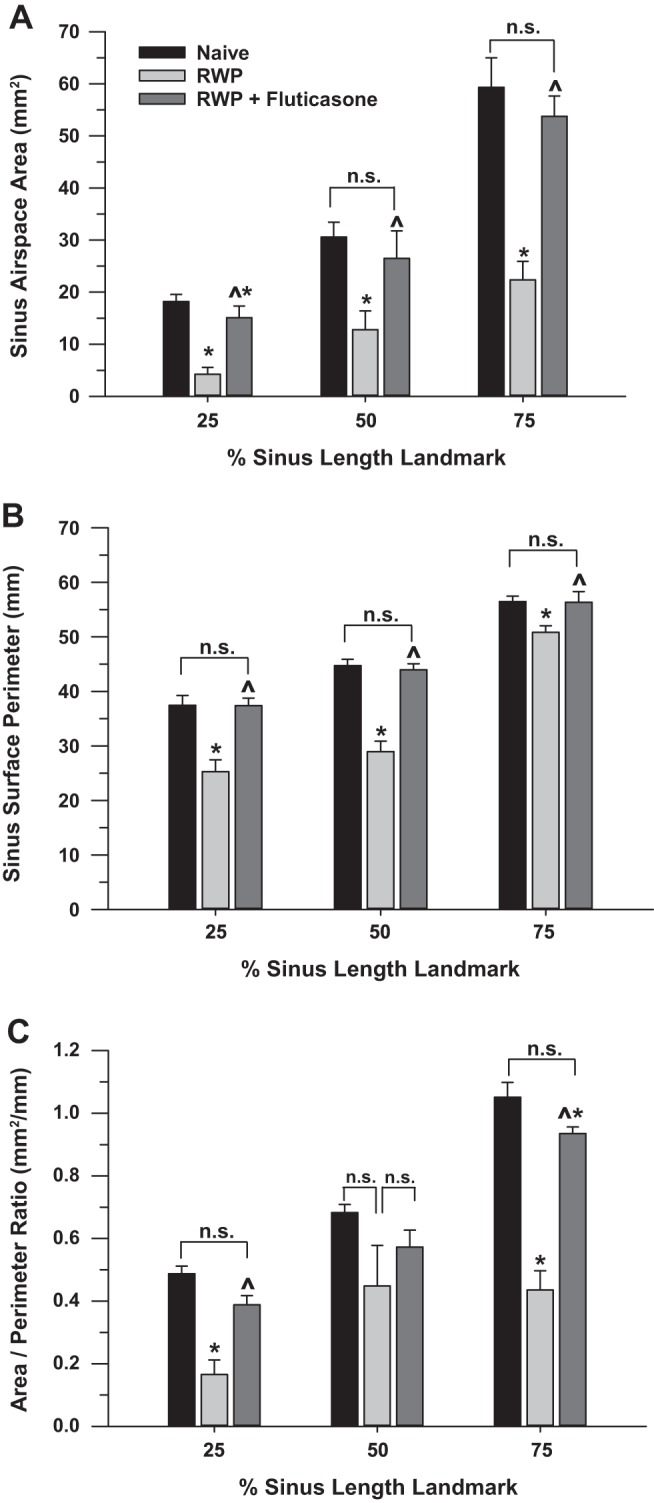
Sinus congestion resultant of allergic rhinosinusitis is associated with development and worsening of asthma and can result in difficulty breathing, headaches, and missed days of school and work. Quantification of sinus congestion is important in the understanding of allergic rhinosinusitis and the development of new drugs for its treatment. Noninvasive microcomputed tomography (micro-CT) was investigated in a guinea pig model of allergic rhinosinusitis to determine its utility to determine accurately the degree of sinus congestion and resolution with anti-inflammatory drug administration. Three-dimensional sinus air-space volume, two-dimensional sinus width, sinus image air-space area, and sinus image sinus perimeter were measured in guinea pigs administered ragweed pollen (RWP), intranasally (i.n.), followed by administration of fluticasone, i.n. To determine their relative accuracy in assessing sinus congestion, the micro-CT image results were compared with the "gold-standard" method of sinus fluid fill-volume (SFFV) measurements. As measured by SFFV method, RWP increased sinus congestion in a RWP concentration-dependent fashion, approaching near-total sinus blockage with concentrations ≥22 µg of RWP. At this level of congestion, fluticasone (25-100 µg) progressively decreased sinus congestion in a concentration-dependent fashion. The noninvasive micro-CT methods were found to accurately determine the amount of sinus congestion and resolution, with patterns of increases and decreases of congestion that were nearly identical to the SFFV method. We conclude that noninvasive micro-CT measurements of allergic sinus congestion can be useful as an investigative tool in the assessment of congestion intensity and the development of new drug therapies for its treatment. NEW & NOTEWORTHY Allergic rhinosinusitis afflicts significant portions of the world population, resulting in loss of work productivity and decreased quality of life. Thus the development of methodological approaches, which incorporate accurate and reproducible noninvasive assessments of sinus congestion, are desirable. Microcomputed tomography of the guinea pig sinuses offers a noninvasive evaluation tool in an animal model of IgE-dependent allergy similar to that in humans, with potential relevance toward development of therapeutics for human sinus diseases.

Keywords: allergic sinus inflammation; guinea pig; micro-CT; ragweed pollen; rhinosinusitis.


Conflict of interest statement

W. C. Spear and B. T. Ameredes received grant funding from Alcon Research, Ltd. and the Forest Research Institute in support of a portion of this work.

Figures

Fig. 1.
Fig. 1.
Allergy induction protocol used to induce allergic rhinosinusitis in guinea pigs with intranasal (i.n.) ragweed pollen (RWP) administration, progressing toward allergic airway inflammation (AI). Guinea pigs progressed toward allergic rhinosinusitis through initial systemic injections of RWP (intraperitoneal) followed by i.n. application of RWP over a 5-day period. In fluticasone-treated groups, the i.n. application of RWP occurred in the early morning, and the fluticasone treatment was applied i.n. in the late afternoon of each day. Bronchoalveolar lavage (BAL), sinus fluid fill-volume (SFFV), and microcomputed tomography (mCT) measurements were taken subsequently 72 h after the last i.n. RWP administration. #, Number.
Fig. 2.
Fig. 2.
A: schematic of sinus fluid fill-volume measurement setup, incorporating constant-flow infusion pump delivering perfluorocarbon liquid directly into nasal sinuses of guinea pig, with pressure transducer in delivery line to monitor pressure development and release, with achievement of sinus filling. Amp, direct current (DC) amplifier feeding DC pressure signal to personal computer from pressure transducer (P) via analog-to-digital conversion board, with digital readout from data display and acquisition program, shown on computer monitor. B: screenshots of typical pressure tracings recorded during the sinus fluid fill-volume experiments. Left: tracing of pressure development and release in guinea pig with no administration of ragweed pollen (RWP); elapsed time of pressure development was ~42 s, indicating a long duration of sinus filling, consistent with a high volume in uncongested sinuses. Right: tracing of pressure development and release in guinea pig treated with intranasal (i.n.) administration of RWP; elapsed time of pressure development was <10 s, indicating a brief duration of sinus filling, consistent with a low volume in congested sinuses. Note the difference in time scale at the bottom of each tracing.
Fig. 3.
Fig. 3.
Sinus fluid fill-volume (SFFV) of guinea pigs with increasing intranasal ragweed pollen (RWP) administration. SFFV decreased maximally to an average of ~25%, indicating an increase in sinus congestion of nearly 75%. Values are means ± SE. *P < 0.05 compared with control (0, no RWP); vP < 0.05 compared with next lowest RWP treatment group; n = 4 guinea pigs/bar.
Fig. 4.
Fig. 4.
A: bronchoalveolar lavage (BAL) leukocyte cell differentials in guinea pigs, either naïve (no sensitization or challenge; n = 8) or with intranasal ovalbumin (OVA; 100 mg/ml; n = 7) or intranasal ragweed pollen (RWP; 22 µg; n = 10). Eos, eosinophils; Lymphs, lymphocytes; Macs, macrophages; PMN, polymorphonuclear leukocytes. Values are means ± SE. *P < 0.05 vs. naïve. 0, No cells observed; n.s., not significant. B: total eosinophil counts in naïve (n = 5), RWP-sensitized and -challenged (n = 5), and RWP + fluticasone (Flutic)-treated (100 µg; n = 5) guinea pigs; data are from naïve and RWP-exposed guinea pigs randomly selected from combined experiments to compare with the RWP + fluticasone experiments. Values are means ± SE. *P < 0.05 vs. naïve; vP < 0.05, RWP + fluticasone vs. RWP group.
Fig. 5.
Fig. 5.
Sinus fluid fill-volume (SFFV) as a function of administered concentration of fluticasone in guinea pigs with ragweed pollen (RWP)-associated allergic sinus congestion. For comparison, far left bar indicates average SFFV values in naïve guinea pigs (no RWP or drug), which are of large magnitude, as would be expected with uncongested, untreated sinuses. Similar to Fig. 3, administration of RWP significantly decreased SFFV by ~75%, indicating significant allergic sinus congestion, compared with naïve guinea pigs. Fluticasone (Flutic) treatment significantly increased measured SFFV values in a concentration-dependent fashion, toward values similar to those observed in naïve animals. Values are means ± SE. vP < 0.05 compared with naïve group; *P < 0.05 compared with RWP alone; ^P < 0.05 compared with next lowest concentration of fluticasone. n.s., Not significant. Respective treatment group n’s for naïve (same as “0” in Fig. 3), RWP (same as 22 µg in Fig. 3), RWP + 25 µg of fluticasone, RWP + 50 µg of fluticasone, RWP + 75 µg of fluticasone, and RWP + 100 µg of fluticasone were 4, 4, 4, 5, 4, and 5.
Fig. 6.
Fig. 6.
Two-dimensional image analyses of sinuses of naïve, ragweed pollen (RWP)-treated, and RWP + fluticasone (Flutic)-treated guinea pigs quantifying cumulative linear width of nasal airway passages at a fixed bony landmark using a high-contrast coloration scheme to allow definitive identification of skull bone structures, cartilage, and air spaces (black), measuring across the linear yellow arrow for image densities of −200 Hounsfield units (HU) for soft tissue (cartilage), −800 HU for air-space openings, and +1,100 to +1,500 HU for bone. A: representative images indicating linear line segment placement and relative widths observed; note presence of significant mucous accumulation in the proximal and medial sinus spaces of RWP example, shown as strong yellow signal along midline of sinus passage, compared with heterogeneous yellow and black signals in the distal sinus area in the same image. Length scale within images shown at left is in millimeters; image voxel intensity (in HU) color band is shown at right, indicating air at bottom with dark color and bone at top with bright yellow color; virtual image slice number is indicated at lower right. B: image terrain/density analyses for each of the images shown above in A, with lower densities along the ordinate indicating air spaces and higher densities along the ordinate indicating dense bony and cartilaginous structures of the sinus. VI (ordinate), voxel intensity (in HU). Min, Max, Mean, and StdDev for VI signal running from 0 to 10–12 mm of profiled linear distance (abscissa) are shown at bottom of each picture in B. Dashed, black line indicates −400-HU image density reference point, at which cumulative width (W) measures were made, as shown for naïve (W1 + W2), RWP (W1 + W2 + W3 + W4 + W5), and RWP + fluticasone (W1 + W2). C: average cumulative linear widths (means ± SE) across groups. *P < 0.05 vs. naïve, ^P < 0.05 vs. RWP. naïve, n = 5; RWP, n = 4; RWP + fluticasone, n = 5. n.s., Not significant.
Fig. 7.
Fig. 7.
A: pictures of 3-dimensional whole sinus images of guinea pigs from naïve (n = 5), ragweed pollen (RWP)-challenged (n = 5), and RWP + fluticasone (Flutic; 100 µg; n = 4) groups. B: whole sinus air volume as measured by microcomputed tomography (micro-CT) in the same groups as indicated in A. Statistical significance is indicated as *P < 0.05 compared with naïve and ^P < 0.05, RWP + Flutic compared with RWP alone. C: sinus fluid-fill volume (SFFV) measurements in the same treatment groups as pictured in A; significance symbols as in B. D: association of sinus volume measured with the SFFV method and the whole sinus air volume measured by micro-CT for guinea pigs in AC with linear regression equation (y = 6.08x) and correlation coefficient (r2 = 0.989) as shown; regression was constrained to pass through the origin of the plot; standard error and lower and upper confidence limits of slope were 0.38, 4.89, and 7.27, respectively.
Fig. 8.
Fig. 8.
A: oblique-angle view of 3-dimensional (3-D) naïve guinea pig full-sinus image indicating anatomic and sinus-length landmarks used for microcomputed tomography (micro-CT) image slice analysis, with air-space volume indicated by blue coloration. Nostrils and eye sockets provided the proximal and distal whole sinus-length boundaries, from which the 25, 50, and 75% sinus-length landmarks were derived. B: same oblique-angle view as indicated in A, with micro-CT images of single slices obtained at 25, 50, and 75% sinus-length intervals and with nostril and eye socket slice images at sinus-length extremes for reference. C, left: 2-dimensional picture of the same naïve guinea pig full-sinus image with air-space volume as in Fig. 7, viewed axially (looking down directly on top of the head), to show the full length, and right-angle-to-longitudinal-axis register of the 25, 50, and 75% sinus-length slice landmarks, demarcating the proximal, medial, and distal sinus regions. Right: composite of micro-CT slices taken from 3-D full-sinus image at each length landmark for representative single guinea pigs from the naïve, ragweed pollen (RWP), and RWP + fluticasone treatment groups in which dark blue coloration was used to indicate air spaces within the respective slices at each level. Note 1) the similarity of sinus image topography across sinus landmark levels and guinea pigs in each group and 2) the relative lack of dark blue coloration within the image slices of the RWP examples, indicating reduced air-space volume and increased sinus congestion, compared with the naïve and RWP + fluticasone treatment examples.
Fig. 9.
Fig. 9.
Three sets of microcomputed tomography (micro-CT) image slices taken from three whole sinus three-dimensional micro-CT images of guinea pigs from naïve group (A), ragweed pollen (RWP) group (B), and RWP + fluticasone group (C) to indicate assessment and comparison of sinus air-space area (darker blue coloration) and sinus perimeter (lighter blue coloration) demarcation. Images from the RWP-treated guinea pigs consistently demonstrated a decrease in both the darker and lighter blue coloration compared with those in the naïve and RWP + fluticasone treatment examples.
Fig. 10.
Fig. 10.
A: measurements of sinus air-space area from 25, 50, and 75% sinus-length landmark slices, as shown in Fig. 8 (landmark levels) and Fig. 9 (areas of darker blue), in naïve (n = 5), ragweed pollen (RWP; n = 5), and RWP + fluticasone (n = 4) treatment groups. Data are means ± SE. *P < 0.05 compared with naïve; ^P < 0.05, RWP + fluticasone compared with RWP. n.s., Not significant as compared by ANOVA. B: measurements of sinus surface perimeter from 25, 50, and 75% sinus-length landmark slices, as shown in Fig. 8C (levels shown at left; perimeter outline shown as areas of lighter blue at right; also shown in Fig. 9), in the same naïve, RWP, and RWP + fluticasone treatment groups as in A. Data are means ± SE; significance symbols as in A. C: ratios of sinus air-space area per sinus perimeter, derived from 25, 50, and 75% sinus-length landmark slices, as shown in Figs. 8C and 9 (areas of darker blue and lighter blue), in naïve, RWP, and RWP + fluticasone treatment groups, as in A. Data are means ± SE; significance symbols as in A and B.

References

    1. Bachert C, Marquardt U, Korte M. IgE-positive mast cells play a central role in nasal allergic disease. Am J Rhinol 4: 215–219, 1990. doi:10.2500/105065890782009299. - DOI
    1. Bahekar PC, Shah JH, Ayer UB, Mandhane SN, Thennati R. Validation of guinea pig model of allergic rhinitis by oral and topical drugs. Int Immunopharmacol 8: 1540–1551, 2008. doi:10.1016/j.intimp.2008.06.010. - DOI - PubMed
    1. Bang M, Choi SH, Park J, Kang BS, Kwon WJ, Lee TH, Nam JG. Radiation dose reduction in paranasal sinus CT: with feasibility of iterative reconstruction technique. Otolaryngol Head Neck Surg 155: 982–987, 2016. doi:10.1177/0194599816664335. - DOI - PubMed
    1. Belvisi MG, Birrell MA, Khalid S, Wortley MA, Dockry R, Coote J, Holt K, Dubuis E, Kelsall A, Maher SA, Bonvini S, Woodcock A, Smith JA. Neurophenotypes in airway diseases. Insights from translational cough studies. Am J Respir Crit Care Med 193: 1364–1372, 2016. doi:10.1164/rccm.201508-1602OC. - DOI - PMC - PubMed
    1. Bousquet J, Bachert C, Bernstein J, Canonica GW, Carr W, Dahl R, Demoly P, Devillier P, Hellings P, Fokkens W, Klimek L, Lieberman P, Meltzer E, Price D, Ryan D, Wahn U. Advances in pharmacotherapy for the treatment of allergic rhinitis; MP29-02 (a novel formulation of azelastine hydrochloride and fluticasone propionate in an advanced delivery system) fills the gaps. Expert Opin Pharmacother 16: 913–928, 2015. doi:10.1517/14656566.2015.1020789. - DOI - PubMed

Publication types

MeSH terms

Substances