Multicenter Study
. 2018 Dec:183:757-768.
doi: 10.1016/j.neuroimage.2018.08.053. Epub 2018 Aug 27.

Variability and reliability of effective connectivity within the core default mode network: A multi-site longitudinal spectral DCM study

Affiliations
Multicenter Study

Variability and reliability of effective connectivity within the core default mode network: A multi-site longitudinal spectral DCM study

Hannes Almgren et al. Neuroimage. 2018 Dec.

Abstract

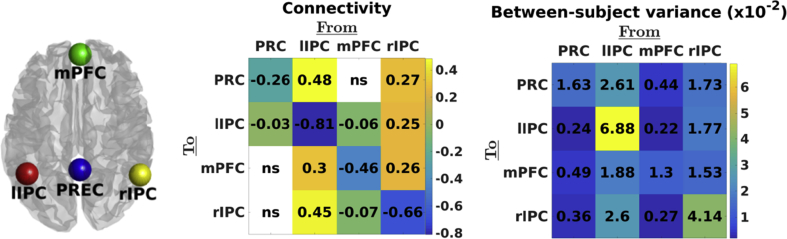
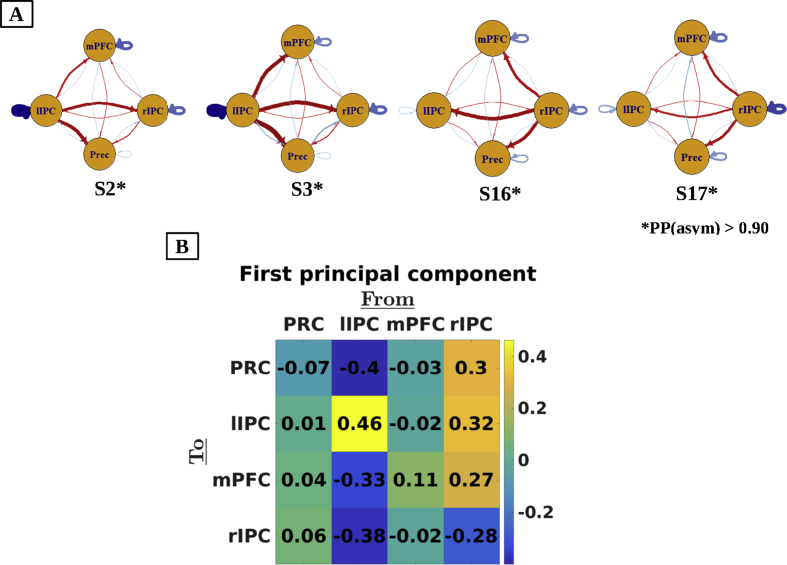
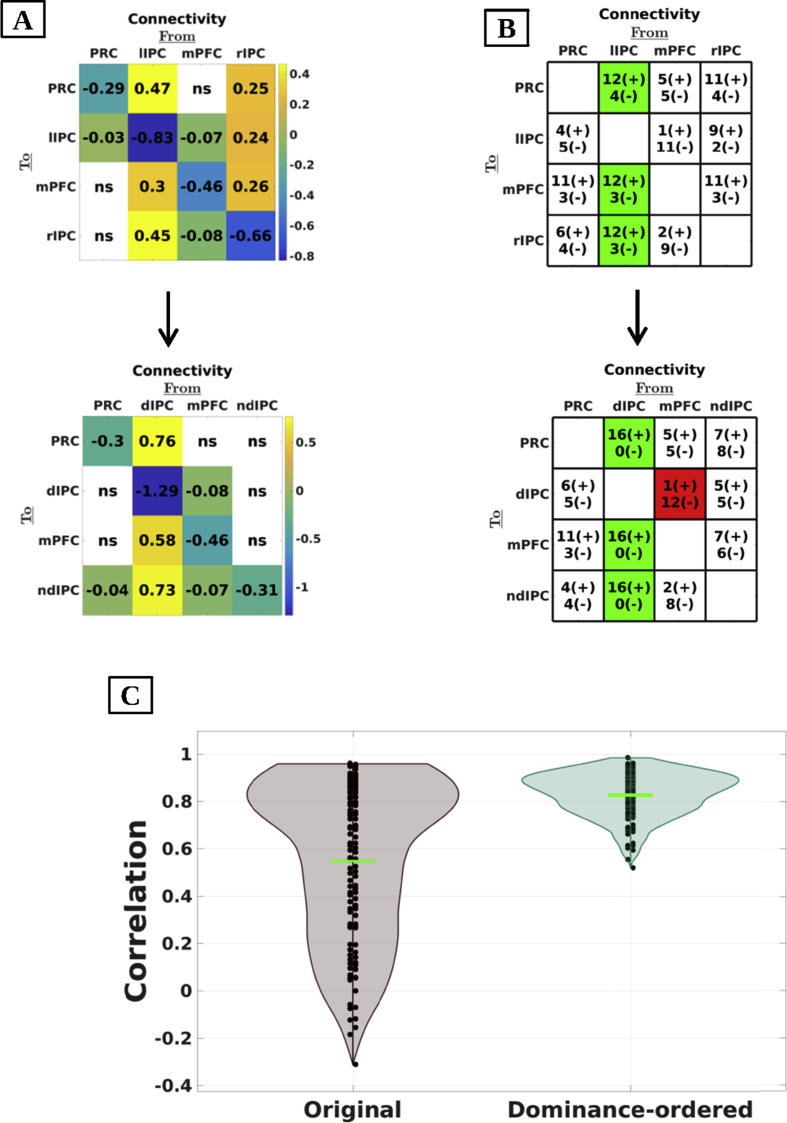
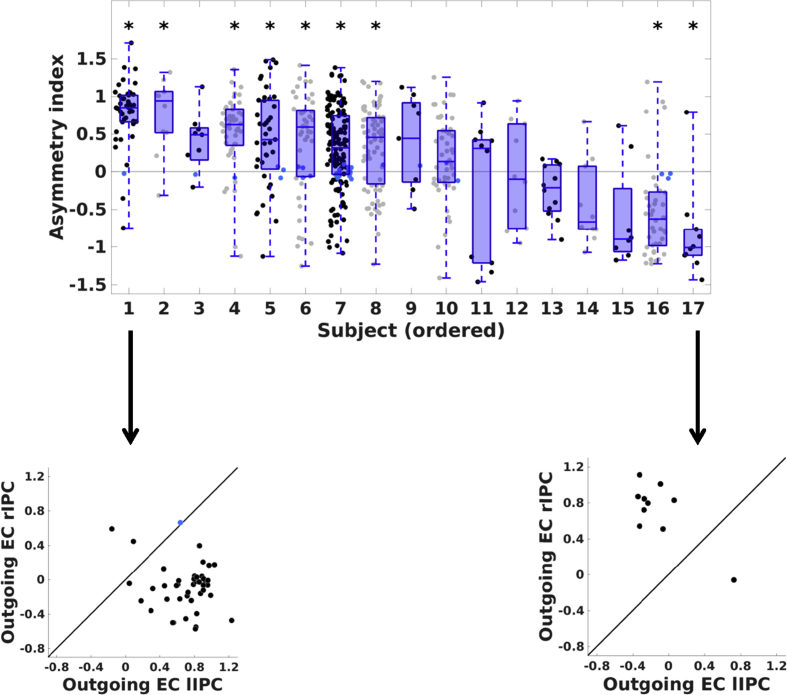
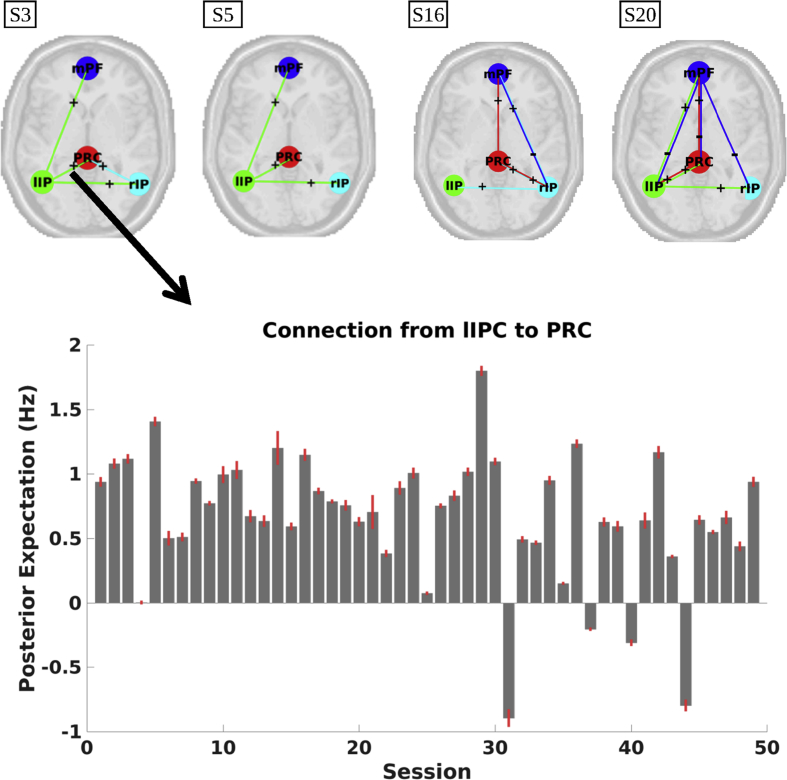
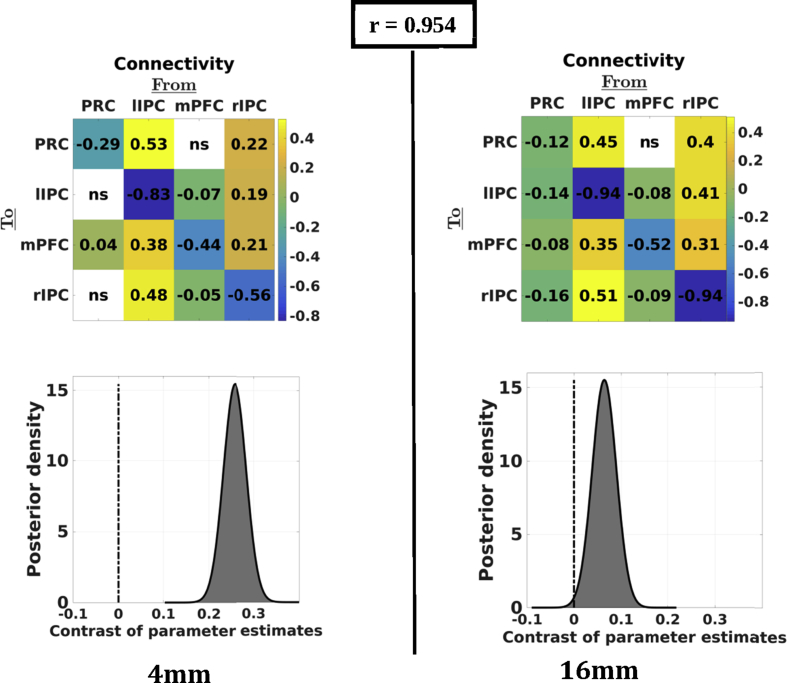
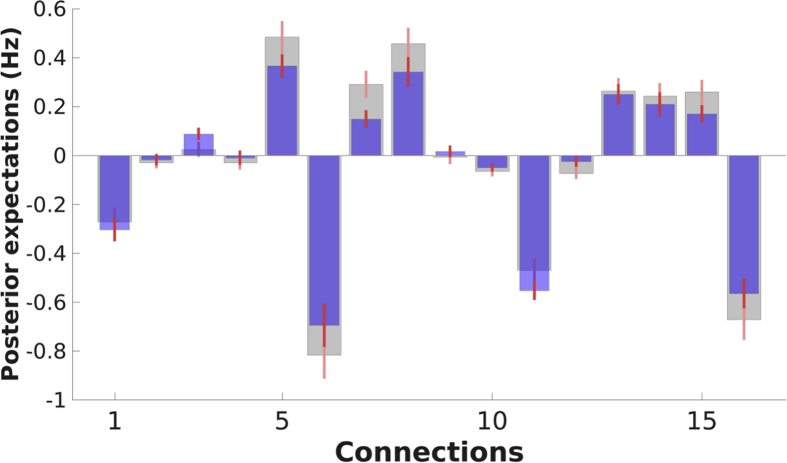
Dynamic causal modelling (DCM) for resting state fMRI - namely spectral DCM - is a recently developed and widely adopted method for inferring effective connectivity in intrinsic brain networks. Most applications of spectral DCM have focused on group-averaged connectivity within large-scale intrinsic brain networks; however, the consistency of subject- and session-specific estimates of effective connectivity has not been evaluated. Establishing reliability (within subjects) is crucial for its clinical use; e.g., as a neurophysiological phenotype of disease progression. Effective connectivity during rest is likely to vary due to changes in cognitive, and physiological states. Quantifying these variations may help understand functional brain architectures - and inform clinical applications. In the present study, we investigated the consistency of effective connectivity within and between subjects, as well as potential sources of variability (e.g., hemispheric asymmetry). We also addressed the effects on consistency of standard data processing procedures. DCM analyses were applied to four longitudinal resting state fMRI datasets. Our sample comprised 17 subjects with 589 resting state fMRI sessions in total. These data allowed us to quantify the robustness of connectivity estimates for each subject, and to generalise our conclusions beyond specific data features. We found that subjects showed systematic and reliable patterns of hemispheric asymmetry. When asymmetry was taken into account, subjects showed very similar connectivity patterns. We also found that various processing procedures (e.g. global signal regression and ROI size) had little effect on inference and the reliability of connectivity estimates for the majority of subjects. Finally, Bayesian model reduction significantly increased the consistency of connectivity patterns.

Keywords: Dynamic causal modelling; Effective connectivity; Longitudinal designs; Reliability; Resting state; Variability; fMRI.


Figures

Fig. 1
Fig. 1
Left panel: location of ROIs used in the present study. Middle panel: Estimated effective connectivity (from columns to rows) at the group level. Diagonal elements reflect self-inhibition parameterised in log-scale (relative to the prior mean of −0.5 Hz). A posterior probability criterion of 90% was used (ns depicts not significant, i.e., posterior probability below 90%). Right panel: estimated between-subject variability for each connection (PEB.Ce). It is evident that the left and right IPC showed the greatest between-subject variability in self-inhibition (log-scale) and extrinsic connectivity (hertz).
Fig. 2
Fig. 2
Panel A: Connectivity patterns for exemplar subjects. For extrinsic connections (i.e., between regions), red lines denote positive connectivity and blue lines negative connectivity. For self-connections, red lines depict connectivity above the prior mean, while blue lines depict connectivity below the prior mean (i.e., −0.5 Hz). Line thickness and brightness reflect the strength of the respective connection. Across datasets, subjects showed most dominant influence from either left (e.g., S2 and S3) or right IPC (e.g., S16 and S17). Moreover, self-inhibition was lowest for the dominant IPC in 15 subjects. Panel B: Loadings on the first principal component of effective connectivity across subjects. Coefficients of the left and right IPC show opposite signs. Self-connections (shown on diagonal in negative log-scale) have opposite loadings compared to ipsilateral extrinsic (off-diagonal) connections, which indicates that subjects with high extrinsic influence show high self-inhibition of the ipsilateral IPC.
Fig. 3
Fig. 3
Panel A: Effective connectivity at group-level using original and dominance-ordered matrices. When hemispheric dominance was accommodated at the subject-level, results suggest that the non-dominant hemisphere has no outgoing effective connectivity and is slightly inhibited by medial regions. Ns depicts not significant (i.e., posterior probability below 90%). Panel B: Number of subjects with excitatory (positive) or inhibitory (negative) influences (posterior probability > 90%; effective connectivity from column to row regions). Connections that were positive or negative in more than 70% of subjects are shown in green or red, respectively. Self-connections are omitted for simplicity. The dominant IPC showed positive influence on all other regions, while the influence of the non-dominant IPC differed between subjects. Moreover, the left mPFC exerted inhibitory influence on the dominant IPC in 12 out of 16 (75%) asymmetric subjects. Panel C: Violin plots of correlations between left-right (left plot) and dominance-ordered (right plot) connectivity-matrices for all possible pairs of subjects. Horizontal green lines depict the mean correlation. The consistency is significantly greater when hemispheric dominance was taken into account. Anatomical labels: PRC = precuneus; mPFC = medial prefrontal cortex; dIP = dominant inferior parietal cortex; ndIP = non-dominant inferior parietal cortex; l/rIPC = left/right inferior parietal cortex.
Fig. 4
Fig. 4
Upper panel: Session-specific hemispheric asymmetry for all subjects, in order of decreasing proportion of left hemisphere-dominant sessions. The asymmetry index was computed as the average efferent influence from the left minus the mean efferent influence from the right IPC. Dots represent the asymmetry index for each session of the respective subject (positive = left dominant; negative = right dominant). Blue dots depict sessions without evidence for hemispheric dominance. Asterisks above data clouds indicate subjects with stability in asymmetry significantly different from zero (FDR = 5%). Blue box plots of subject-specific asymmetry indices are superimposed on data clouds. Lower panels: Hemispheric asymmetry for the most stable left and right asymmetric subject. Black circles represent the average outgoing influence from left (x-axis) and right IPC (y-axis). Circles below the reference line indicate sessions with higher influence from left IPC, circles above the reference line depict sessions with higher influence from right IPC. Light-blue circles depict sessions for which asymmetry did not survive the posterior probability criterion.
Fig. 5
Fig. 5
Upper panel: Connections having the same sign in at least 75% of sessions within the respective (exemplar) subject. The line colours depict the source of a connection (e.g., green lines depict connections from the lIPC to other regions). Stable connections arise from left or right IPC, which nicely coincides with the subject-specific asymmetry. For visualization purposes the precuneus is shown more anteriorly than in reality. Lower panel: Posterior estimates of the strongest connection for subject 3, plotted against session number.
Fig. 6
Fig. 6
Group-average connectivity for the smallest and largest ROI sizes. Upper panels: effective connectivity matrices for each ROI size at the group-level. Upper number indicates the correlation between (vectorised) matrices. Lower panels: asymmetry of the group-level network (positive = left dominant; negative = right-dominant). Larger ROI sizes yielded less asymmetry at the group level. However, even at bigger ROIs the network was left-dominant (see posterior probability). Ns depicts not significant (i.e., posterior probability below 90%).
Fig. 7
Fig. 7
Group-average connectivity with GSR (blue bars), with narrow red bars showing 90% confidence intervals (i.e., Bayesian credible intervals) and without GSR (grey bars). Generally, extrinsic connectivity decreased in magnitude, while intrinsic connections changed in either positive or negative direction. However, no dramatic changes (e.g., significant changes in sign) were found.

References

    1. Agcaoglu O., Miller R., Mayer A.R., Hugdahl K., Calhoun V.D. Lateralization of resting state networks and relationship to age and gender. Neuroimage. 2015;104:310–325. doi: 10.1016/j.neuroimage.2014.09.001. - DOI - PMC - PubMed
    1. Benjamini Y., Hochberg Y. Controlling the false discovery rate: a practical and powerful approach to multiple testing. J. Roy. Stat. Soc. B. 1995;57(1):289–300. http://www.jstor.org/stable/2346101
    1. Buxton R.B., Wong E.C., Frank L.R. Dynamics of blood flow and oxygenation changes during brain activation: the balloon model. Magn. Reson. Med. 1998;39(17):855–864. doi: 10.1002/mrm.1910390602. - DOI - PubMed
    1. Choe A.S., Jones C.K., Joel S.E., Muschelli J., Belegu V., Caffo B.S., Pekar J.J. Reproducibility and temporal structure in weekly resting-state fMRI over a period of 3.5 years. PLoS One. 2015;10(10):1–29. doi: 10.1371/journal.pone.0140134. - DOI - PMC - PubMed
    1. Damoiseaux J.S., Rombouts S.A.R.B., Barkhof F., Scheltens P., Stam C.J., Smith S.M., Beckmann C.F. Consistent resting-state networks across healthy subjects. Proc. Natl. Acad. Sci. Unit. States Am. 2006;103(37):13848–13853. doi: 10.1073/pnas.0601417103. - DOI - PMC - PubMed

Publication types

LinkOut - more resources