Observational Study
. 2019 Apr 24;68(9):1502-1511.
doi: 10.1093/cid/ciy739.

A Prognostic Model of Persistent Bacteremia and Mortality in Complicated Staphylococcus aureus Bloodstream Infection

Affiliations
Observational Study

A Prognostic Model of Persistent Bacteremia and Mortality in Complicated Staphylococcus aureus Bloodstream Infection

Alessander O Guimaraes et al. Clin Infect Dis. .

Abstract

Background: Staphylococcus aureus is a leading cause of bacteremia, yet there remains a significant knowledge gap in the identification of relevant biomarkers that predict clinical outcomes. Heterogeneity in the host response to invasive S. aureus infection suggests that specific biomarker signatures could be utilized to differentiate patients prone to severe disease, thereby facilitating earlier implementation of more aggressive therapies.

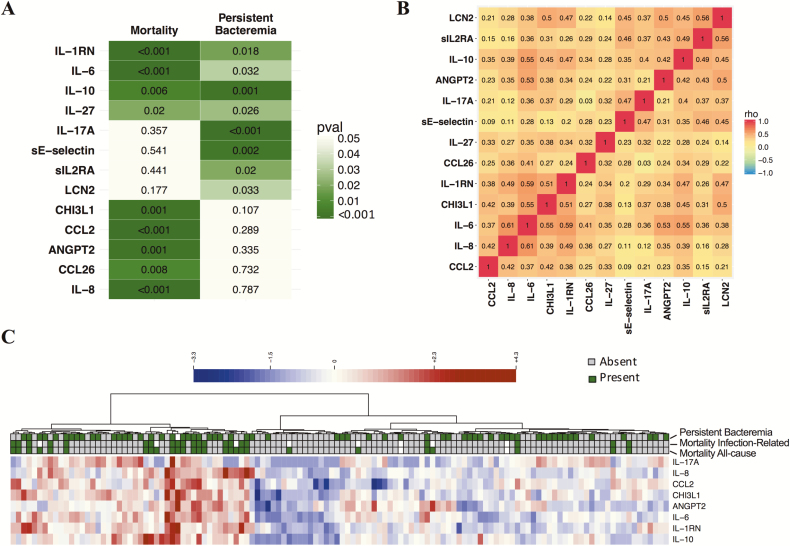
Methods: To further elucidate the inflammatory correlates of poor clinical outcomes in patients with S. aureus bacteremia, we evaluated the association between a panel of blood proteins at initial presentation of bacteremia and disease severity outcomes using 2 cohorts of patients with S. aureus bacteremia (n = 32 and n = 124).

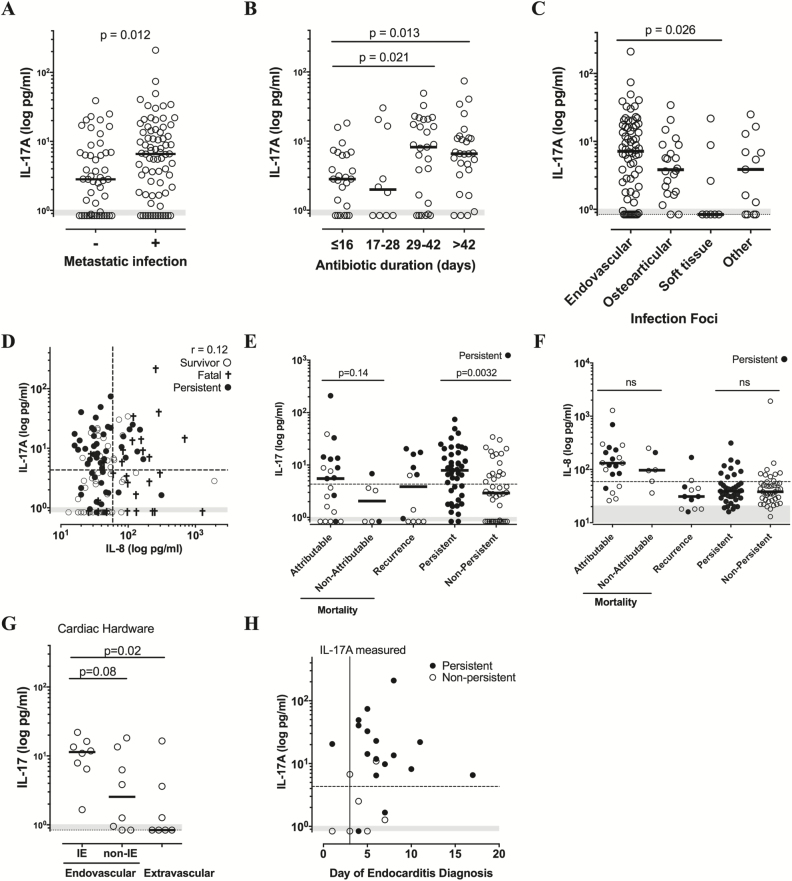
Results: We identified 13 candidate proteins that were correlated with mortality and persistent bacteremia. Prognostic modeling identified interleukin (IL)-8 and CCL2 as the strongest individual predictors of mortality, with the combination of these biomarkers classifying fatal outcome with 89% sensitivity and 77% specificity (P < .0001). Baseline IL-17A levels were elevated in patients with persistent bacteremia (P < .0001), endovascular (P = .026) and metastatic tissue infections (P = .012).

Conclusions: These results demonstrate the potential utility of selected biomarkers to distinguish patients with the highest risk for treatment failure and bacteremia-related complications, providing a valuable tool for clinicians in the management of S. aureus bacteremia. Additionally, these biomarkers could identify patients with the greatest potential to benefit from novel therapies in clinical trials.

Keywords: Staphylococcus aureus; bacteremia; endocarditis; prognostic biomarkers.


Figures

Figure 1.
Figure 1.
Prognostic biomarker candidates prioritized in the exploratory study. A, Study overview. B, In sum, 31 of the 64 evaluated proteins were differentially expressed in patients with mortality or persistent bacteremia. Mortality: survivor vs. all-cause in-hospital mortality. Persistent bacteremia: clearance of blood culture within 5 days of initial diagnostic positive blood culture vs. positive blood culture for 5+ days. Wilcoxon rank sum test P < .1, n = 32. C, Heatmap of the 31 differentially expressed cytokines. Patients were grouped into 2 overall groups by unsupervised clustering as shown by the dendrograms. Abbreviations: IL, interleukin; SAB, S. aureus bacteremia.
Figure 2.
Figure 2.
Serum proteins prognostic for mortality and persistent bacteremia in the validation study. A, Baseline serum proteins that were significantly different between all-cause mortality vs survivors or persistent bacteremia (positive blood cultures for 5+ days) vs microbiological clearance within 5 days; P < .05. B, Spearman correlation matrix of the biomarkers shown in panel A. C, Unsupervised clustering heat map of patients based on biomarkers prognostic for mortality and/or persistent bacteremia with P ≤ .001. Wilcoxon rank sum test P values are shown for n = 124.
Figure 3.
Figure 3.
Mortality prognostic biomarkers in the validation study. A, Area under the ROC curve and Wilcoxon rank sum test P-values for the biomarker and clinical variables that differed between S. aureus patients who died or survived in the validation study with P < .05. B, ROC curves showing the power to discriminate fatal outcomes from survivors: age (AUC = 0.68; 95% CI: 0.57 to 0.79), the only demographic or clinical variable at baseline with discriminatory power; CCL2 (AUC = 0.81; 95% CI: 0.72 to 0.91); IL-8 (AUC = 0.83; 95% CI: 0.74 to 0.92), and the combined IL-8 and CCL2 prognostic model (AUC = 0.89; 95% CI: 0.82 to 0.96). C, Spearman correlation matrix of the 8 serum proteins that were prognostic for mortality with P < .01. Patients with fatal outcomes present with higher biomarker levels than survivors for (D) IL-8, (E) CCL2, and (F) the combined IL-8 and CCL2 model. Medians and interquartile ranges, Wilcoxon rank sum test P values, and the sensitivity and specificity of illustrative cutoff values from the S. aureus patient group ROC analysis (represented as dashed lines) are shown. Gray shaded area represents the healthy control range (n = 16). G, Scatter plot showing correlation of baseline IL-8 and CCL2 serum concentrations; Spearman rank correlation test, n = 124. Abbreviations: AUC, area under the curve; CI, confidence interval; IL, interleukin; ROC, receiver operating characteristic.
Figure 4.
Figure 4.
Persistent bacteremia prognostic biomarkers in the validation study. A, Area under the ROC curve and Wilcoxon rank sum test P-values for the serum proteins that differed between S. aureus patients who had persistent bacteremia vs. nonpersistent cases, P < .05. No single demographic or clinical data at baseline was significantly different between these 2 patient groups. B, ROC curves showing the optimal serum proteins with power to discriminate persistent bacteremia from nonpersistent cases: IL-17A (AUC = 0.73; 95% CI: 0.64 to 0.82); IL-10 (AUC = 0.68; 95% CI: 0.58 to 0.77), and sE-selectin (AUC = 0.66; 95% CI: 0.56 to 0.75). Patients with persistent bacteremia present with higher median biomarker levels than patients who clear their bloodstream infection within 5 days for: (C) IL17A, (D) IL-10, and (E) sE-selectin. Wilcoxon rank sum test P-values and the sensitivity and specificity of the illustrative cutoff value from ROC analysis represented as dashed lines. Scatter plots of baseline serum concentrations for (F) IL-17A, (G) IL-10, and (H) sE-selectin vs. days to last positive blood culture; n = 124. Spearman rank correlation test and gray shaded area represents the range of the healthy control values. Abbreviations: AUC, area under the curve; BC, blood cultures; CI, confidence interval; IL, interleukin; ROC, receiver operating characteristic.
Figure 5.
Figure 5.
IL-17A is associated with endovascular infections, longer duration of antibiotic therapy, and infection-related mortality. A, IL-17A is elevated at baseline in patients with identified metastatic foci of infection; n = 124. B, IL-17A levels by days of antibiotic treatment following negative blood culture, with fatal cases excluded; n = 90. C, Baseline IL-17A by infection foci in complicated SAB patients, n = 124. D, Scatter plot of baseline IL-17A vs. IL-8 levels; Spearman rank correlation test, n = 124. EF, Baseline IL-17 or IL-8 levels in patient subset by disease outcome: mortality (infection-related vs. not attributed to the infection), recurrence of SAB within 90 days, or clinical cure (persistent vs. nonpersistent bacteremia). Fatal and recurrent cases with persistent bacteremia are shaded; n = 124. G, Baseline IL-17A levels in patients with cardiac hardware (implanted pacemakers or cardiac valves) subdivided by diagnosed endovascular (infective endocarditis (IE) vs. noninfective endocarditis) vs. extravascular infection. H, Measurement of high IL-17A precedes diagnosis of infective endocarditis. Baseline IL-17A levels measured within 3 days are plotted vs. time of infective endocarditis diagnosis by imaging of cardiac vegetation. Days from time of antibiotic therapy are shown. Patients with persistent bacteremia are shown by filled circles. For all panels, medians and Wilcoxon rank sum test P-value are shown, dashed line is an illustrative IL-17A cutoff with maximal sensitivity and specificity, LLOQ = 0.8 pg/mL IL-17A and 0.4 pg/mL IL-8, and gray shaded area represents the range of the healthy control values (n = 16). Abbreviations: IE, infective endocarditis; IL, interleukin; ns, not significant; SAB, S. aureus bacteremia.

Similar articles

Cited by

References

    1. Corey GR. Staphylococcus aureus bloodstream infections: definitions and treatment. Clin Infect Dis 2009; 48(Suppl 4):S254–9. - PubMed
    1. Lindsay JA, Holden MT. Understanding the rise of the superbug: investigation of the evolution and genomic variation of Staphylococcus aureus. Funct Integr Genomics 2006; 6:186–201. - PubMed
    1. van Hal SJ, Jensen SO, Vaska VL, Espedido BA, Paterson DL, Gosbell IB. Predictors of mortality in Staphylococcus aureus bacteremia. Clin Microbiol Rev 2012; 25:362–86. - PMC - PubMed
    1. Fowler VG Jr, Olsen MK, Corey GR, et al. . Clinical identifiers of complicated Staphylococcus aureus bacteremia. Arch Intern Med 2003; 163:2066–72. - PubMed
    1. Casapao AM, Jacobs DM, Bowers DR, Beyda ND, Dilworth TJ; REACH-ID Study Group Early administration of adjuvant β-lactam therapy in combination with vancomycin among patients with methicillin-resistant Staphylococcus aureus bloodstream infection: a retrospective, multicenter analysis. Pharmacotherapy 2017; 37:1347–56. - PubMed

Publication types

MeSH terms