. 2018 Nov 2;46(19):9990-10006.
doi: 10.1093/nar/gky750.

High-resolution analysis of the pneumococcal transcriptome under a wide range of infection-relevant conditions

Affiliations

High-resolution analysis of the pneumococcal transcriptome under a wide range of infection-relevant conditions

Rieza Aprianto et al. Nucleic Acids Res. .

Abstract

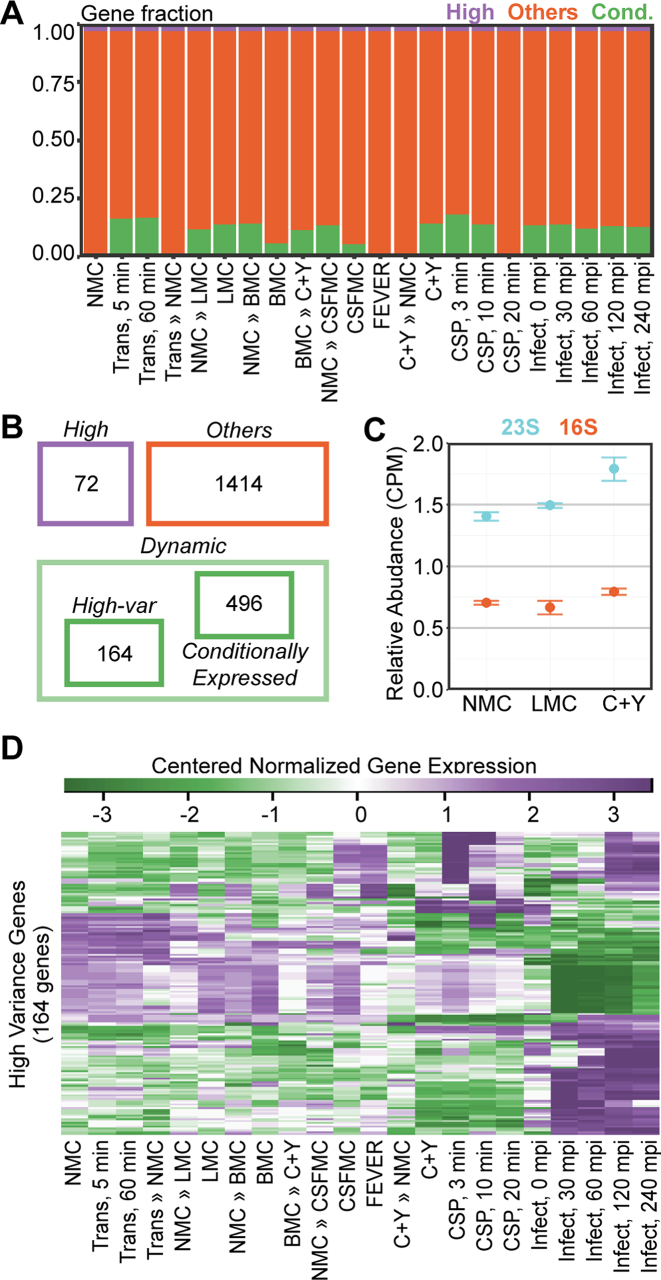
Streptococcus pneumoniae is an opportunistic human pathogen that typically colonizes the nasopharyngeal passage and causes lethal disease in other host niches, such as the lung or the meninges. The expression and regulation of pneumococcal genes at different life-cycle stages, such as commensal or pathogenic, are not entirely understood. To chart the transcriptional responses of S. pneumoniae, we used RNA-seq to quantify the relative abundance of the transcriptome under 22 different infection-relevant conditions. The data demonstrated a high level of dynamic expression and, strikingly, all annotated pneumococcal genomic features were expressed in at least one of the studied conditions. By computing the correlation values of every pair of genes across all studied conditions, we created a co-expression matrix that provides valuable information on both operon structure and regulatory processes. The co-expression data are highly consistent with well-characterized operons and regulons, such as the PyrR, ComE and ComX regulons, and have allowed us to identify a new member of the competence regulon. Lastly, we created an interactive data center named PneumoExpress (https://veeninglab.com/pneumoexpress) that enables users to access the expression data as well as the co-expression matrix in an intuitive and efficient manner, providing a valuable resource to the pneumococcal research community.


Figures

Figure 1.
Figure 1.
Mimicking conditions relevant to the opportunistic pathogen lifestyle. (A) Twenty-two conditions were selected, including growth in five different conditions (laboratory, in C+Y medium [C+Y], NMC, LMC, BMC and CSFMC); a model of meningeal fever (FEVER); transmission conditions; eight transfers between conditions; three competence time-points and five epithelial co-incubation time-points (Table 1). (B) cDNA libraries were prepared without rRNA depletion. Quality controls of the reads were performed before and after trimming. Trimmed reads were aligned and counted. Next, highly and conditionally expressed genes were categorized based on normalized read counts, while high- and low-variance genes were classified based on fold changes. High-variance and conditionally expressed genes together were defined as dynamic genes.
Figure 2.
Figure 2.
Distribution of libraries and conditions. (A) The number of trimmed reads of the 43 libraries ranged from 26 to 149 million reads, averaging 89 million reads. Non-rRNA-depleted libraries were dominated by reads mapped to ribosomal RNA genes, averaging 95% (range: 93–98%, libs. 1–34). (B) Principal component analysis of gene expression in all conditions showed three clusters of conditions: conditions based on competence (CSP, 3, 10 and 20 min; purple), epithelial infection (infection 0, 30, 60, 120 and 240 mpi; green) and other infection-relevant conditions (orange). 1 = Transmission » NMC; 2 = NMC » LMC; 3 = BMC » C+Y.
Figure 3.
Figure 3.
Categorization of genes. (A) Visualization of the number of genes in all conditions according to their categories: steadily highly expressed (purple), conditionally expressed (green) and others (orange). Of the 2146 features, 73 are classified as highly expressed, while 498 features are conditionally expressed (lowly expressed in at least one condition). (B) Highly expressed genes include essential genes, genes encoding ribosomal proteins and rRNAs. Dynamic genes are a combination of the 164 high-variance genes and 498 conditionally expressed genes. (C) The 23S rRNA was significantly downregulated in nose-mimicking (NMC) and lung-mimicking (LMC) growth compared to rich C+Y growth (P < 0.05). The 16S rRNA showed a similar trend, but it was not statistically significant (P = 0.33, C+Y to NMC; P = 0.83, C+Y to LMC; error bars represent standard error). (D) Expression values (regularized log) of high-variance genes were centered, as described in Supplementary Materials and Methods, and plotted as heat maps. Distinct clusters of gene expression can readily be observed (purple: high expression, green: low expression).
Figure 4.
Figure 4.
Temperature-responsive genes. (A) A cluster containing 19 genes was recovered from the clustering analysis based on the TPM values across 22 conditions. Comparisons were selected that demonstrate the fold change of cluster members (log2) in orange as compared to those of other genome-wide genes in light blue. Comparison 1 is CSFMC to FEVER; 2 is NMC to NMC » LMC; 3 is NMC to NMC » BMC; 4 is NMC to NMC » CSFMC; 5 is NMC to Trans, 5 min; 6 is C+Y to C+Y » NMC; and 7 is BMC to BMC » C+Y. (B) Motif enrichment analysis between 60 and 10 nts upstream of the transcription start sites of the six-membered operons resulted in a 20-nt wide CtsR-binding site, CTTGACHTTTTCTGACCAAG. (C) A genome-wide search for CtsR sites recovered four operons with a reported CtsR site that belonged to the original 19-gene cluster and one other gene, clpE. CtsR sites overlap with RpoD sites, and groESL expression is co-regulated by HrcA. *clpE is preceded by non-overlapping RpoD- and CtsR-binding sites.
Figure 5.
Figure 5.
Condition-specific gene expression. (A) ABC transporters are strongly over-represented among condition-specific genes. The expression of malXCD, which encodes the maltose/maltodextrin transporter, peaks in Infection, 30 mpi, while msmEFG, which encodes a multi-sugar transporter, is highly expressed in NMC and to a lesser degree in LMC, C+Y » NMC and FEVER. Infection conditions (30 and 60 mpi) incite the expression of livFGMHJ, which encodes the BCAA transporter, and the transfer between C+Y to NMC (C+Y » NMC) activates the expression of appABCD, encoding an oligopeptide transporter. Purple indicates high expression and green indicates low expression, as indicated by the legend above the graph. (B) The upstream region of appABCD contains the RpoD- and CcpA-binding sites. luc is transcriptionally fused after appD. (C) While growth is barely affected by different carbon sources, the luciferin signal increases in the presence of N-acetylglucosamine. Glc: glucose; Comb.: equimolar combination of glucose and N-acetylglucosamine; GlcNAc: N-acetylglucosamine.
Figure 6.
Figure 6.
Assembly of the co-expression matrix from the correlation values of every two pneumococcal genes. (A) The exhaustive fold changes calculated for every set of two genes are converted into a correlation value: first, the dot-product between two genes (a, orange) and the dot product of each gene with itself (b and c, blue) are calculated. The correlation value is the ratio between a and the geometric mean of b and c. Values were assembled by the genomic coordinates of the target genes. (B) The co-expression matrix as a visualized gene network. Self-correlation values are 1 by definition and correlation values were plotted according to the genomic positions of target genes. Purple and green indicate positive and negative correlation values between two genes, respectively. Color intensities represent correlation strength. Blocks of highly correlated genes close to the matrix diagonal indicate operon structures, for example for the cps operon (inset). (C) An enriched promoter motif recovered from genes highly correlated with dprA (SPV_1122) matches the consensus ComX-binding site (78). (D) Pneumococcal genes were clustered into 25 clusters based on TPM. Then, correlation values for every two genes within each cluster were plotted. Cluster 0 is non-modular, and its correlation values can be considered as random. Within-cluster values showed a clear trend toward higher correlation (purple).
Figure 7.
Figure 7.
The co-expression matrix reveals a new competence-regulated gene. (A) The gene encoding the pneumococcal response regulator, ComE, was used to recover 26 highly correlated features (orange diamonds). The group is mainly populated by known members of the ComE regulon, except for SPV_0391, a conserved hypothetical gene not previously reported to be part of the competence regulon. (B) Centered regularized log as expression values of SPV_0391 (orange) and comCDE (shades of blue) were plotted against the shortest tour of infection-relevant conditions. Expression values of the four genes closely clustered together. (C) Genomic environment of SPV_0391 with two preceding ComE boxes. SPV_0391 shared an operon structure with a pseudogene, ydiL. (D) luc was transcriptionally fused downstream of SPV_0391 or comCDE to characterize their expression profiles with and without the addition of exogenous CSP-1 (100 ng/μl). The addition of exogenous CSP-1 incited similar luminescence profiles in SPV_0391-luc and in comCDE-luc strains.
Figure 8.
Figure 8.
An intuitive interactive database for accessing expression and correlation data. (A) Users can specify their gene(s) of interest in the field ‘Genes’. Other settings, including normalization method, color scales and graph dimensions, can be adjusted under ‘Advanced options’. Multiple genes of interest are queried separated by commas. The immediate genomic environment of the gene(s) of interest can be explored in PneumoBrowse by clicking the locus tag in the result table. (B) Target expression values are plotted against infection-relevant conditions, and the values can be downloaded for further analysis. The example shown consists of three competence genes. Hovering on a point reveals more information. To remove the information box, simply click on the point or hover to another point. (C) The co-expression matrix can be mined by a simple inquiry of a gene of interest (general correlation), while specific correlation provides the correlation value between two genes of interest. Additionally, users can specify a desired threshold for co-expression values under ‘Advanced options’. (D) Correlation values to pyrR, noting that self-correlation is 1. Here, the genomic environment can also be browsed by clicking the locus tag in the result table.

References

    1. Troeger C., Forouzanfar M., Rao P.C., Khalil I., Brown A., Swartz S., Fullman N., Mosser J., Thompson R.L., Reiner R.C. et al. . Estimates of the global, regional, and national morbidity, mortality, and aetiologies of lower respiratory tract infections in 195 countries: a systematic analysis for the Global Burden of Disease Study 2015. Lancet. Infect. Dis. 2017; 17:1133–1161. - PMC - PubMed
    1. Kassebaum N.J., Arora M., Barber R.M., Bhutta Z.A., Brown J., Carter A., Casey D.C., Charlson F.J., Coates M.M., Coggeshall M. et al. . Global, regional, and national disability-adjusted life-years (DALYs) for 315 diseases and injuries and healthy life expectancy (HALE), 1990–2015: a systematic analysis for the Global Burden of Disease Study 2015. Lancet. 2016; 388:1603–1658. - PMC - PubMed
    1. Wardlaw T., Salama P., Johansson E.W., Mason E.. Pneumonia: the leading killer of children. Lancet. 2006; 368:1048–1050. - PubMed
    1. Welte T., Torres A., Nathwani D.. Clinical and economic burden of community-acquired pneumonia among adults in Europe. Thorax. 2012; 67:71–79. - PubMed
    1. Henriques-Normark B., Tuomanen E.I.. The pneumococcus: epidemiology, microbiology, and pathogenesis. Cold Spring Harb. Perspect. Med. 2013; 3:a010215. - PMC - PubMed

Publication types

MeSH terms

Substances