. 2018 Aug 31;10(1):63.
doi: 10.1186/s13073-018-0572-z.

Comprehensive antibiotic-linked mutation assessment by resistance mutation sequencing (RM-seq)

Affiliations

Comprehensive antibiotic-linked mutation assessment by resistance mutation sequencing (RM-seq)

Romain Guérillot et al. Genome Med. .

Abstract

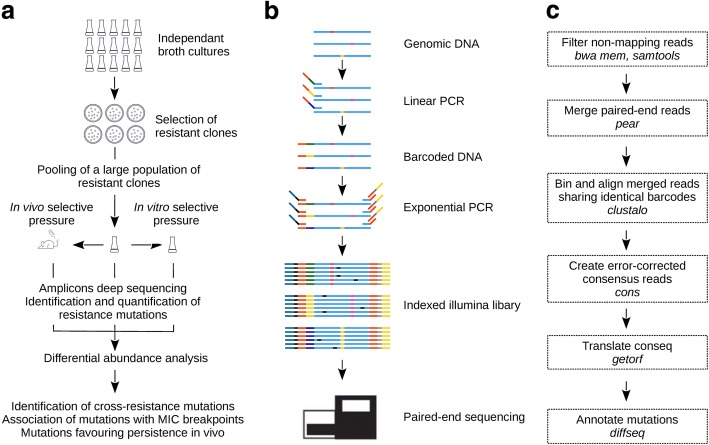
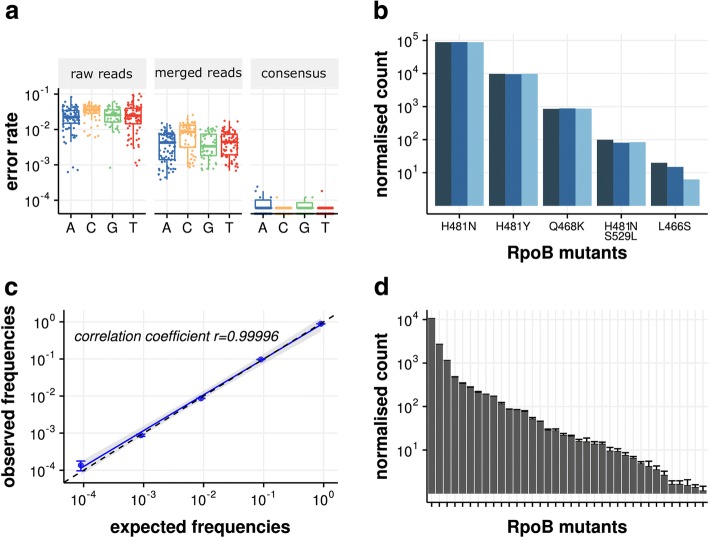
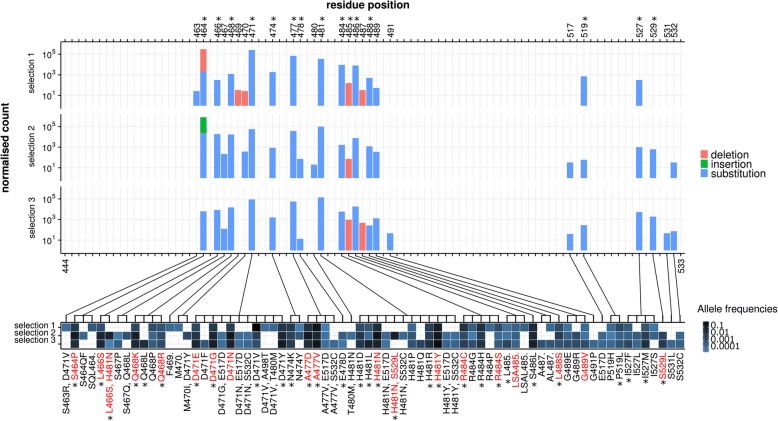
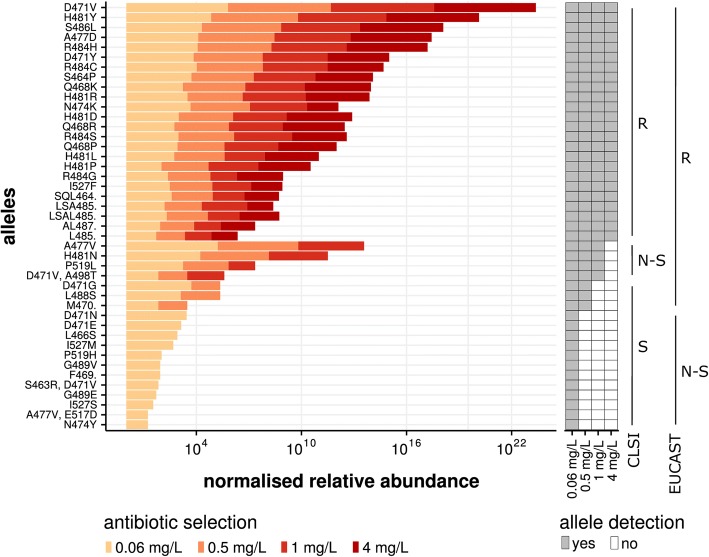
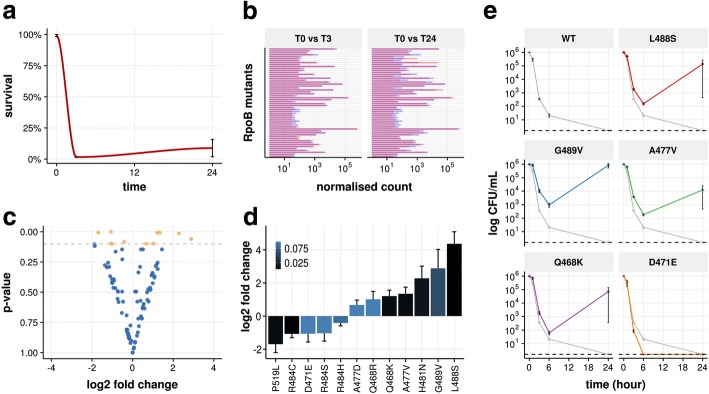
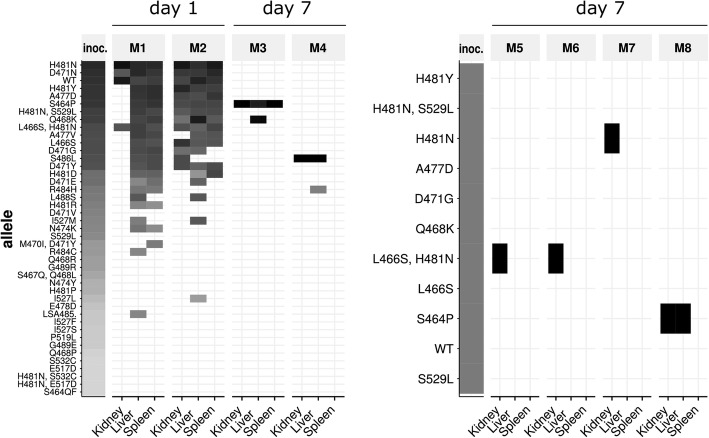
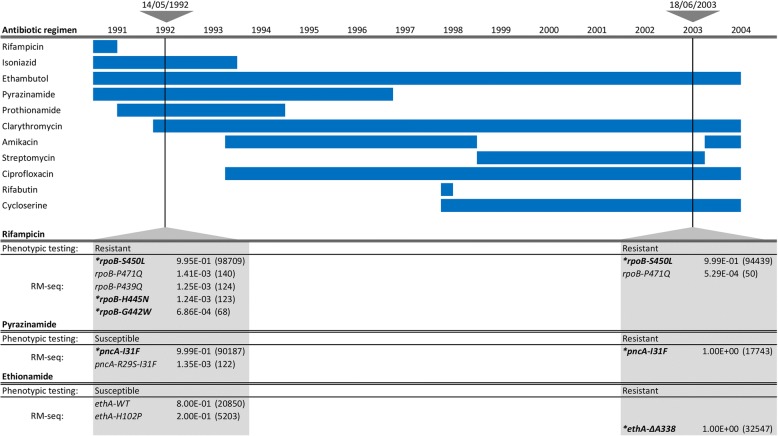
Mutation acquisition is a major mechanism of bacterial antibiotic resistance that remains insufficiently characterised. Here we present RM-seq, a new amplicon-based deep sequencing workflow based on a molecular barcoding technique adapted from Low Error Amplicon sequencing (LEA-seq). RM-seq allows detection and functional assessment of mutational resistance at high throughput from mixed bacterial populations. The sensitive detection of very low-frequency resistant sub-populations permits characterisation of antibiotic-linked mutational repertoires in vitro and detection of rare resistant populations during infections. Accurate quantification of resistance mutations enables phenotypic screening of mutations conferring pleiotropic phenotypes such as in vivo persistence, collateral sensitivity or cross-resistance. RM-seq will facilitate comprehensive detection, characterisation and surveillance of resistant bacterial populations ( https://github.com/rguerillot/RM-seq ).

Keywords: Antibiotic resistance; Daptomycin; Deep sequencing; Mycobacterium tuberculosis; Resistance mutations; Rifampicin; Staphylococcus aureus.


Conflict of interest statement

Ethics approval and consent to participate

Samples from a TB patient were collected as part of the Victorian Department of Health and Human Services TB Control Programme, under the Public Health and Wellbeing Act 2008 (https://www2.health.vic.gov.au/about/legislation/public-health-and-wellbeing-act). Informed consent was obtained from the patient. This research was performed in accordance with the Declaration of Helsinki. Mouse experiments were performed in accordance with protocols approved by the Biochemistry & Molecular Biology, Dental Science, Medicine, Microbiology & Immunology, and Surgery Animal Ethics Committee of the University of Melbourne (approval number 1212591).

Competing interests

The authors declare that they have no competing interests.

Publisher’s Note

Springer Nature remains neutral with regard to jurisdictional claims in published maps and institutional affiliations.

Figures

Fig. 1
Fig. 1
RM-seq workflow. a Schematic view of the experimental design. A large population of resistant clones are selected in vitro from multiple independent cultures. The mutation repertoire selected in a resistance-associated locus is then identified by amplicon deep sequencing. Analysis of the differential abundance of resistance mutations among a resistant clone library before and after a subsequent in vitro (cross-resistance) or in vivo (mouse infection model) selection pressure permits the screening of pleiotropic resistance mutations. b Amplicon library preparation and deep sequencing. Unique molecular barcodes are introduced by linear PCR (template elongation) using a primer comprising a 16 bp random sequence (green, yellow and blue part of the middle section of the linear PCR primer). Nested exponential PCR using three primers adds Illumina adapters (blue and yellow primer tails) and indices for multiplexing (black and grey primer sections). Grouping of the reads sharing identical 16 bp barcodes allows differentiation of true SNPs (red, pink and yellow) from sequencing errors (black) by consensus sequence reconstruction using multiple reads from the initial template molecule. Counting the number of unique barcodes for each variant provides an unbiased relative quantification of sequence variants. c Bioinformatics analysis pipeline. The diagram represents the different steps in the data processing pipeline. The bioinformatics programs used in the pipeline are indicated in italics
Fig. 2
Fig. 2
Assessments of the RM-seq protocol. a Error correction evaluation. RM-seq error correction combining merging of paired-end reads with consensus sequence determination from grouped reads sharing identical barcode allows a three order of magnitude reduction in false SNP calling when compared with raw reads calling for the different base. b Quantification of populations of S. aureus rpoB mutants. Three independent assessments of rpoB mutants from three independent genomic DNA preparations originating from a defined population are presented by the different blue bars (technical replicates). c Correlation of observed versus expected SNV frequencies. Blue points represent means and error bars represent SEM of three technical replicates. The blue line represents the linear regression of the frequencies measured by RM-seq and the dashed line represent the perfect correlation between expected and observed frequencies. d Quantification of S. aureus rpoB mutants from a complex population of in vitro selected rifampicin-resistant mutants. Columns represent mean normalised counts of the different rpoB mutations that were observed among all triplicates, and error bars represent SEM
Fig. 3
Fig. 3
Rifampicin resistance-associated mutations detected by RM-seq. Three independent selection experiments of ~ 10,000 resistant colonies were assessed by RM-seq of the rpoB gene RRDR region. The histograms (upper) represent the normalised mutation counts identified along the sequenced region of the RRDR for the three different selection experiments, with bar colour representing the types of mutation (red for deletions, green for insertions and blue for substitutions). The range of mutations affecting each residue is depicted in the associated heat map (lower panel). The intensity of the blue represents allele frequencies for each selection experiment. Mutations observed from consensus reads reconstructed with at least 10 reads and with a relative frequency greater than 6 × 10−5 or identified from all three independent selection experiments are represented. Resistance mutations that were confirmed by genetic reconstruction are indicated in red (Additional file 1: Table S3). Mutations and positions previously associated with rifampicin resistance are indicated with a star
Fig. 4
Fig. 4
Association of resistance mutations with clinical MIC breakpoints. The histogram represents the relative abundance of individual mutations recovered from the selected sub-population. The colour yellow to red represents the rifampicin concentration used for selection. The antibiotic concentrations were chosen according to the CLSI and EUCAST guidelines (see legend). The detection (grey box) and disappearance (white box) of a particular allele from the population at the different antibiotic selection breakpoints is depicted on the right of the histogram. The presence or absence of allele detection at the different antibiotic concentration breakpoints was used to associate the alleles with sensitive, non-susceptible or resistant classification of the CLSI and EUCAST guidelines (S, susceptible; R, resistant; N-S, non-susceptible)
Fig. 5
Fig. 5
Screening of resistance mutations associated with cross-resistance or collateral sensitivity. a Daptomycin selection (8 mg/L) of a pooled population of in vitro selected rifampicin-resistant clones. Survival was quantified by CFU counting on BHI agar plates at 3 h and 24 h of exposure. Error bars represent ± SEM of three independent exposures to daptomycin. b Rifampicin-resistant mutant quantification of rifampicin mutant before and after 3 h or 24 h of daptomycin exposure. Each bar of the histogram represents the averaged normalised count of the different rpoB mutants in the population. Average quantification of the three replicates at T = 0 and after daptomycin exposure are indicated by blue and red bars respectively. Bars are superimposed for each mutant and overlap of the bars are coloured in purple. Increases and decreases in allele frequencies after daptomycin exposure are indicated by red and blue bars respectively on the top of purple bars. c Volcano plot showing fold change in rpoB alleles frequency after 24 h of daptomycin exposure. Each dot represents a different rpoB mutant. Orange dots represent mutants with p value < 0.1 by Wald test. d Rifampicin resistance mutations associated with significant fold change after 24 h of daptomycin treatment. Mutations with positive and negative log2 fold change are predicted to be associated with cross-resistance and collateral sensitivity to daptomycin, respectively. The intensity of the blue coloration of the bars represents adjusted p values (Wald test). e Daptomycin time kill assays. Rifampicin-resistant mutants were assessed in triplicates (biological replicates), points represent the mean survival at each time point and error bars SD. Dashed lines represent detection limit
Fig. 6
Fig. 6
In vivo detection of rifampicin resistance mutations in a mouse persistence model. The heat maps represent quantification of RpoB mutants in kidney, liver and spleen of eight different mice after 1 or 7 days infection with a complex in vitro selected population (mice M1 to M4 on the left) or with a genetically defined population of rifampicin-resistant clones (mice M5 to M8). The columns labelled “inoc.” represent the initial inoculum. Grey and black boxes represent low and high relative allele abundance
Fig. 7
Fig. 7
Detection of low-frequency resistant sub-populations of M. tuberculosis from sputum samples. Depicted on the top left are the antibiotics used with the date that each treatment was initiated and the duration indicated by the blue horizontal bars. The two triangles at the top of the figure represent the early and late DNA extracts used for RM-seq. The table at the bottom shows phenotypic testing and RM-seq results for rifampicin, pyrazinamide and ethionamide for the two samples tested. For RM-seq results the frequency of each allele is indicated and the number of consensus reads is in parenthesis. Alleles in bold and annotated with star represent alleles known to confer antibiotic resistance. Consensus reads reported were reconstructed from at least six reads and alleles represented by at least 50 consensus reads

Similar articles

Cited by

References

    1. World Health Organization. Antimicrobial resistance: global report on surveillance 2014: World Health Organization; 2014. http://www.who.int/drugresistance/documents/surveillancereport/en/. Accessed 27 July 2018.
    1. Köser CU, Ellington MJ, Peacock SJ. Whole-genome sequencing to control antimicrobial resistance. Trends in Genetics. 2014;30(9):401–7. - PMC - PubMed
    1. Schürch AC, van Schaik W. Challenges and opportunities for whole-genome sequencing based surveillance of antibiotic resistance. Ann N Y Acad Sci. 2017;1388:108–120. doi: 10.1111/nyas.13310. - DOI - PubMed
    1. Van Belkum A, Dunne WM. Next generation antimicrobial susceptibility testing. Journal of clinical microbiology. 2013:JCM–00313. 10.1128/JCM.00313-13. - PMC - PubMed
    1. McArthur AG, Waglechner N, Nizam F, Yan A, Azad MA, Baylay AJ, et al. The comprehensive antibiotic resistance database. Antimicrob Agents Chemother. 2013;57:3348–3357. doi: 10.1128/AAC.00419-13. - DOI - PMC - PubMed

Publication types

MeSH terms