. 2018 Sep 28;361(6409):1380-1385.
doi: 10.1126/science.aau0730. Epub 2018 Aug 30.

Joint profiling of chromatin accessibility and gene expression in thousands of single cells

Affiliations

Joint profiling of chromatin accessibility and gene expression in thousands of single cells

Junyue Cao et al. Science. .

Abstract

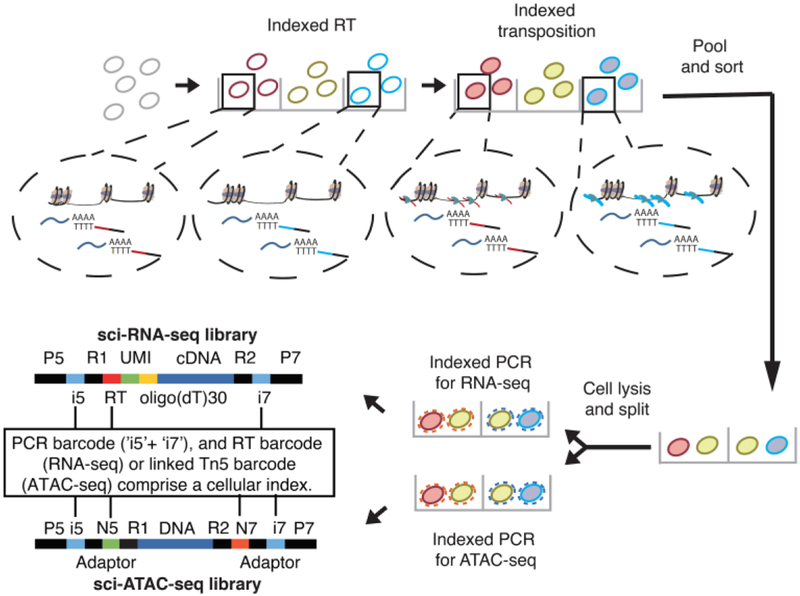
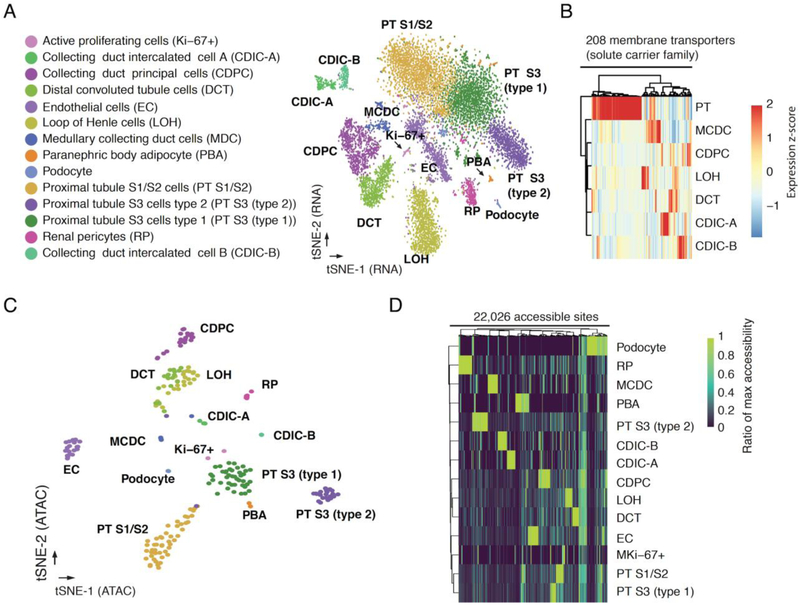
Although we can increasingly measure transcription, chromatin, methylation, and other aspects of molecular biology at single-cell resolution, most assays survey only one aspect of cellular biology. Here we describe sci-CAR, a combinatorial indexing-based coassay that jointly profiles chromatin accessibility and mRNA (CAR) in each of thousands of single cells. As a proof of concept, we apply sci-CAR to 4825 cells, including a time series of dexamethasone treatment, as well as to 11,296 cells from the adult mouse kidney. With the resulting data, we compare the pseudotemporal dynamics of chromatin accessibility and gene expression, reconstruct the chromatin accessibility profiles of cell types defined by RNA profiles, and link cis-regulatory sites to their target genes on the basis of the covariance of chromatin accessibility and transcription across large numbers of single cells.


Conflict of interest statement

Competing interests: L.C. and F.J.S. declare competing financial interests in the form of stock ownership and paid employment by Illumina, Inc. One or more embodiments of one or more patents and patent applications filed by Illumina may encompass the methods, reagents, and data disclosed in this manuscript.

Figures

Fig. 1.
Fig. 1.. sci-CAR workflow.
Key steps outlined in text. RNA-seq: index2 and read1 cover the i5 index, UMI and RT barcode; index1 and read2 cover the i7 index and cDNA fragment. ATAC-seq: read1 and read2 cover genomic DNA sequence. Index 1 and index 2 cover the Tn5 and PCR barcodes.
Fig. 2.
Fig. 2.. Joint profiling of chromatin accessibility and transcription in dexamethasone treated A549 cells.
(A) Scatter plot showing the proportion of human reads, out of all reads mapping uniquely to the human or mouse reference genomes, for cells in which both RNA-seq profiles and ATAC-seq profiles were obtained. Only HEK293T (human) and NIH/3T3 (mouse) cells are plotted. (B) t-SNE visualization of A549 cells (RNA-seq) including cells from both sci-CAR and sci-RNA-seq-only plates, colored by DEX treatment time (left) or unsupervised clustering id (right). (C) t-SNE visualization of A549 cells (ATAC-seq) including cells from both sci-CAR and sci-ATAC-seq-only plates, colored by DEX treatment time (left) or unsupervised clustering id (right). (D) t-SNE visualization of A549 cells (ATAC-seq) with linked RNA-seq profiles. If the cell is in cluster 1 (or cluster 2) in both RNA-seq and ATAC-seq, then it is labeled as “Match”, otherwise it is labeled “Discordant”. (E) Distribution of cells from different DEX treatment timepoints in gene expression pseudotime inferred by trajectory analysis. (F) Smoothed line plot showing scaled (with the R function scale) gene expression and promoter accessibility of CKB and ZSWIM6 across pseudotime. Unscaled, unsmoothed data shown in Fig. S5F–G. (G) Smoothed line plot showing the scaled mRNA level and activity change of transcription factors NR3C1 and KLF9 across pseudotime. Unscaled, unsmoothed data shown in Fig. S6D–E.
Fig. 3.
Fig. 3.. sci-CAR enables joint profiling of chromatin accessibility and transcription in mouse kidney.
(A) t-SNE visualization of mouse kidney nuclei (RNA-seq). Cell types are assigned based on established marker genes. (B) Heatmap showing the relative expression of genes from the solute carrier group of membrane transport proteins in consensus transcriptomes of each cell type estimated by RNA-seq data from the co-assay. The raw expression data (UMI count matrix) was log-transformed, column centered and scaled (using the R function scale), and the resulting values clamped to [−2, 2]. (C) t-SNE visualization of mouse kidney nuclei (ATAC-seq) after aggregating cells with highly similar transcriptomes (‘pseudocells’), colored by cell types identified from RNA-seq. (D) Heatmap showing the relative chromatin accessibility of cell type-specific sites for each cell type estimated by ATAC-seq data from the co-assay. The raw aggregated ATAC-seq data (read count matrix) was normalized first by the total number of reads for each cell type then by the maximum accessibility score across all cell types.
Fig. 4.
Fig. 4.. Linking cis-regulatory elements to regulated genes based on covariance in single cell co-assay data.
(A) Top: genome browser plot showing links between accessible distal regulatory sites and the gene Slc6a18. The height corresponds to the correlation coefficient. Bottom: barplots showing the average expression, promoter accessibility and linked site accessibility for cell type-specific marker gene Slc6a18 across different cell types. Gene expression values for each cell were calculated by dividing the raw UMI count by cell-specific size factors. Site accessibilities for each cell were calculated by dividing the raw read count by cell-specific size factors. Error bars represent standard errors of the means. (B) Two linear regression models were built to predict gene expression differences between cell types. The first model predicts changes on the basis of promoter accessibility alone. The second model predicts changes based on the chromatin accessibility of the promoter and distal sites that are linked to it. The boxplot shows the cross-validated r-squared calculated for each gene from the two models.

Comment in

References

    1. Clark SJ et al., scNMT-seq enables joint profiling of chromatin accessibility DNA methylation and transcription in single cells. Nat. Commun 9, 781 (2018). - PMC - PubMed
    1. Angermueller C et al., Parallel single-cell sequencing links transcriptional and epigenetic heterogeneity. Nat. Methods 13, 229–232 (2016). - PMC - PubMed
    1. Hou Y et al., Single-cell triple omics sequencing reveals genetic, epigenetic, and transcriptomic heterogeneity in hepatocellular carcinomas. Cell Res. 26, 304–319 (2016). - PMC - PubMed
    1. Hu Y et al., Simultaneous profiling of transcriptome and DNA methylome from a single cell. Genome Biol. 17, 88 (2016). - PMC - PubMed
    1. Pott S, Simultaneous measurement of chromatin accessibility, DNA methylation, and nucleosome phasing in single cells. Elife. 6 (2017), doi:10.7554/eLife.23203. - DOI - PMC - PubMed

Publication types